Workshop Getting Started
An Introduction to Capacitive Touch with MSP CapTIvate™ Microcontrollers
This workshop steps through how to get started with the CapTIvate™ ecosystem and the CapTIvate™ Capacitive Touch MCU Development Kit. The workshop consists of tool setup, an out-of-box experience, and three labs. The labs all build on each other to teach capacitive touch tuning techniques, recommended workflow, low power optimization, and software development with the CapTIvate™ capacitive touch library.
Note: Through out this documentation MSP430FR26xx refers to MSP430FR2633 and MSP430FR2676
Workshop Summary
This workshop introduces the CapTIvate ecosystem through hands-on experimentation. The workshop is broken up into four sections which are described below.
Out-of-Box Experience
Explore the CapTIvate Capacitive Touch MCU Development Kit components
Experiment with the features and performance of the MSP430FR26xx CapTIvate MCU without writing or compiling any code
Lab 1: Using the CapTIvate Design Center to Create and Tune Sensors
Learn how to use the CapTIvate Design Center views
Learn the workflow between the CapTIvate Design Center and CCS
Learn basic capacitive touch tuning principles
Lab 2: Experimenting with Low Power Design Techniques
Learn how to use the wake-on-proximity feature
Learn how to tune for the lowest possible power consumption
Use EnergyTrace™ to measure the effects of tuning on power consumption
Lab 3: Using the CapTIvate Software Library
Learn about the sensor management features in the software library
Learn how to use callback functions to get proximity, touch, and position data
Upon completion of this workshop, the user will understand the basics of how to use the CapTIvate Design Center, the CapTIvate Touch Software Library, and the CapTIvate Capacitive Touch MCU Development hardware.
Assumptions
This workshop assumes the following:
The user is reasonably familiar with MSP430 microcontroller architecture
The user is comfortable with Code Composer Studio v6 and its features, and has Code Composer Studio installed and licensed
The user is reasonably familiar with elementary capacitive touch principles
Required Tools
The following tools are required to complete this workshop:
CapTIvate Design Center PC GUI Tool
The CapTIvate Design Center is a PC GUI tool for configuring and tuning CapTIvate touch panels. An installer can be downloaded from the CapTIvate Design Center home page
Java run-time engine (JRE) version 1.7 or later is required.
TI Code Composer Studio v6.10 or greater with MSP430 support
Code Composer Studio can be downloaded from the Code Composer Studio home page
CAPTIVATE-FR26xx Target MCU and CAPTIVATE-PGMR PCBs
The CAPTIVATE-FR26xx requires the CAPTIVATE-PGMR for programming/debug capabilities
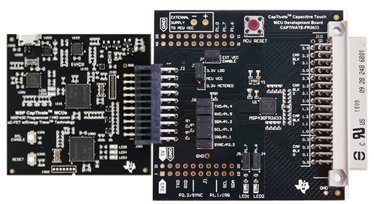
Fig. 402 Programmer and Target PCBs
CAPTIVATE-BSWP (Out-of-Box Experience Demo Panel):
The CAPTIVATE-BSWP is a capacitive touch evaluation panel that plugs into the EVM. It will be used to demonstrate a capacitive touch interface in this workshop. This panel demonstrates self-capacitance.
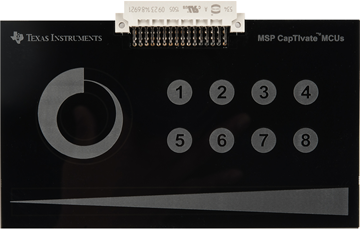
Fig. 403 BSWP Demo Panel
Additional information about these and other CapTIvate demo PCBs are available in Getting Started with Development Tools.
Hardware Setup
Please perform the following:
Connect the example sensor demonstration PCB to the CAPTIVATE-FR26xx MCU and CAPTIVATE-PGMR PCBs
Connect the micro-USB cable between the CAPTIVATE-PGMR programmer PCB and your computer
Verify the green LED (Power Good) is on and the green LED (USB Enumeration) is blinking.
Refer to the FAQ section for further troubleshooting tips.
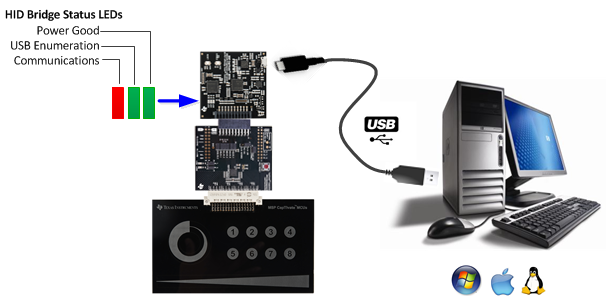
Fig. 404 Typical Setup
Important note about wake on proximity behavior
To understand how the wake on proximity mode affects the out of box experience, the behavior is illustrated below.
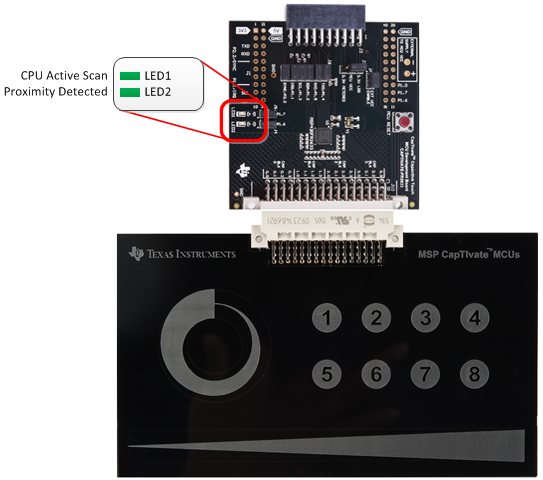
Fig. 405 Out of box status LEDs
Wake on proximity low power mode
The MCU board may appear to not be working during wake-on-proximity mode. There is no communications with the design center and both LEDs on the MCU board will be off. In this state the CPU is in low power mode 3 with the hardware state machine actively scanning only the proximity sensor at 10Hz until a proximity event is detected.
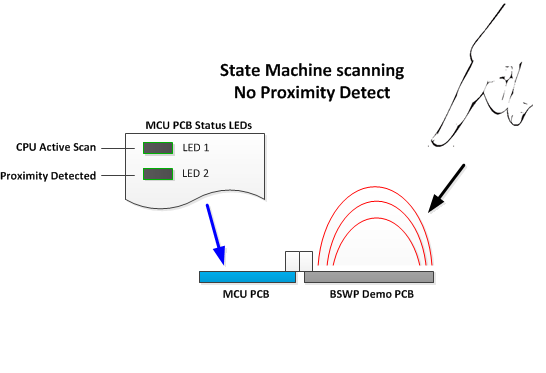
Fig. 406 Wake on proximity mode
CPU scanning in active mode
Bringing your hand near the board will introduce a proximity condition causing the CPU to exit low power mode and resume actively scanning all the panel sensors at 30Hz as long as your hand is near or touching the panel. LED1 will blink at the rate the CPU is scanning the sensors. LED2 will be on while the proximity detect is true.
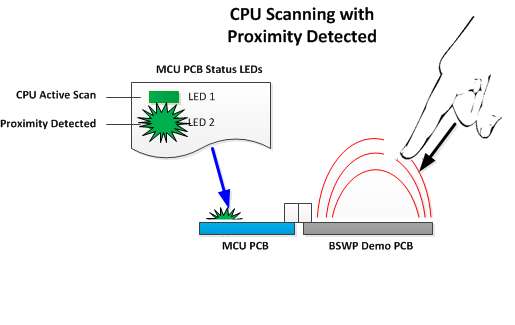
Fig. 407 Active mode
Entering wake on proximity low power mode
After removing your hand away from the board, LED2 led will turn off, however, LED1 will remain on, indicating the panel is still being scanned for a short period by the CPU. After one second the CPU enters low-power mode 3, LED1 turns off and the hardware state machine is now actively scanning only the proximity sensor.
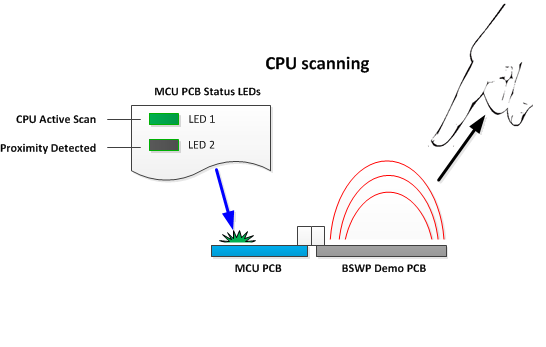
Fig. 408 Entering sleep mode
CAPTIVATE-BSWP Demonstration
Out of Box Experience
This demonstration uses the self capacitive BSWP (Button, Slider, Wheel and Proximity) Panel to explores the CapTIvate Design Center key features.
Design and sensor tuning views
Experiment with self capacitive button, slider, wheel and proximity
After completing this Out of Box Experience, continue with the workshop to learn more.
How to create and tune sensors for desired touch and feel
Low power sensor tuning considerations
Using the CapTIvate Touch Library
Note: The CAPTIVATE-FR26xx MCU PCB comes pre-programmed from the factory with the CAPTIVATE-BSWP “Out of Box Experience” demonstration firmware. However, if the CAPTIVATE-FR26xx PCB needs to be re-programmed, Reprogram Target MCU before continuing.
Starting the Demo
Follow the Demo Hardware Setup instructions above.
Start the CapTIvate Design Center using the icon that was installed on your desktop. Select “Project Open” and select the “CAPTIVATE-BSWP” project directory. Need help with CapTIvate Design Center?
The project’s main window is the design canvas and is pre-populated with the microcontroller and selected sensors matching the hardware for this demo.
Enable Communications in the CapTIvate Design Center to begin the demonstration. Note: The MCU is in “wake on proximity” mode and there may appear to be no activity. Bring your hand near or touch the board to activate the MCU.
The Design Center canvas displays the current state of the sensors on the touch panel. Touch the various sensors on the panel, and observe the response on the canvas. The Design Center draws circular button indicators for button groups, and shows a slider, wheel and proximity depiction for slider, wheel and proximity sensors.
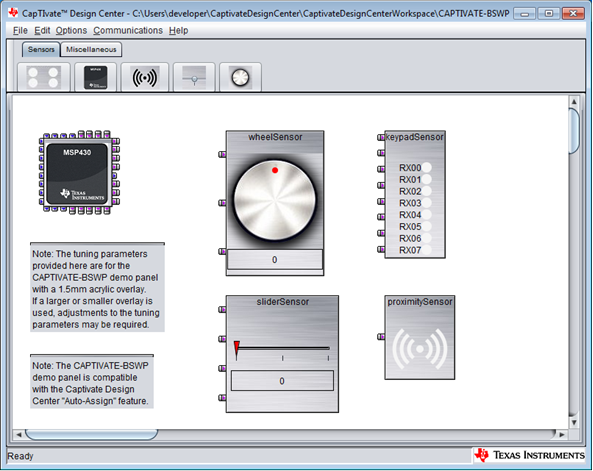
Fig. 409 Design Center Canvas
The first thing to note is that there are indicators that flash different colors depending on the state of the element that they represent.
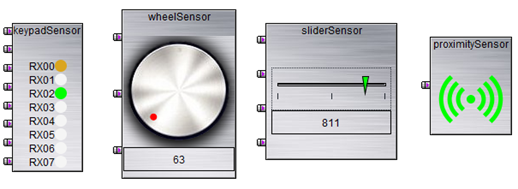
Fig. 410 Sensor color states
Red on a slider or wheel sensor indicates that the slider or wheel is NOT being touched, and the needle or circle shows the last valid position. Green on a slider or wheel sensor indicates that the slider or wheel is being touched, and the needle or circle indicator shows the position. WHITE on a button group indicator or proximity sensor implies that there is no touch or proximity detection on the respective element. Green indicates that the element is being touched. Amber indicates that the element is in proximity detection. GREEN will always supersede AMBER, because when an element is in a touch detect state it is usually also in a proximity detect state. To see both the proximity detection LED and the touch detection LED at the same time, along with the raw data, let’s open the controller customizer.
Double click on the MSP430 widget in the canvas view. The controller customizer window will open.
Fig. 411 MSP430 Widget
The controller customizer window offers MCU configuration control as well as real-time viewing of element data from the entire panel at once. These different features are located on the different tabs of the customizer. The default tab for the controller customizer is the Configure Connections tab. This tab specifies the sensor-to-port mapping.
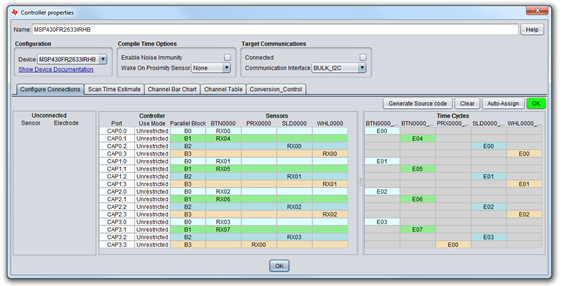
Fig. 412 Controller Customizer View
Open the Channel Bar Chart tab. The Channel Bar Chart tab displays channel data for every element in the system. Proximity and touch indicators (Amber and Green, respectively) are shown below the bar for each channel. The channel’s immediate count value is drawn as the blue bar in the plot for each channel. The green bar indicates the touch threshold, and the yellow bar indicates the proximity threshold. The LTA is drawn as a black bar, and usually appears hidden behind the count bar unless the element is being touched.
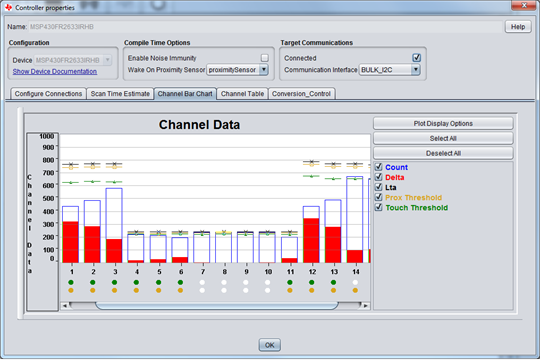
Fig. 413 Controller Customizer View
This concludes the out-of-box demonstration. Feel free to continue to look through the Design Center views to see what’s available.
Ready to start your first sensor design? Continue this workshop in the next section to learn how.
Creating a new sensor design project
LAB #1
In this section we go beyond the Out of Box Experience and will learn the following:
How to create new sensor project using the CapTIvate Design Center
How to generate CCS/IAR target code
How to tune sensors
Part 1 - Creating a New Design
Configuring the sensors is an important step. We want to take advantage of the target MCU’s parallel scanning capability, and to do this we need to make optimal connections between the available CapTIvate port pins and the electrodes in each sensor. Being able to scan electrodes in parallel can impact both the scan time and power consumption. In this section, we’ll use the CapTIvate Design Center’s auto-assignment feature to generate an optimal pin assignment for the CAPTIVATE-BSWP panel.
The BSWP (Button, Slider, Wheel and Proximity) panel features several different self-capacitance sensors: a button group, a wheel, a slider and a proximity sensor. The diagram below shows the pin assignments and sensor layout.
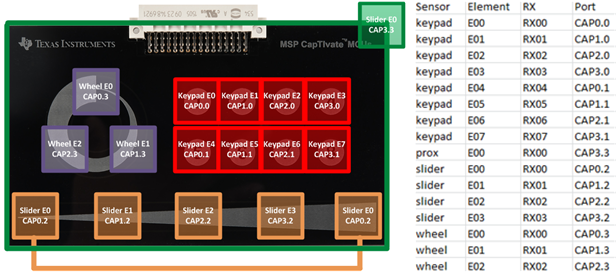
Fig. 414 Demo Panel Electrode Connections
Create a new CapTIvate Design Center project
Select File, Project New from the Design Center toolbar and provide “LAB1” for the project name. A blank workspace canvas should appear. If the Design Center asks if you would like to save any changes to the example BSWP project, select Discard, so that the example project can serve as a reference later.
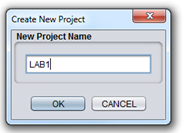
Fig. 415 New Project Name
Instantiate Beans - Adding an MSP CapTIvate Controller
Underneath the menu toolbar in the Design Center is the bean bar. The Design Center contains objects called beans that represent physical things in a capacitive touch system- a MCU, a button group, a slider, a wheel, etc.
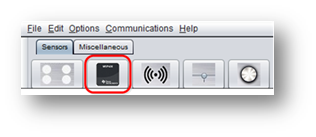
Fig. 416 Bean Objects Menu
All designs must have a controller. They may not have more than one controller (since we are designing a configuration for a single MCU). Let’s add a controller to the workspace canvas. Select the MSP Controller bean icon from the bean bar, and click on the canvas to place it. The canvas should now show a controller bean.
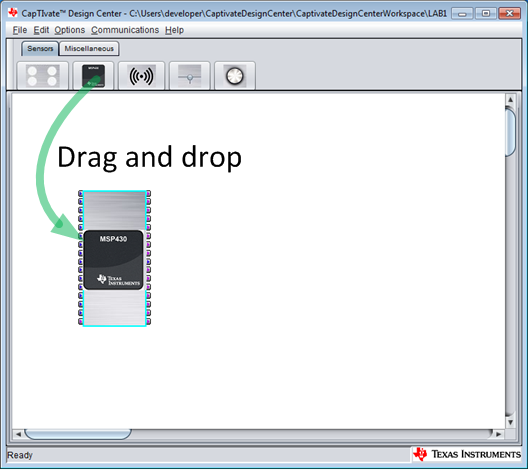
Fig. 417 Add MCU Bean
Double click the MSP bean to open the controller customizer. In the controller properties view, select the MSP430FR2633IRHB (32-pin QFN) or MSP430FR2676TPT (48-pin LQFP) device from the configuration device drop down.
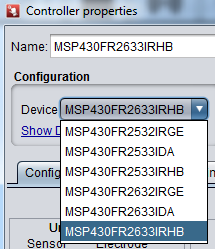
Fig. 418 Select Device Variant
We will also need to configure the communications interface for communicating with the target MCU. We’ll use I2C as it offers lower power consumption than the UART interface. In the controller customizer, select BULK_I2C from the communications interface pull-down.
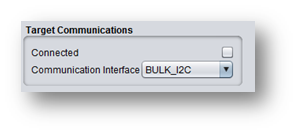
Fig. 419 Select Communications Mode
Close the controller customizer. The bean will now change to represent to correct device and package that will be used in this workshop.
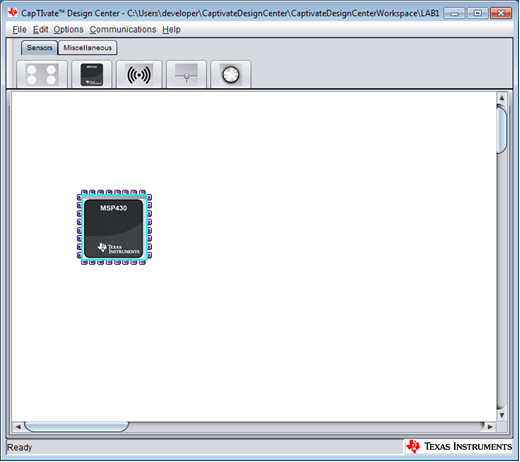
Fig. 420 MCU Bean Configured
Adding Sensors
Our panel has a button group (keypad with 8 buttons), a 4-element slider, a 3-element wheel and single element proximity sensor. Let’s add a bean for each one of those sensors now. Just like the controller, the respective beans for each one of these sensor types can be added by clicking the bean icon, and dropping the bean onto the canvas. Now that we’ve added these sensors, the canvas should look similar to the image below.
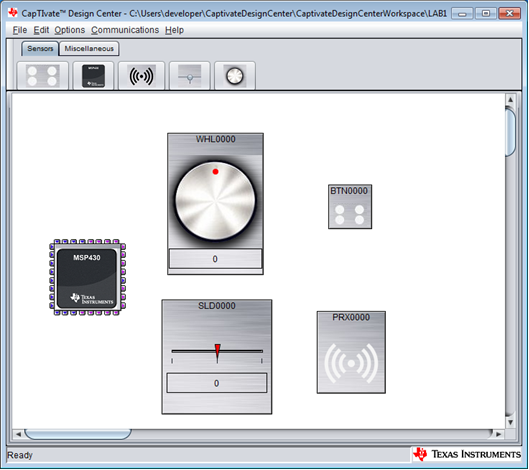
Fig. 421 Add Sensor Beans
Configuring Sensors
The canvas now contains all of the sensors in our system, plus the controller. Now we need to tell the Design Center more information about each of the sensors in our system. Let’s start with the button group. Double-click the button group that we added to the canvas to open its customizer window. The customizer has a Configuration section at the top of the customizer. Since our panel is self-capacitance only, we’ll want to specify SELF for the Capacitive Mode option. We have eight buttons that make up the keypad, so we will set the button count to 8. Notice that the Electrode Configuration drop-down will only show one option: 2 Cycles, 0 Tx Pin and 8 Rx Pin, since that is the only possibility for an eight-button, self-capacitance sensor. Your customizer should match the image shown here.
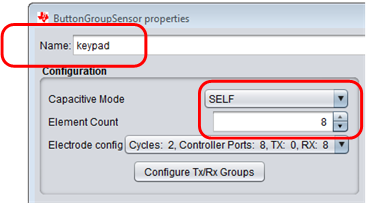
Fig. 422 Add Sensor Beans
Let’s also give the button group a creative name. The name is entered in the Name text box at the top of the customizer. If you remember back to the demo, it was named buttonGroupSensor. Here, it’s named BTN0000, a unique default name provided by the Design Center. Let’s name it keypad for this lab.
The same process is required for the slider, wheel and proximity sensors. Go ahead and setup the configuration for those sensors now to match the panel configuration (refer to the image at the beginning of this section for a reference). The Design Center assumes 3 elements for a wheel and 4 elements for a slider, which is exactly the configuration we have on this board. That means all we are really doing is naming the sensors and setting the capacitive sensing mode to SELF. Don’t forget to give these sensors new names as shown in the diagram below. When you’re finished, they should look like the following three images.
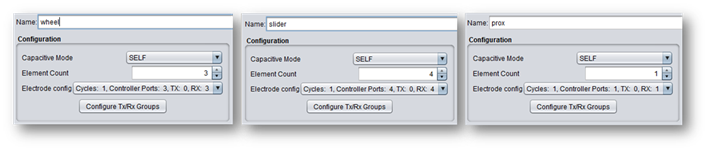
Fig. 423 Sensors Configured
The canvas view should now show small connection points on the left side of the four sensors: 8 for the keypad, 4 for the slider, 3 for the wheel and 1 for the proximity sensor. Each connection point indicates a CapTIvate port that is required for that sensor. Next, we’ll be mapping these connection points to actual ports on the MSP430FR26xx MCU that we selected to be the controller.
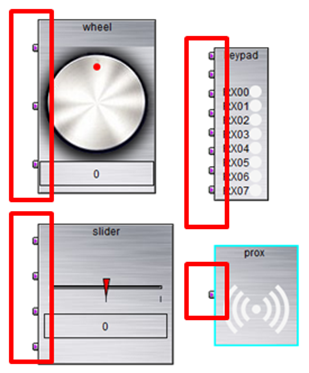
Fig. 424 Unassigned sensor electrodes
Auto Assign Sensor Connections
As we pointed out at the beginning of this section, we are going to let the Design Center automatically map sensors to ports. This is the recommended way to map ports because the Design Center uses an algorithm to determine the most optimal configuration. Port assignment is done in the controller customizer. Open the controller customizer. This is the first bean we added- the one that looks like a device. The customizer opens with the Configure Connections tab selected, as shown below. The sensors we added in the previous step are listed in the “Unconnected Sensor Electrode” box at the far left of the tab, indicating that nothing has been connected yet. Notice that the Generate Source Code button is grayed out and unavailable. This is because a valid port mapping is required to generate source code. The middle box on the Configure Connections tab has one row for each available CapTIvate port. The Use Mode column of the table has each pin to “Unrestricted” by default. This means that the Auto-Assign feature assumes it has access to all of the ports listed here. It’s possible to reserve a port (say, if you wanted to use it for a SPI interface) by changing the “Unrestricted” option to “Reserved.” The BSWP panel that we are designing now requires all 16 ports, so let’s leave all of the ports as “Unrestricted.”
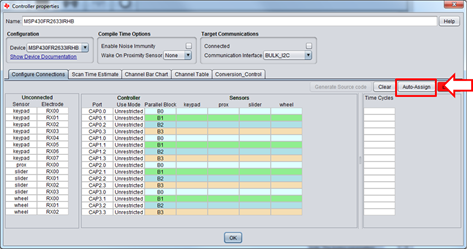
Fig. 425 Auto Assign Feature
When complete, you should see a configuration as shown below. Notice how the indicator is GREEN and shows OK, indicating all the sensors have been connected to controller port pins with no conflicts. Also notice that all 16 CapTIvate I/O pins have been used.
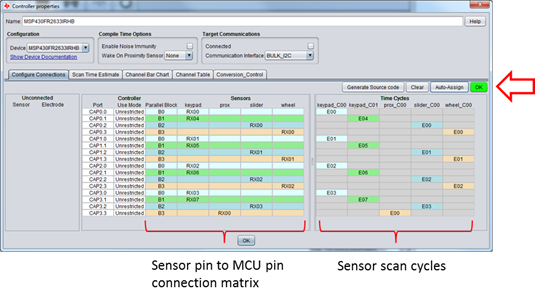
Fig. 426 Auto Assign Successful
Now that the port mapping is known, the time cycles are calculated. The 3rd and final box on the “Configure Connections” tab shows a breakdown of the time cycles. A time cycle is a group of elements that will be measured in parallel (at the same time as each other). Notice that the keypad sensor will be measured in two time cycles, and the proximity, slider, and wheel sensor each require one time cycle each. If the device only supported sequential measurements, this panel would take 16 cycles to measure each sensor! With this device we are doing it in just 5, reducing measurement time and power consumption.
NOTE: We were able to use the Auto-Assign feature here to map the ports for a board that already exists. This is because the Auto-Assign feature was used to generate the original port mapping for the CAPTIVATE-BSWP panel.
Before we move on, we want to save our current Design Center project. Select “Project Save As” and change the name of project folder to LAB1 as shown below.
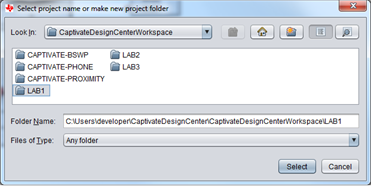
Fig. 427 Save CapTIvate Design Center Project
Generate Starter Project Target MCU Code
Now that we’ve created a sensor configuration for our sensors, the next step is to generate a starter code project. A starter code project is a fully functional Code Composer Studio and IAR firmware project for the MSP430FR26xx that we can use to program our target and begin the tuning process. Generate starter code project. In the controller customizer, under the Configure Connections tab, select the Generate Source Code button.
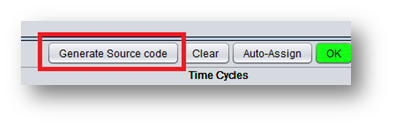
Fig. 428 Generate Starter Code Project
Save starter code project. A dialog box will ask whether we want to create a new project or update an existing project. Select “Create new project”, then click “OK” to accept the default location for our new starter project.
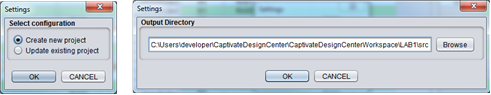
Fig. 429 Save Starter Code Project
The Design Center will create the starter code project under your Design Center Workspace directory. In the next step, you will import a copy of this project into your CCS workspace directory.
Build Lab#1 Starter Project Code
Import starter code project into CCS. Now that we’ve generated our LAB1 starter project source code, import the new project to your CCS workspace. If you need a CCS “refresher”, follow the steps in a later section CCS - Building and programming. After importing the project, click the debugger icon to build and download the code to the target.
Note: The very first time a CapTIvate source code project is built in CCS, the compiler may issue the following message if the small code/ small data run-time library needs to be built. Depending on your PC, this may take several minutes.
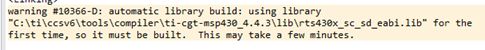
Fig. 430 Small memory run-time library build message
Since we won’t be using the debugger at this time, set the target running in “free run” mode or simply terminate the debug session. Press the reset button on the MCU PCB.
Note: After a POR or RESET, the MCU requires a second or two to calibrate the sensors before communication begins.
Now that we’ve programmed the target with our start project, let’s view the real time data and start tuning our sensors! Communicate with the Design Center. In the Design Center, close all of the customizer windows so that only the main canvas is visible, showing all of our sensors. Select Communications, Connect from the Design Center menu bar. The sensor data that is being streamed from the target will now appear in the main view of the BSWP demo board.
Part 2 - Tuning Sensors
At this point, we have not yet specified what kind of tuning we want for each sensor. Each sensor is operating off of the default values that were assigned by the design center. These default values are good starting points, but there is room for improvement. That is the goal of Part 2- to improve upon the defaults and dial in the values that are best for this application. Let’s look at the individual element data for the 16 channels in our system. Open the Controller customizer and select the Channel Bar Chart tab. All 16 channels will be showing their element data here. While touching the various sensors, the BLUE bars (absolute count measurement) will decrease since this is a self-capacitance panel. Solid RED bars indicate the delta between the long term average (LTA) and the current count. These will increase when an element is touched. Note the position of the default thresholds relative to the counts as you interact with the panel.
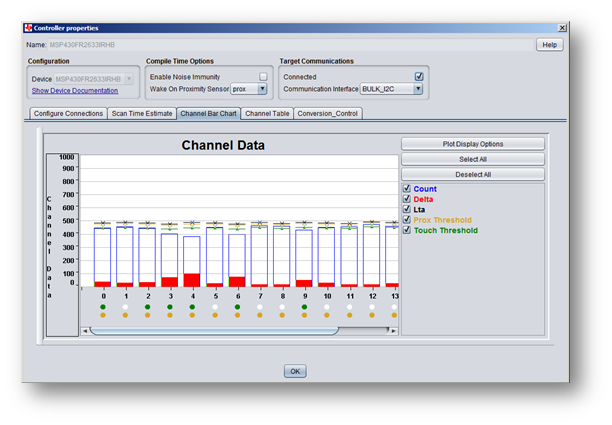
Fig. 431 Channel Bar View
The design center assigns default proximity and touch thresholds for all sensors. These values will have to be fine-tuned for each element, since each element has a slightly different sensitivity and parasitic capacitance. You can examine these defaults by opening the CAPT_UserConfig.c file in CCS. Search for “.ui8TouchThreshold” or “.ui16ProxThreshold.” Notice that proximity threshold is assigned to the sensor while touch thresholds are assigned to each individual element in the sensor.
Note: the proximity threshold value is an absolute deviation from the LTA (long term average) whereas the touch threshold value is dynamic, expressed as a percentage of the LTA. To learn more, double click on a sensor, click on the Tuning Tab, then on the Proximity Threshold or Touch Threshold Parameters to bring up the integrated help topics.
Tuning is done on a sensor-by-sensor basis. Each sensor has a customizer window that is opened by double-clicking the sensor bean on the canvas.
Tuning a Button Group Sensor
Let’s start with the button group sensor first.
TIP: To assist us in the sensor tuning process, any one of the sensor’s tabs can be “un-docked” allowing us to view the real time data in one tab while modifying a tuning parameter in another tab.
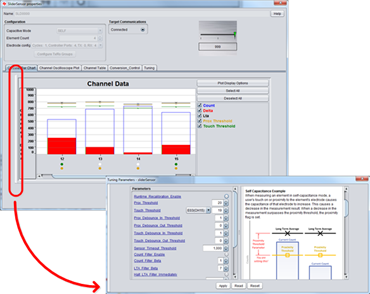
Fig. 432 Undocking Tabs
Conversion Count and Conversion Gain
Let’s experiment with Conversion Count and Conversion Gain. Close the controller customizer, and open the keypad sensor customizer by double clicking the keypad sensor on the canvas. In the customizer, we can see the same bar chart as we saw in the controller view, but here we only see 8 bars for the 8 elements in the keypad sensor. Touch button #1 on the panel while viewing the data in the Design Center. Notice that a touch produces around 75 counts of delta in the measurement - it goes from ~500 counts (also the default conversion count specification), down to ~425 when touched.
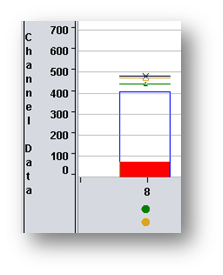
Fig. 433 Close up Button Bar
It’s nice to have 75 counts of delta, but do we really need that much information to determine a touch condition? The system is quite stable (only a few counts of noise), so the extra resolution isn’t really necessary, and it comes at the cost of scan time and power consumption, which we will investigate in a later lab. Let’s see if we can still get enough information out of the sensor to determine a touch condition if we bring the conversion count to 250, instead of the default 500.
Open the Conversion Control tab in the button sensor customizer.
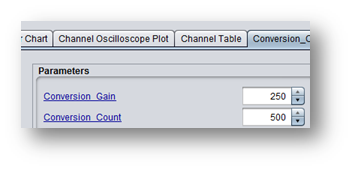
Fig. 434 Conversion Control
If you did not change any of the default settings, your conversion control window should look like the one above. The Design Center has selected a Conversion Count of 500, and a Conversion Gain of 250. We’ve shown that this provides the adequate information we need to determine a touch, but let’s dial the numbers back a bit. Let’s try 250 for Conversion Count and 100 for Conversion Gain. Note that Conversion Gain is the “base” value that the MCU will try to achieve without using parasitic capacitance offset subtraction. The overall Conversion Count is the count we are trying to achieve after we’ve added offset subtraction.
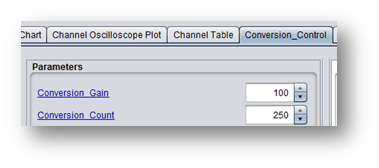
Fig. 435 Conversion Control
After a tuning parameter is adjusted in the Design Center, the Apply button lights up yellow, reminding you that you have parameter changes that need to be applied to the target microcontroller. Let’s press the Apply button now to submit the changes. Switching back to the Channel Bar Chart tab, the changes should be immediately visible. The baseline (no touch) measurement is now normalized at ~250 counts, and touching the button should decrease the counts to ~200, providing a delta of ~45-50 counts.
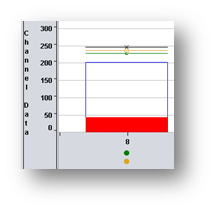
Fig. 436 Close up Button Bar
Proximity and Touch Thresholds
Now that we’ve got an appropriate measurement resolution, let’s adjust the proximity threshold and touch threshold to appropriate values that provide the desired feel for the button. While pressing button #1 on the panel, look at the bar graph you will see the green bar represents the location of the touch threshold and the amber bar represents the proximity threshold. Since our blue bar (current count) is past both the proximity threshold (amber) and the touch threshold (green), both the proximity and touch light is illuminated.
Since a full touch provides ~50 counts of delta, the default touch threshold makes the element a little too sensitive. We require a firm touch that is centered on the button. Let’s edit the touch threshold to require a firmer touch.
The touch threshold defines the size of the delta on a given element that is required for that element to enter a touch state. Touch thresholds are specified as a percentage of the long term average (LTA). Because of this, the actual absolute value is calculated dynamically at runtime. In the Design Center, they are entered in units of 1/128 the long term average (LTA). By specifying touch thresholds as a percentage of the LTA, the threshold is kept proportional to the LTA even as the LTA drifts. The default touch threshold value is 10. Since we specified a conversion count of 250, our effective touch threshold is now 250/128 * 10, or 19. Viewing the touch threshold in the Channel Table now shows the absolute threshold = 231, or 250-19.
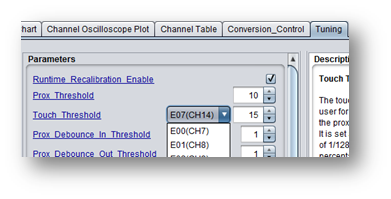
Fig. 437 Proximity and Touch Thresholds
Let’s increase the touch threshold to 15 for this system. A touch threshold of 15 would provide an effective touch threshold of 250/128 * 15, or 29. This will require a firmer touch for a touch to be declared. The touch threshold is set in the Tuning tab of the sensor customizer, just like the Conversion Count and Conversion Gain. Since the keypad is made up of 8 elements numbered from E00 to E07, button #1 corresponds to electrode E00 (CH8), so we want to modify the touch threshold for all 8 elements (E00 to E07). These changes improve the feel of the buttons.
If you’d like to understand more about how touch thresholds work, read the Description box in the Design Center when editing one. Feel free to adjust the proximity threshold. Note that there is only one proximity threshold. This threshold applies to the entire sensor.
Count Filtering
When looking at the bar graph, it’s easy to see that the count value drops 50 counts almost instantly when the button is touched. Let’s adjust the count filter to be more aggressive. In the Tuning tab, set the count filter beta value to 2 (the default is 1). This means that we will have a 25% weight for each new value, as opposed to a 50% weight- so the sensor should respond twice as slow. We might also see a little bit less noise on the system due to the increase in the filter.
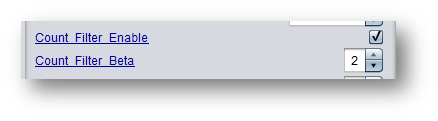
Fig. 438 Count Filters
Don’t forget to hit Apply after you’ve made the change. Now, looking at the bar graph, the system should show a slightly slower response. One neat way to look at filter responses is the Channel Oscilloscope Plot tab. This is an alternative view to the bar chart that shows history, and it’s a nice way to look at responses to filter changes.
You may notice that there is a count filter beta value as well as a LTA filter beta value. The LTA filter beta value effects how fast the long-term-average (LTA) tracks changes in the base count when no one is touching the panel (no threshold crossings). The default filter beta for the long term average filter is 7. The available options for both the count filter beta and LTA filter beta are 0 through 7. The filter doubles in strength with each increase. As we’ve seen, moving from 1 to 2 doubles the response of the filter to a step input.
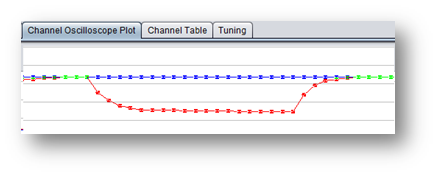
Fig. 439 Oscilloscope Tab
By this point, the button should have a decent initial tuning, and we’ve learned a little bit about filter responses.
Tuning a Wheel Sensor
Let’s take a look at another sensor type- the wheel sensor. Close the button sensor customizer, and open the wheel sensor customizer by double-clicking the wheel sensor bean on the canvas.
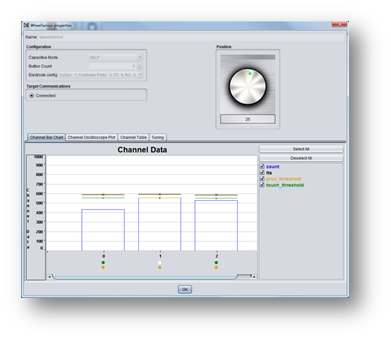
Fig. 440 Wheel Sensor View
Wheel Conversion Count and Conversion Gain
The wheel sensor also has a default Conversion Count of 500, with a Conversion Gain of 250. You should see about 100 counts of delta as you run your finger across the wheel. Unlike the buttons that we tuned previously, the wheel uses each element’s delta as an input to a position function to calculate where you are touching on the wheel. Thus, here it is beneficial to increase the conversion count to provide additional resolution. Let’s set the Conversion Count to 800 and the Conversion Gain to 125.
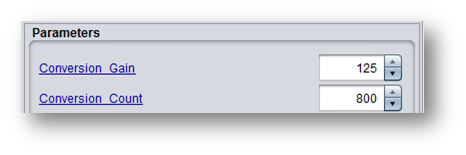
Fig. 441 Conversion Control
This should increase the maximum delta on each element by about a factor of 3. This increased resolution will greatly benefit the position calculation.
Wheel Resolution
The default wheel position resolution is 1000 points, providing 0 to 999 positions. Most applications won’t need this much resolution, so let’s reduce it to a more usable value of 100. Change the desired resolution tuning parameter to 100 from the default of 1000. After applying the change, notice how the response of the wheel is still just as linear as it was at 1000 counts, but now the data is actually much more usable, since it’s easy to dial in any specific number. The algorithm supports up to 16 bits of resolution.
Wheel Sensor Position Filtering
The other knob we to play with is the position filter coefficient. The sensor filter can be adjusted in 255 different steps. 255 would represent a unity response (no filtering), and 1 would represent the strongest filter. Let’s pick up the response time of the wheel even more by changing the wheel filter coefficient to 150 from the default of 100. The wheel response should be quite fast now, and there should still be enough filtering to provide a stable position report with little jitter. For fun, set the sensor filter to 25 and see how the wheel responds to over-filtering.
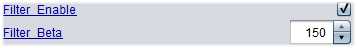
Fig. 442 Filter Control
Wheel Touch Thresholds
Since we increased the sensitivity significantly in the Conversion Count / Conversion Gain step, the wheel is going to be extremely sensitive to touch. Notice that if you hold a finger hovering over the wheel, the elements enter a touch state well before you actually touch on the panel. We’ll update the values here just as we did with the button group sensor. A setting of 27-28 is much better than the default value of 10. As always, remember to update the touch threshold for all 3 elements.
Tuning a Slider Sensor
Now that we’ve set up the wheel, let’s turn our attention to the slider.
Slider Conversion Count and Conversion Gain
The slider is just like the wheel when it comes to conversion count and conversion gain. Let’s set the Conversion Count to 800 and the Conversion Gain to 125 for the slider as well to increase the sensitivity and provide more resolution to the position algorithm. Double-click the slider sensor to open its customizer and click on the Conversion Control tab.

Fig. 443 Conversion Control
Slider Endpoint Trimming
The slider is very similar to the wheel- with the exception that it’s chopped and has two endpoints. All of the same principles apply, but there will be two new parameters: Slider Lower Trim, and Slider Upper Trim.
Select the Tuning tab in the customizer. The Upper Trim and Lower Trim parameters are the last two parameters in the parameter window so use the scroll bar to view them.
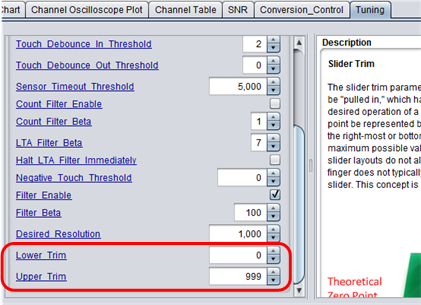
Fig. 444 Slider Trim
While moving your finger up and down the slider, you may notice that the slider values only seem to go from about 40 up to 960, even though we’ve stated we want a resolution of 1000 (0 to 999 positions) for this sensor. The reason we never get to 0 or 999 is because we’ve essentially taken a wheel and cut it in half- and the end points never get “pulled” by their opposite elements. To counteract this, there is a mechanism to stretch the slider by trimming the edges. Currently, the lower trim value is set to 0, and the upper trim value is set to 999. This means that there is no stretching being applied. We can apply stretching by providing trim values to the slider to re-align our zero point and max point. To set the slider trim values, place your finger on the left-most part of the slider, and look at the response. It will likely be somewhere above zero, but less than 100. We want that position to be defined as zero, so that the user can fully get to 0 when using the slider. Whatever measurement you get when touching the left-most part of the slider, enter that in the Lower Trim parameter box in the Tuning tab. Then, place your finger in the right-most part of the slider. You will likely see a value between 900 and 999 (since we are going out to 1000 points of resolution). Whatever measurement you see, place that in the Upper Trim parameter box. Then Apply the changes to the controller, and review the results. For this slider, the values below work well with the other settings that have been specified.
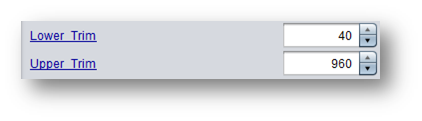
Fig. 445 Selecting Slider Trim Values
That’s it! Outside of the trim values, sliders behave exactly like wheels.
Slider Touch Thresholds
Since we increased the sensitivity significantly in the Conversion Count / Conversion Gain step, the slider is going to be extremely sensitive to touch. Notice that if you hold a finger hovering over the slider, the elements enter a touch state well before you actually touch on the panel. We’ll update the values here just as we did with the button group sensor and wheel sensor. A setting of 23-25 is much better than the default value of 10. As always, remember to update the touch threshold for all 4 elements in the slider.
Proximity Sensor Tuning
The proximity sensor has all of the same parameters as a button group, but there is only one element. Let’s set up the proximity sensor at see what kind of proximity distances we can achieve.
Proximity Conversion Count and Conversion Gain
The default Conversion Count of 500 and Conversion Gain of 250 do not provide very much sensitivity. With the default proximity threshold of 10, the sensor only yields about 1cm of detection distance. Let’s turn up the sensitivity by setting the Conversion Count to 800 and the Conversion Gain to 100.
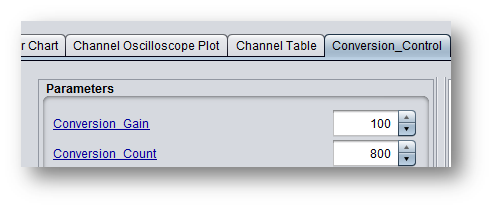
Fig. 446 Selecting Conversion Control Values
Notice the improvement in sensitivity! We are now able to get over 5cm of detection distance.
About Re-purposing the Touch Threshold
Since we are using the proximity threshold to know when someone is close to the panel, we could repurpose the touch threshold for another task. Since the proximity sensor layout on the CAPTIVATE-BSWP panel travels around the PCB, it could be used to detect if someone was leaning up against the panel, or putting their whole hand down on top of it. This kind of information could be used to block outputs of other keys. Imagine a security keypad application that is mounted on a wall. If someone leans up against it, it would be nice if we could detect that and prevent all of the other sensors from triggering at the same time. The touch threshold could be set to detect this kind of a scenario, while the proximity threshold is used to detect distance.
Miscellaneous Sensor Parameters
Let’s briefly re-visit a few generic sensor parameters that we have not yet addressed. The first is the sensor timeout threshold.
Sensor Timeout
The sensor timeout threshold provides a mechanism for averting a “stuck key” scenario. Imagine a touch panel on thermostat on a wall. Let’s say someone put a broom stick up against thermostat, and that showed up as a proximity detection. A proximity detection has the effect of halting our long-term-average. This means that the LTA is no longer going to track environmental drift. This affects the usability of the touch panel. The timeout feature allows for this to be averted by specifying, in samples, how long a sensor can be in detect (proximity or touch) before the interaction is declared invalid.
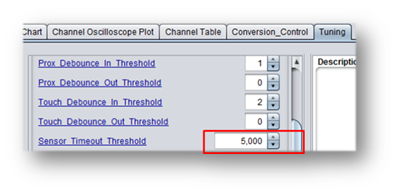
Fig. 447 Selecting Slider Timeout Value
Typically when users are using sensors, they touch them briefly- not for 30 seconds or more. By setting a lower sensor timeout threshold, we can have the system “reset” if for some reason it is stuck in detect for a long time. We can simulate this tool by setting the timeout extremely short- say, 200 samples. After 200 samples in detect (< 10sec), the system will reset the touch flags and reseed the long term average. Feel free to try this out.
Sensor De-Bounce
The touch library offers a built-in debounce mechanism for into and out of proximity and touch states. This is adjustable at a sensor level.
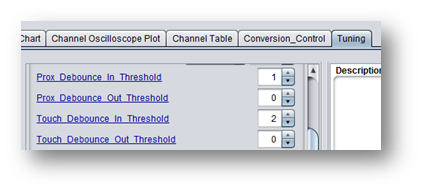
Fig. 448 Selecting Slider Debounce Values
Default settings for De-Bounce is 0 (no debounce applied). By applying debounce to the system, you offer a way to ensure that there was actually a valid touch (and not a brush of a hand or a noise event). However, debounce introduces latency into the system.
Try out setting longer and longer debounce settings and observing the effects on the sensor performance.
Scan Time Estimation
Based on the sensors we have configured for this project, a time profile or scan time estimation can be viewed showing the overall scan period, the time to scan each sensor and the combined time for all of the sensors. Note that the time to process the data and transmit the data to the Design Center is not accounted here, only the sensor measurement scan times. To view the scan time estimation, open the Controller Customizer and select the Scan Time Estimate tab.
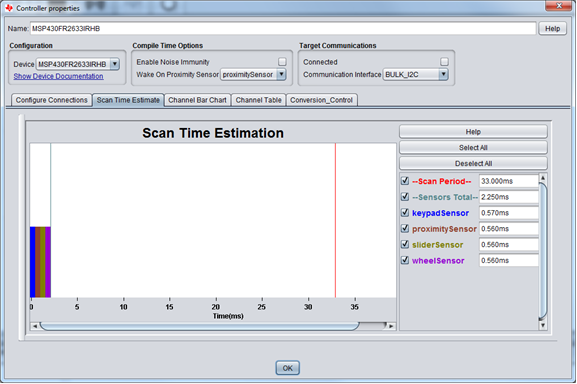
Fig. 449 Scan Time Estimation View
Part 3 - Generate Updated Sensor Configuration
Now that we’ve gone through and tuned our sensors, we want to apply those new tuning values to the source code. We don’t need to re-generate a whole new project to do that- we can simply update the CAPT_UserConfig.c and CAPT_UserConfig.h files, thanks to the Update Code feature in the Design Center. First, let’s save of an updated copy of the Design Center model (*.ser), so that we have a known good copy of our tuning in Design Center format. Then, open the Controller customizer, and press the Generate Source Code button again. The configuration we want is “Update existing project.”
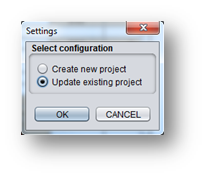
Fig. 450 Select Update
This time, we want to select the root directory of the CCS project we created, which is in our CCS Workspace, not our working folder where we first generated the starter project.
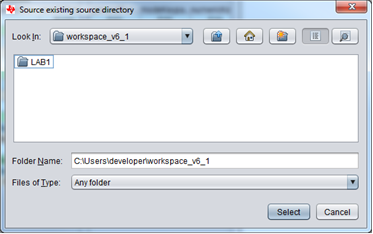
Fig. 451 CCS Project Directory
You can now re-build the CCS project and re-run it, and all of the new tuning values will have taken effect.
Congratulations! You have successfully completed your first CapTIvate sensor design. Next, let’s learn how easy the low-power “wake on proximity” feature is to use and measure the current for our sensor design.
Experiments with Low Power
LAB #2
This is Lab #2 and we will experiment with the “Wake on Proximity” feature which can achieve extremely low-power by using the CapTIvate hardware state machine to scan the proximity sensor while the CPU remains in low power mode 3. We will investigate how the sensor tuning and scan rates can directly impact the low power operation. We will be using the Energy Trace™ feature to measure the power during this lab.
Pre-requisite
We will continue to build on the work that was done in LAB1, so if you skipped that step, go back to Creating a new sensor design project.
Goals
Learn how to use EnergyTrace™ to make power measurements
See how tuning sensors effects low-power
Hardware Setup
Continue to use the same hardware setup that was used in the previous lab, LAB1. On the MCU PCB, move Jumper J3 between MCU_VCC and 3.3V METERED.
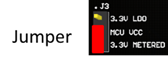
Fig. 452 Jumper to 3.3V Metered
Design Center Project
Before starting with this lab, we want to save our current CapTIvate Design Center project as LAB2. Select “Project Save As” and re-name the folder as “LAB2”.
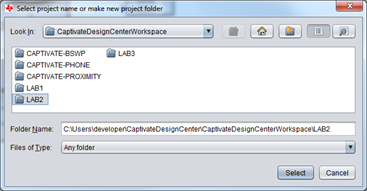
Fig. 453 Save as LAB2
Adding wake on touch functionality
The CapTIvate Design Center can enable certain compile time software features to be included in the project’s starter code. One of these features is the “wake on proximity”, also known as “wake on touch”, which enables the CPU to remain in a low power mode while the CapTIvate hardware state machine scans for a proximity condition. To understand how this behavior works, click here.
Select the Wake on Proximity sensor. The controller customizer Compile Time Options box lets you select a “Wake on Proximity Sensor” from a drop-down box populated with the sensors in the project. This selection chooses which sensor will be scanned during wake on proximity operation. For this lab select the prox sensor.
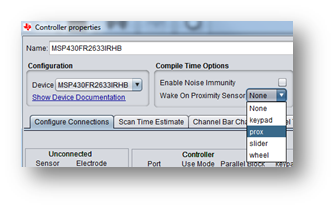
Fig. 454 Selecting Wake on Proximity Sensor
Modify wake on proximity parameters
In the controller’s “Conversion Control” tab, several parameters define the CPU and wake on proximity operations.
The “Wakeup Interval” specifies how often the CPU should wake automatically, regardless of proximity or touch event. This is a built-in safety mechanism for the wake on proximity state machine. For this lab, disable the Wakeup Interval. This will keep the wake on proximity state machine active indefinitely, providing ample time to take our low power measurements.
Generate LAB# 2 Starter Project Code
Generate starter code project. In the controller customizer, under the Configure Connections tab, select the Generate Source Code button. Select Create new project and use the default output directory.
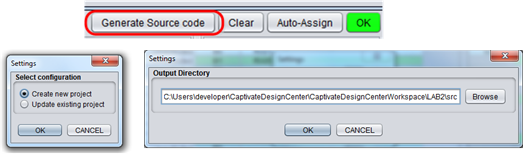
Fig. 455 Create/Save starter code project
Launching target MCU
Import starter code project to CCS. Now that we’ve generated our LAB2 source code, we need to import the new project to our CCS workspace. If you need a CCS “refresher”, follow the steps in a later section CCS - Building and programming.
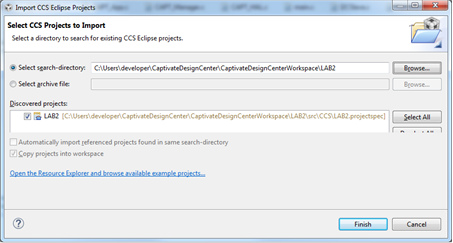
Fig. 456 Import Project
After importing the project, click the debugger icon to build and download the code to the target. Since we won’t be using the debugger at this time, set the target running in “free run” mode, Run>Free Run or terminate the debug session. Disabling the debugger disables the EEM module in the MCU, further reducing the current drawn by the MCU.
Using EnergyTrace™
EnergyTrace™ Technology is built into the eZFET programmer on the CAPTIVATE-PGMR PCB. It provides a DC/DC regulated output and monitors the amount of energy a load (target MCU) consumes. We will use the EnergyTrace™ to measure the power and currents in the target MSP430FR26xx.
IMPORTANT: Although EnergyTrace™ Technology can measure very small currents with reasonable accuracy and provide a simple tool for low-power demonstrations, it is HIGHLY RECOMMENDED that low-power measurements should be made using a bench supply, high accuracy meter and the target isolated from the eZFET programmer.
To enable energy trace, click the icon shown in the diagram below. If this icon does not appear on your menu bar, refer to the troubleshooting section at the end of this manual.
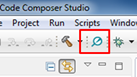
Fig. 457 Enable EnergyTrace™
A new view tab should appear in your CCS that looks something like the following:
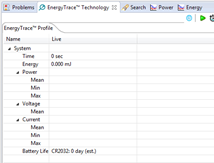
Fig. 458 EnergyTrace™ Tab
Set the EnergyTrace™ capture length for 30 seconds. This should provide adequate time to capture the traces for this lab.
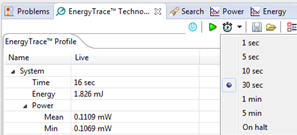
Fig. 459 EnergyTrace™ Capture
The target MCU is running in the “free run” mode without the debugger. To reset the target MCU, press the RESET button on the MCU PCB, then wait for LED2 to blink once. Start an EnergyTrace™ capture by clicking the green “play” arrow when ready.
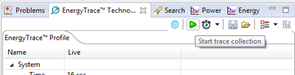
Fig. 460 Start EnergyTrace™
Part 1 - Measure Proximity Sensor Low Power current
First, let’s measure the wake on proximity average current to establish a baseline. Be sure to keep your hands clear of the PCB while performing this measurement. The EnergyTrace™ “mean” current measurement should < 10uA. This is the current required to measure the proximity sensor @ 10 times per second using the default conversion count of 800. If your measurement is much greater than 10uA, hit the RESET button, wait for LED2 to blink once then repeat the measurement. If the measurement is 0, make sure you have jumper J3 between MCU_VCC and 3.3V METERED on the MCU PCB. Record your measurement.
Part 2 - Effects of Sensor Sensitivity on Low Power current
Next we want to measure the effects a sensor’s tuning can have on the device’s current consumption. The BSWP demo board has a single element proximity sensor that runs the perimeter of the PCB. This proximity sensor is used by the “wake on proximity” state machine to detect when a hand is near the PCB. The proximity sensor is tuned just a like a button, but with greater sensitivity. In LAB1, the proximity conversion count was set to 800, providing sufficient resolution and proximity detection out to a couple of centimeters. Let’s see if we can increase the distance by increasing the resolution of the sensor.
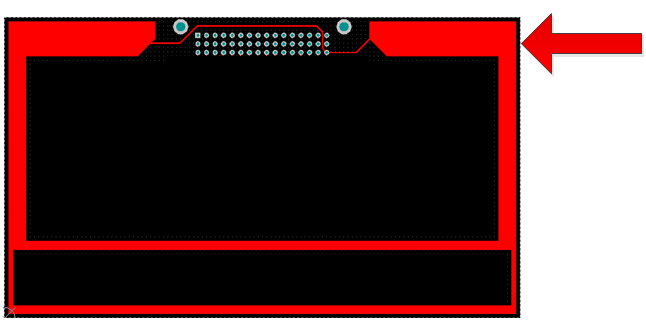
Fig. 461 BSWP Proximity Traces
Let’s start by increasing the conversion count to 1600. In the Design Center, double-click the proximity sensor to open its customizer, then click the Conversion Control tab. Update the conversion count to 1600, then click the Apply button. Click on the Channel Bar Chart to view the new conversion count data and confirm the LTA is near 1600. Verify as your hand approaches the PCB, the proximity detection now occurs sooner (further from the PCB). The proximity sensor is now more sensitive and able to detect proximity from a greater distance. If you are having trouble seeing the values at 1600, it may be necessary to adjust the plot range in order to see the channel bar data. Adjust the plot parameters to fit the new size of the channel bar using the Plot Display Options.
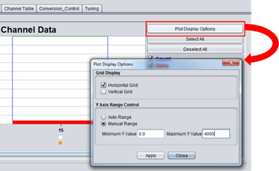
Fig. 462 Plot options
You may also notice with this higher resolution it may be more difficult to see the when the blue bar crosses the proximity thresholds. The design center has a “zoom” feature allowing an expanded view of the selected area.
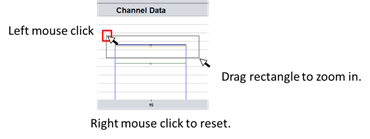
Fig. 463 Zoom in
Now that we have increased the sensitivity, let’s change the proximity threshold to prevent false detections. Select the Proximity sensor’s Tuning tab and modify the sensor’s Proximity Threshold and Negative Touch threshold to 30. Click on the Negative Touch parameter for additional information about this parameter in the Design Center description frame.
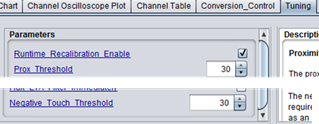
Fig. 464 Proximity Thresholds
With the increase in sensitivity, we have effectively increased our proximity range. Let’s see how this impacts our low-power current. DO NOT reset the MCU, as this will cause the conversion count reset to 800 and thresholds to reset to 15. Start EnergyTrace™ and examine the “mean” current. It should be about double from the previous baseline measurement. Record your measurement.
Part 3 - Effects of Sensor Scan Rate on Low Power current
The device’s low power current can also be affected by the rate at which a sensor is scanned. Let’s reset everything back to default by pressing the MCU reset button. To confirm the parameters were reset to their original programmed values, click the proximity sensor Conversion control tab, then the READ button. This reads the current values in the target MCU and you should see the conversion count = 800. In the Design Center, double-click the controller to open its customizer and select the Conversion Control tab. Modify the Wake On Proximity Mode Scan Rate to 50ms then click Apply. This effectively doubles the rate we scan the proximity sensor. 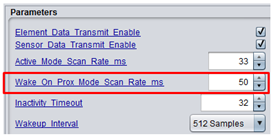
DO NOT reset the MCU, as this will reset the scan rate to 100. Start EnergyTrace™ and examine the “mean” current. Again, you should see the current more than double from the baseline measurement.
Summary
The demand for higher sensitivity, higher resolution sensing has a direct impact on the low-power current, as does the rate at which a sensor is scanned. So always consider the trade-offs when designing your sensors for the end application.
Congratulations! You have successfully experimented with the low-power “wake on proximity” feature and learned how sensor tuning and scan rate can directly impact your sensor design. Next, let’s learn about the CapTIvate capacitive touch software library. Continue with this workshop in the next section.
Exploring the CapTIvate Touch Library
LAB #3
Pre-requisite
We will continue to build on the work that was done in LAB2, so if you skipped that step, go back to Experiments with Low Power.
Goals
Learn how the sensor manager is used to simplify sensor measurements
Learn how to use callbacks to handle sensor events
Learn how to acquire proximity, touch and position status as part of callback
Hardware Setup
Continue to use the same hardware setup that was used in the previous lab, LAB2. On the MCU PCB, move Jumper J3 between MCU_VCC and 3.3V LDO and check the jumpers are in place for the two LEDS.
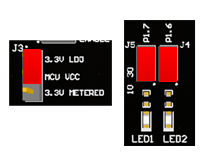
Fig. 465 Jumpers
Design Center Project
Before starting with this lab, we want to save our current CapTIvate Design Center project as LAB3. Select “Project Save As” and re-name the folder as “LAB3”.
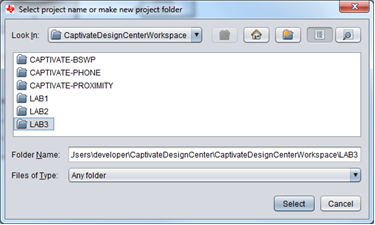
Fig. 466 Save as LAB2
Generate LAB# 3 Starter Code Project
Generate starter code project. In the controller customizer, under the Configure Connections tab, select the Generate Source Code button. Select Create new project and use the default output directory.
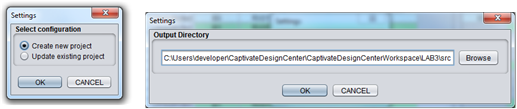
Fig. 467 Save as LAB3
Select the Design Center communication interface. Double click on the controller to bring up the customizer view. In the Target Communications Select the Connected communications checkbox and verify the Target Communications interface is set to BULK_I2C.
Import the starter code project into CCS as we did in previous labs. Build the LAB3 starter code project and program your target MCU.
Part 1 - CapTIvate Touch Library Overview
For this portion of the lab you are encouraged to follow along as we explore the CapTIvate capacitive touch library.
The software library is a comprehensive collection of functions or components for touch, communications and sensor management as represented by the software stack shown below. The primary “Touch” layers are Advanced, Touch (or “Base”) and Communications. Functions range from advanced sensor processing to “bare-metal” functions allowing direct access to the CapTIvate peripheral.
Communication functions for I2C and UART serial drivers and a communications protocol enable the MSP430FR26xx\25xx microcontroller to send sensor data to the CapTIvate Design Center during the sensor development process.
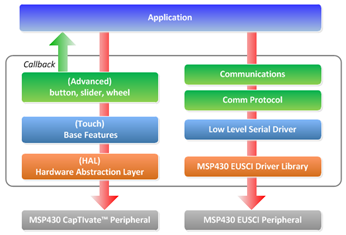
Fig. 468 Slider callback extra credit
The majority of library components are provided pre-compiled in the MSP430FR26xx ROM. They are also provided as captivate .lib or captivate.r43 file format for CCS and IAR respectively. No source code is provided for these components. These components are accessed using the CapTIvate API
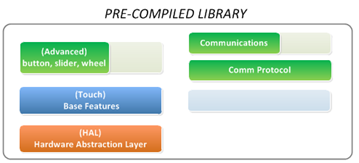
Fig. 469 Slider callback extra credit
Other components are provided as source code that can be modified to suit the needs of the application. The library manager is one example. The library manager “CAPT_Manager.c”provides three high-level functions to manage the primary sensor activities; CAPT_initUI(), CAPT_updateUI() and CAPT_calibrateUI(). This greatly simplifies the application’s interface with the library and can be used a framework for your application. The library manager is provided as source.
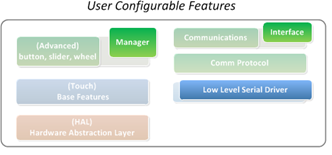
Fig. 470 Slider callback extra credit
Part 2 - Explore CCS project structure and details
During this part of the lab you are encouraged to explore the CCS project and library features on your own. Things to look at are:
CapTIvate Library are components located “captivate” directory
API header files for library
ROM header files
Pre-compiled library
Application level sensor manager
CapTIvate configuration files are located “captivate_config”directory
Configuration files generated by the Design Center
DO NOT hand edit these files as they get updated by the Design Center
CapTIvate application framework files are located “captivate_app”directory
Provides application level framework example for using the library
Board support files
Part 3 - Creating and using callbacks
The CapTIvate touch library uses callbacks to communicate with the user’s application. Callbacks provide a mechanism for the application to be notified when a sensor has been updated. The application must first register its “callback” function for each sensor before it can receive updates. Once an application’s callback function is registered, the callback is executed each time the corresponding sensor is scanned and processed, regardless if a proximity or touch detection has occurred. During the callback, the application can query the sensor’s data structure to determine the status of the sensor. The illustration below shows an example sequence where the keypad is scanned and processed, then the keypad callback is executed, followed by sensor data and status communicated to the CapTIvate Design Center. This sequence continues for the other sensors then repeats based on the programmed scan rate.
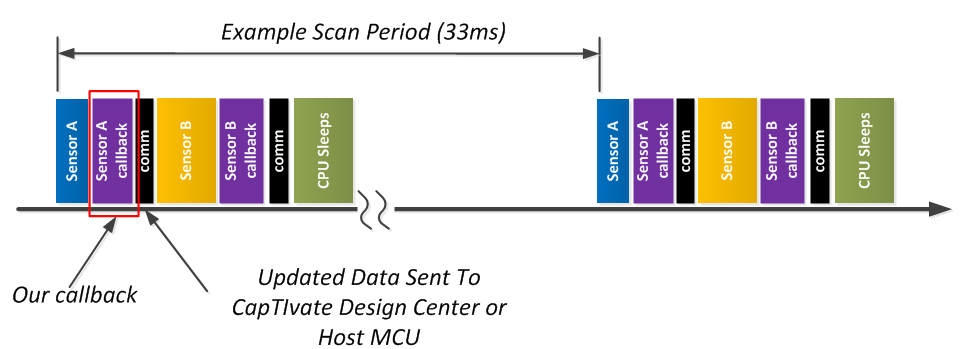
Fig. 471 Callback after sensor processing
For this lab we are going to create a callback function that will turn on LED1 when any keypad button is pressed. The library function CAPT_registerCallback() provides the callback registration.
Registering the application’s callback function named “my_keypad_callback” to a keypad sensor uses the following syntax:
MAP_CAPT_registerCallback(&keypad, &my_keypad_callback);
LAB3 Action:
In our LAB3 code project, insert the function call described above just before the function call CAPT_appStart(), around line 80, in main. This will allow our callback to be registered before the library starts.
Note: The names of the sensors created by the design center for our project are located in the CAPT_UserConfig.h file and shown here for convenience. You can see the first sensor in this list is our keypad sensor.
//
// Captivate Sensor Prototypes
// These prototypes enable access to sensors
// from the application.
//
extern tSensor keypadSensor;
extern tSensor proximitySensor;
extern tSensor sliderSensor;
extern tSensor wheelSensor;
Next, inside our callback, the application can perform any processing on the sensor data and status, such as checking for proximity, touch detection or slider/wheel position. Here is our example that checks when any button in the keypad is touched and released, toggling an LED accordingly.
LAB3 Action:
Add the following callback code snippet somewhere before main():
void keypadCallback(tSensor* pSensor)
{
    if((pSensor->bSensorTouch == true) && (pSensor->bSensorPrevTouch == false))
    {
        LED2_ON;
    }
    else if ((pSensor->bSensorTouch == false) && (pSensor->bSensorPrevTouch == true))
    {
        LED2_OFF;
    }
}
Then, in our callback we will turn on LED2 only when a “touch” is first detected, and turn off LED2 when a release is detected. This minimizes the time the CPU spends in the callback. We will need to make one additional change to the original code to get this to work. We need to comment out in main() the lines of code shown below. This will allow our callback to control LED2.
LAB3 Action:
Modify the section of main() as shown below:
    // Comment out the current block of code that
    // calls CAPT_appHandler and controls LED1 and LED2
//  LED1_ON;
//  if(CAPT_appHandler()==true)
//      LED2_ON;
//  else
//      LED2_OFF;
//  LED1_OFF;

    // Add standalone call to CAPT_appHandler
    // with no LED state modifications
    CAPT_appHandler();
Click the debugger icon to build and download the code to the target. Click the “play” icon to start the demo running. You should now see LED2 turn on when just the keypad buttons are touched.
Part 4 - Determining sensor state and position
Sliders and wheels are multi-element sensors, typically with 3 or more electrodes. Like buttons, sliders and wheels can have proximity and touch states, but they also have a position. Position is determined from the individual element measurements. The CapTIvate software library’s algorithm determines the sensors position (place where finger is touching) based on the measurements from all the sensor’s elements and provides the result in the sensor’s structure.
In this section we are going to create a callback function for the slider that will turn on LED1 when the slider’s position is greater than 500 and turn off LED when the position is less than or equal to 500. We chose 500 because from LAB1 the slider’s resolution was set to 1000, which provides points from 0 to 999.
Registering the application’s callback function named “my_slider_callback” to a slider sensor uses the following syntax:
MAP_CAPT_registerCallback(&slider, &my_slider_callback);
LAB3 Action:
In the LAB3 code project, insert this function call described above just before the function call CAPT_appStart() in main().
Below is an example callback that reads the sensor’s data structure and turns LED1 on or off depending on the value of the slider position.
LAB3 Action:
Add the following callback code snippet before the function main():
void sliderCallback(tSensor* pSensor)
{
    tSliderSensorParams* pSliderParams;

    if(pSensor->bSensorTouch == true)
    {
        pSliderParams = (tSliderSensorParams*)(pSensor->pSensorParams);
        if(pSliderParams->SliderPosition.ui16Natural > 500)
        {
            LED1_ON;
        }
        else
        {
            LED1_OFF;
        }
    }
}
Click the debugger icon to build and download the code to the target. Click the “play” icon to start the demo running.
While viewing the slider in the design center, LED1 will turn on when your finger is greater than 500 and turn off below 500. What happens when you release your finger from the slider when greater than 500? LED1 remains on. That’s because our code only changes the state of the led when the slider is being pressed.
What modifications to this callback will turn off LED1 if the slider is not being touched?
Here is one answer below. Try it to see if it works:
void sliderCallback(tSensor* pSensor)
{
    tSliderSensorParams* pSliderParams;

    if(pSensor->bSensorTouch == true)
    {
        pSliderParams = (tSliderSensorParams*)(pSensor->pSensorParams);
        if(pSliderParams->SliderPosition.ui16Natural > 500)
        {
            LED1_ON;
        }
        else
        {
            LED1_OFF;
        }
    }
    else
    {
        LED1_OFF;
    }

}
Congratulations! This is the end of the CapTIvate workshop. Visit the Introduction section to learn more about CapTIvate