7.6.脚本
Debug Server Scripting (DSS) 是 Debug Server 的一组跨平台 Java API,允许通过 Java 或第三方工具(如 JavaScript(通过 Rhino)、Java、Python(通过 Jython)、TCL(通过 Jacl/Tclblend)等)进行脚本编写。JavaScript 是 DSS 支持的默认(也是优选)脚本语言。
Debug Server 是 Code Composer Studio (CCS) 的基本调试引擎,可通过 DSS 和 CCS IDE 来访问它。
下面的培训视频非常全面地介绍了 DSS 的基础知识和操作步骤。
7.6.1.环境设置和运行 JavaScript
必须先适度地配置主机环境,然后 DSS 才可运行。这涉及到设置系统路径、类路径、其他环境变量等。启动 Rhino JavaScript 引擎时,必须传递各种参数。为了简化所有这些操作,DSS 提供了批处理/shell 脚本,它设置了必要的环境,并使用必要的参数来调用 Rhino Javascript 引擎,包含要运行的 JavaScript。此文件存储在 [INSTALL DIR]\ccs\ccs_base\scripting\bin 中。在 Windows 上,这个文件是 dss.bat,在 Linux/Mac 上,这个文件是 dss.sh,第一个参数是要运行的 JavaScript,后续可选参数传递给 JavaScript。
示例:
> dss myscript.js scriptParam1 scriptParam2
上述示例在系统路径中包括批处理/shell 脚本的路径,所以可从任何地方调用 dss 脚本。
7.6.2.调试 JavaScript
Rhino Debugger 是一个 GUI,允许调试在 Rhino 中运行的解释性 JavaScript 脚本。它与 DSS 附带的 Rhino 安装程序捆绑在一起。您可以单步执行 JavaScript,查看变量的内容,设置断点等。
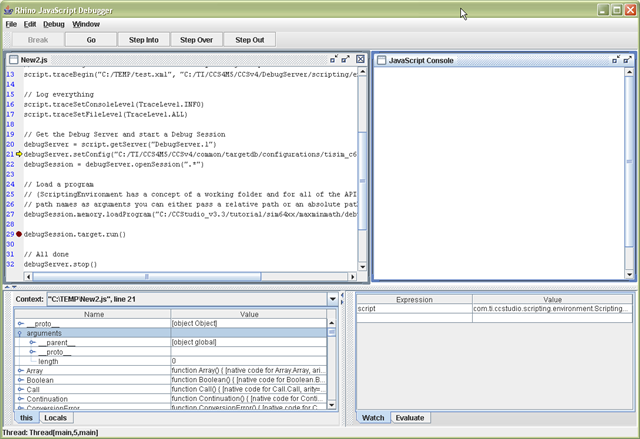
7.6.2.1.启动 Rhino 调试器
要将 Rhino 调试器与 DSS 脚本配合使用,请在通过 dss.bat/sh 调用 dss 脚本时传入 -dss.debug 参数
> dss.bat -dss.debug myScript.js
请
在传统版本(5.3 之前)中,需要更改实际 dss.bat / dss.sh 脚本才能调用 Rhino 调试器。现在已不再需要进行更改。
7.6.2.2.CCS GUI 可见性
有时候,仅仅使用 Rhino 调试器来调试自动化错误是不够的,还需要根据目标调试可见性来正确诊断错误的原因。在这种情况下,可以将 CCS 附加到由 DSS 创建的正在运行的调试会话。
7.6.3.示例
DSS 附带几个示例。这些示例位于:
[INSTALL DIR\]\ccs\ccs_base\scripting\examples
这些示例旨在演示和强调 DSS 的某些功能。其中一些可用的示例是:
- DSS 基本示例 (DebugServerExamples) - 这些示例脚本执行基本的存储器和断点操作。
- DVT 基本示例 (DVTExamples) - 用于收集和导出函数性能评测数据的示例脚本。
- Loadti (loadti) – 通用命令行加载器,可在 TI 目标上加载/运行可执行的 .out 文件。
- 测试服务器 (TestServer) – 演示如何使用 DSS 来设置调试测试服务器,以及让远程客户端通过 TCP/IP 套接字连接来发送调试命令。
所提供的示例因 CCS 版本而异
强烈建议新用户打开 DSS 基本示例并逐步查看,以便了解 DSS 的工作方式。这些示例进行了良好的注释,除了突出显示一些可用的 DSS API 外,还可让用户了解创建脚本环境和启动指定目标的调试会话所需的基本步骤。示例脚本也很适合作为基准来创建自用脚本(引用脚本或只是复制它,然后将其作为模板使用)。
请
这些示例依赖于特定的目标。如果未安装支持那些目标的器件(例如,MSP430),则脚本将无法“按原样”运行。但是,如上所述,浏览脚本仍然非常有用。也可以修改脚本以支持用户选择的目标。
7.6.4.DSS API
可以在以下位置找到对完整 DSS API 文档的引用: [INSTALL DIR]\ccs\ccs_base\scripting\docs\GettingStarted.htm
7.6.5.Scripting Console
交互式脚本支持可通过 CCS Scripting Console 视图查看,使用示例也可在 Scripting Console 中找到。可从控制台调用 DSS API。可从 Scripting Console 运行完全独立的 DSS JavaScript 文件。
7.6.6.目标配置
在尝试启动调试会话之前,需要将目标配置文件指定给 DSS。这是通过将目标配置 (.ccxml) 文件传递到 setConfig() API 来完成的。可使用 CCS Target Setup 来创建新的目标配置文件。
7.6.7.异常处理
所有 DSS API 在遇到错误时会触发 Java 异常。可以在脚本内捕获和处理这些异常(例如,JavaScript try-catch-throw-finally)。
try { debugSession.memory.loadProgram(testProgFile); } catch (ex) { dssScriptEnv.traceWrite(testProgFile + " does not exist! Aborting script"); quit(); // call custom quit routine to do some cleanup to gracefully exit the script }7.6.8.使用 GEL
用户可以从 DSS 调用 GEL 函数。expression.evaluate() API 可用于调用任何 GEL 函数/表达式。
// Call GEL function debugSession.expression.evaluate("myGEL_call()");7.6.9.多核调试的多个调试会话
可以为多核目标上的每个 CPU 打开和控制调试会话。只需使用 openSession() API 并指定板名称和 CPU 名称,即可打开特定 CPU 的会话。
我们来看一个打开带有 6 个 C64x+ DSP 的 TCI6488 EVM 调试会话的例子。首先,我们要知道目标配置 ccxml 文件使用的确切的板名称和 CPU 名称。通过查看所用的 ccxml 文件,或在新的目标配置 GUI 工具中打开 ccxml 文件,可以找到这些名称。对于我们的示例,名称是:
- 板名称:TCI6488EVM_XDS510USB
- CPU 名称:C64PLUS_F1A、C64PLUS_F1B、C64PLUS_F1C、C64PLUS_F2A、C64PLUS_F2B、C64PLUS_F2C
知道名称之后,可以通过各种方式调用 openSession() API:
- 传递唯一名称。在系统配置中,每个可调试的对象 (CPU) 都有唯一的名称,其结构如下:boardname/CPUName
openSession("TCI6488EVM_XDS510USB/C64PLUS_F1A");- 输入电路板名称和 CPU 名称,以打开单个配置 CPU 的调试会话:
openSession("TCI6488EVM_XDS510USB", "C64PLUS_F1A");- 此方法还允许将通配符(“*”)传递给 sBoardName 和 sCPUName。通配符将与找到的第一个目标匹配。在这种情况下,通配符用于打开与名为“TCI6488EVM_XDS510USB”的电路板的第一个 CPU 的连接
openSession("TCI6488EVM_XDS510USB", "*");让我们看看使用第一个选项(传递唯一名称)时,真实 JavaScript 代码的外观:
...// Get the Debug Server and start a Debug Session debugServer = script.getServer("DebugServer.1"); // Configure target for a TCI6488 EVM with SD XDS510 USB emulator script.traceWrite("Configuring debug server for TCI6488 EVM..."); debugServer.setConfig("TCI6488EVM_SD510USB.ccxml"); script.traceWrite("Done!"); // Open a debug session for each TCI6488 CPU script.traceWrite("Opening a debug session for all TCI6488 cores..."); debugSessionF1A = debugServer.openSession("TCI6488EVM_XDS510USB/C64PLUS_F1A"); debugSessionF1B = debugServer.openSession("TCI6488EVM_XDS510USB/C64PLUS_F1B"); debugSessionF1C = debugServer.openSession("TCI6488EVM_XDS510USB/C64PLUS_F1C"); debugSessionF2A = debugServer.openSession("TCI6488EVM_XDS510USB/C64PLUS_F2A"); debugSessionF2B = debugServer.openSession("TCI6488EVM_XDS510USB/C64PLUS_F2B"); debugSessionF2C = debugServer.openSession("TCI6488EVM_XDS510USB/C64PLUS_F2C"); script.traceWrite("Done!"); // Connect to each TCI6488 CPU script.traceWrite("Connecting to all TCI6488 CPUs..."); debugSessionF1A.target.connect(); debugSessionF1B.target.connect(); debugSessionF1C.target.connect(); debugSessionF2A.target.connect(); debugSessionF2B.target.connect(); debugSessionF2C.target.connect(); script.traceWrite("Done!"); // Load a program for just the first TCI6488 CPU script.traceWrite("Loading program to first TCI6488 CPU..."); debugSessionF1A.memory.loadProgram("HelloTCI6488.out"); script.traceWrite("Done!"); // Load a program for just the second TCI6488 CPU script.traceWrite("Loading program to second TCI6488 CPU..."); debugSessionF1B.memory.loadProgram("HelloTCI6488.out"); script.traceWrite("Done!"); // Run the program for just the first TCI6488 CPU script.traceWrite("Executing program on first TCI6488 CPU..."); debugSessionF1A.target.run(); script.traceWrite("Execution complete!"); // Reload program for just the first TCI6488 CPU script.traceWrite("Loading program to first TCI6488 CPU..."); debugSessionF1A.memory.loadProgram("HelloTCI6488.out"); script.traceWrite("Done!"); // Run the program for the first and second TCI6488 CPU simultaneously script.traceWrite("Executing program on first and second TCI6488 CPU..."); var dsArray = new Array(); dsArray[0] = debugSessionF1A; dsArray[1] = debugSessionF1B; debugServer.simultaneous.run(dsArray); // Run CPUs 1 and 2 script.traceWrite("Done!"); ...7.6.10.日志记录
DSS 日志记录可使用 traceBegin() API 来启用。日志可以包含各种信息,例如每个日志条目的时间戳、序列 ID、时间增量和状态。可以使用 traceSetFileLevel() API 将日志记录的数量(条目)设置为所需的详细级别。在更高的详细级别,将会记录许多内部诊断和状态消息,这在尝试确定脚本失败的确切原因/位置时非常有用。但这可能会导致长时间自动化会话的日志文件非常大,所以我们建议仅在需要时才使用更高的详细级别设置。
生成的日志文件是 XML 格式。每个人的日志记录需求略有不同,通过生成标准化的 XML 日志文件,就能够轻松地使用 XSLT(XML 样式表转换)将 XML 转换为任何自定义格式(逗号分隔文本、HTML 等)。traceBegin() API 可接受第二个参数(第一个参数是日志文件名),以便指定在 Web 浏览器中打开 XML 文件时要引用的 XSLT 文件。DSS 的脚本示例文件夹中提供了示例 XSLT 文件 (DefaultStylesheet.xsl)。
文本编辑器中 DSS 日志的原始 XML 输出示例:
<?xml version="1.0" encoding="windows-1252" standalone="no"?> <?xml-stylesheet type="text/xsl" href="DefaultStylesheet.xsl"?> <log> <record> <date>2008-10-30T17:16:53</date> <millis>1225401413228</millis> <sequence>6</sequence> <logger>com.ti</logger> <level>FINER</level> <class>com.ti.ccstudio.scripting.environment.ScriptingEnvironment</class> <method>traceSetFileLevel</method> <thread>10</thread> <message>RETURN</message> </record> <record> <date>2008-10-30T17:16:53</date> <millis>1225401413238</millis> <sequence>7</sequence> <logger>com.ti</logger> <level>FINER</level> <class>com.ti.ccstudio.scripting.environment.ScriptingEnvironment</class> <method>getServer</method> <thread>10</thread> <message>ENTRY sServerName: DebugServer.1</message> </record> ...请注意第二行,它引用了 DefaultStylesheet.xsl:
<?xml-stylesheet type="text/xsl" href="DefaultStylesheet.xsl"?>在 Web 浏览器中打开相同的日志文件将会显示以下内容:
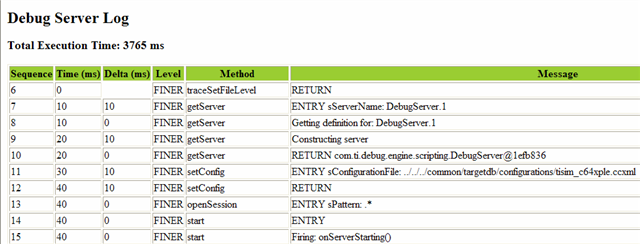
有关 XSLT 的更多信息(包括有关如何创建自己的 XSLT 的信息),请访问此 XSLT 教程网站。
7.6.11.性能评测
7.6.11.1.性能评测设置
若要设置性能评测,需要使用 profileSetup.getActivity() API 来为每个所需活动创建一个性能评测活动对象。必须将要进行性能评测的默认活动传递给 API。目前支持三种默认活动:
- “收集代码覆盖”和“独有评测数据”- 此活动会将性能评测工具配置为收集代码覆盖数据
- 分析 CPU 周期的所有函数 - 此活动会将性能评测工具配置为收集所有函数的 CPU 周期 (cycle.CPU)
- 分析总周期的所有函数 - 此活动会将性能评测工具配置为收集所有函数的总周期 (cycle.total)
请注意,可用的活动会因目标而异。特定目标支持的活动列表可以使用 profileSetup.printActivityList() API 来生成。
若要创建和启用性能评测活动对象以评测总周期的所有函数:
// retrieve an activity from the activity list based on the name myProfileActivity = debugSession.profileSetup.getActivity("Profile all Functions for Total Cycles"); // enable profiling for specified activity myProfileActivity.setStatus(true);创建活动对象后,可以对其进行进一步配置,以收集更多事件的数据,而不仅仅是默认事件。这可以通过从活动接口获取要进行性能评测的事件的属性对象,然后启用它来实现。以下示例可将 L1P 高速缓存未命中的集合添加到正在进行性能评测的事件中:
// get the propery object for L1P miss summary eventL1PMissSummary = myProfileActivity.getProperty("Events.L1P.miss.summary"); // enable collection L1P miss summary data eventL1PMissSummary.setBoolean(true);如果希望对多个事件进行性能评测,可以创建所需事件的数组,然后使用“for”循环来实现更清晰的实现:
// array of events to be profiled var evtNames = new Array("Events.L1D.hit.summary", "Events.L1D.miss.summary", "Events.L1D.miss.conflict", "Events.L1D.miss.non_conflict", "Events.L1P.miss.summary", "Events.CPU.stall.mem.L1D", "Events.CPU.stall.mem.L1P", "Events.L1P.hit" ); // retrieve an activity from the activity list based on the name myProfileActivity= debugSession.profileSetup.getActivity("Profile all Functions for Total Cycles"); // enable profiling of all events in the array for (evtCount=0;evtCount<evtNames.length;evtCount++) { event = myProfileActivity.getProperty(evtNames[evtCount]); event.setBoolean(true); } // enable profiling for specified activity myProfileActivity.setStatus(true);请注意,要评测的可用事件将因器件以及是否使用模拟或仿真而异。性能评测活动 listProperties() API 将生成当前器件支持的所有事件的完整列表。
7.6.11.2.导出性能评测数据
通过 DVT 完成已收集的性能评测数据的导出。DVT 的 API 文档和示例可以从以下位置找到: [INSTALL DIR]\ccs\ccs_base\scripting\docs\GettingStarted.htm
dvtServer = dssScriptEnv.getServer("DVTServer.1");然后,必须打开一个性能评测分析会话才能导出数据。传入调试会话和分析提供程序。对于分析提供程序,选项包括:
- FunctionProfile – 导出函数性能评测数据
- CoverageProfile – 导出代码覆盖数据
// create a profile analysis session for function level profiling data collected var profileAnalysisSession = dvtServer.openProfileAnalysisSession(debugSession, "FunctionProfile");在导出任何数据之前,我们需要确保完成对性能分析数据的所有处理:
profileAnalysisSession.waitUntilProfilingComplete();接下来,为收集的所有性能分析数据表创建一个 ProfileAnalysisExport 对象
var exports = profileAnalysisSession.exportData();然后,我们可以导出数据。我们可以选择导出部分或全部数据。下面的示例会使用 API 将第一个表的所有数据导出到 *.csv 文件中。
exports[0].save("myProfilingData.csv");当导出多个表(每个启用的事件都有一个表)时,可以使用“for”循环:
for (var e=0; e < exports.length; e++) { exports[e].save(profileResultsFolder + "\\" + exports[e].getName() + ".csv"); }完成后,请不要忘记终止性能评测会话并终止 DVT 服务器:
// close profile session profileAnalysisSession.terminate(); dvtServer.stop();7.6.12.项目管理
因为 DSS 用于为调试器(而不是工程管理器)编写脚本,所以 DSS 没有任何用于工程管理(工程创建、工程编译等)的 API。但是,CCS 附带的命令行实用程序可以创建、编译和导入可从脚本调用的 CCS 工程,高效地使此类操作实现自动化。有关这些命令的更多信息,请参阅使用命令行创建和构建项目一文。
7.6.13.断点
DSS 允许设置断点并修改其属性。
- 设置侵入式断点 - 停止目标
var bp1 = debugSession.breakpoint.add("0x100") // breakpoint with address var main = debugSession.symbol.getAddress("main") // Query for address of label "main" var bp1 = debugSession.breakpoint.add(main) // set breakpoint based on the address "main"- 设置非侵入式断点 – 对断点命中执行操作
可以通过创建断点属性对象来设置断点。断点属性通过“setString()”DSS API 设置。要获取属性名称和可能的值,请在 CCS IDE 上右键点击给定的断点并选择其属性。
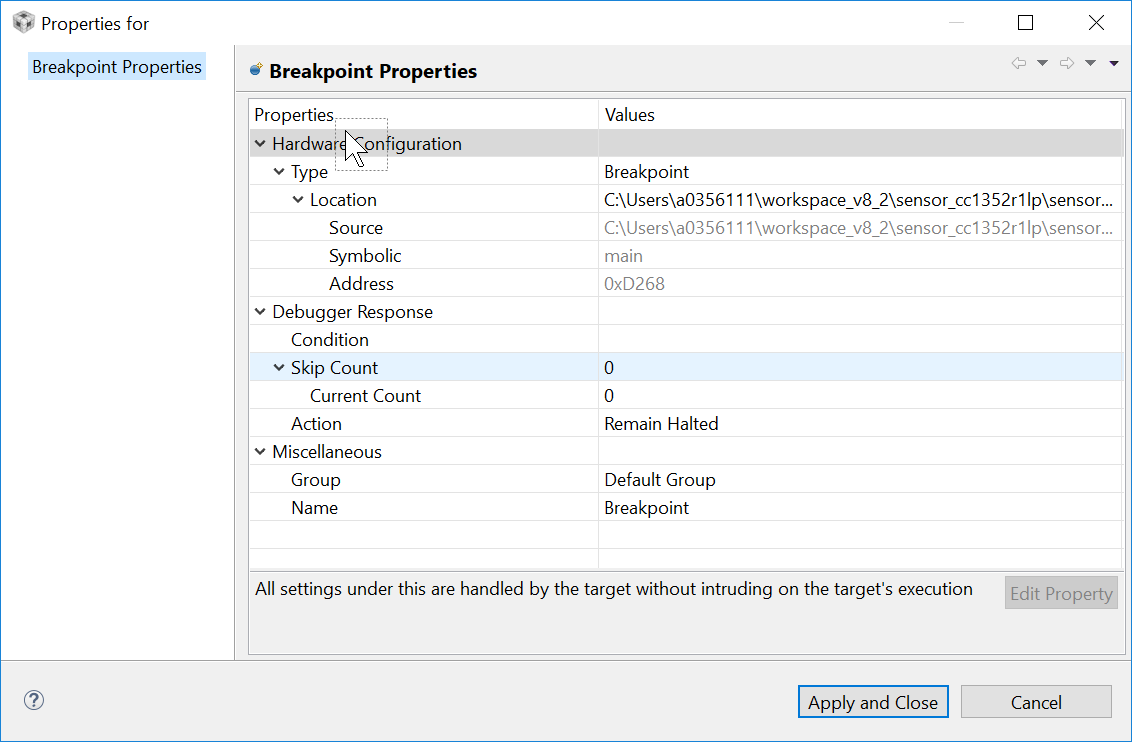
属性名称直接派生自与其层次结构一起显示的属性。
示例"Hardware Configuration.Location" "Debugger Response.Action.Expression" "Debugger Response.Skip Count" 注意:有些属性为只读,无法修改。例如:"Hardware Configuration.Location.symbolic" 和 "Debugger Response.Skip Count.Current Count"- 设置断点的示例脚本,该断点作为调试器操作执行 GEL 命令
// for setting breakpoint to perform gel command var bpProps2 = session.breakpoint.createProperties(1); bpProps2.setString("Miscellaneous.Name", "Breakpoint"); // Mandatory to select the breakpoint bpProps2.setString("Hardware Configuration.Location",0x500); // Breakpoing at PC address bpProps2.setString("Debugger Response.Action","Execute Expression(GEL)"); bpProps2.setString("Debugger Response.Action.Expression", "GEL_DriverString(\"SIM_EXCEPTION,ON\")"); // Set the gel command to be executed var bp2 = session.breakpoint.add(bpProps2); // add breakpoint- 设置断点的示例脚本,用于控制分析器的暂停和恢复评测集合的评测
// for setting breakpoint to perform profile control point var bpProps2 = session.breakpoint.createProperties(1); bpProps2.setString("Miscellaneous.Name", "Breakpoint"); bpProps2.setString("Hardware Configuration.Location",0x500); // Breakpoing at PC address bpProps2.setString("Debugger Response.Action","Control Profiling"); bpProps2.setString("Debugger Response.Action.Type", "Pause Profiling"); //Option for action type - "Pause Profiling","Resume Profiling"&"Terminate Profiling" var bp2 = session.breakpoint.add(bpProps2); // add breakpoint- 在程序退出时设置断点的示例脚本。方便添加 loadti 工具(在 main.js 中)
var bpExit = debugSession.breakpoint.add("C$$EXIT")7.6.14.将参数传递到脚本
将参数传递给脚本的方法会因所使用的脚本语言而异,所以最好查阅该语言版本的文档。
如果使用 JavaScript,则顶层脚本对象可以访问许多预定义的属性。其中一个属性被称为“arguments”。下面是打印出传递给 DSS 脚本的参数的示例:
for (var i = 0; i < arguments.length; i++) { print(arguments[i]); }7.6.15.调试器属性
可以通过 DSS API 获取和设置各种调试器选项 (Tools → Debugger Options)。
支持的部分选项是:
- 在程序加载/重新启动/复位后自动运行 main
- 启用实时模式
- …
使用以下 API 来打印 DSS 中支持的选项的完整列表:
options.printOptions(".*")这将生成支持的选项列表。单个条目如下所示:
Boolean Option: id: AllowInterruptsWhenHalted name: Generic.Realtime options.Enable silicon real-time mode (service critical interrupts when halted, allow debugger accesses while running) value: false- 第一行表示该选项是布尔选项。选项类型为数值、字符串或布尔值。
- 请注意,下拉菜单(以及单选按钮)被视为字符串类型
- 第二行是选项的 id
- 第三行是选项的说明
获取特定选项值的 API 包括:
long getNumeric(String id) String getString(String id) boolean getBoolean(String id)如上所述传递选项 id。根据选项类型,使用适用的 API(例如:使用适用于布尔值的 getBoolean() 选项)
用于设置特定选项值的 API 包括:
void setBoolean(String id, boolean value) void setNumeric(String id, long value) void setString(String id, String value)设置调试器属性以启用实时模式的示例:
...// Get Debug Server debugServer = script.getServer("DebugServer.1"); // Configure for F2812 target debugServer.setConfig("F2812.ccxml"); // Open a debug session debugSession = debugServer.openSession(".*"); // connect to the target debugSession.target.connect(); // Load a program debugSession.memory.loadProgram("modem.out"); // enable real-time mode debugSession.options.setBoolean("AllowInterruptsWhenHalted",true); ...7.6.16.其他支持的语言
底层 Debug Server Scripting 软件包作为一组 Java API 来实施。使用现成的软件包(其中许多是开源的),可以通过其他脚本语言访问这些 API。JavaScript(通过 Rhino)是首选语言,并将获得 DSS 官方支持。但也有许多第三方解决方案可用于将 Java 与 TCL (tclblend)、Python (Jython) 和 Perl (Inline::Java) 连接起来。
7.6.17.下载
DSS 与 CCS 捆绑在一起。无法获取一个独立的“仅 DSS”安装程序。