Design Center GUI
Introduction
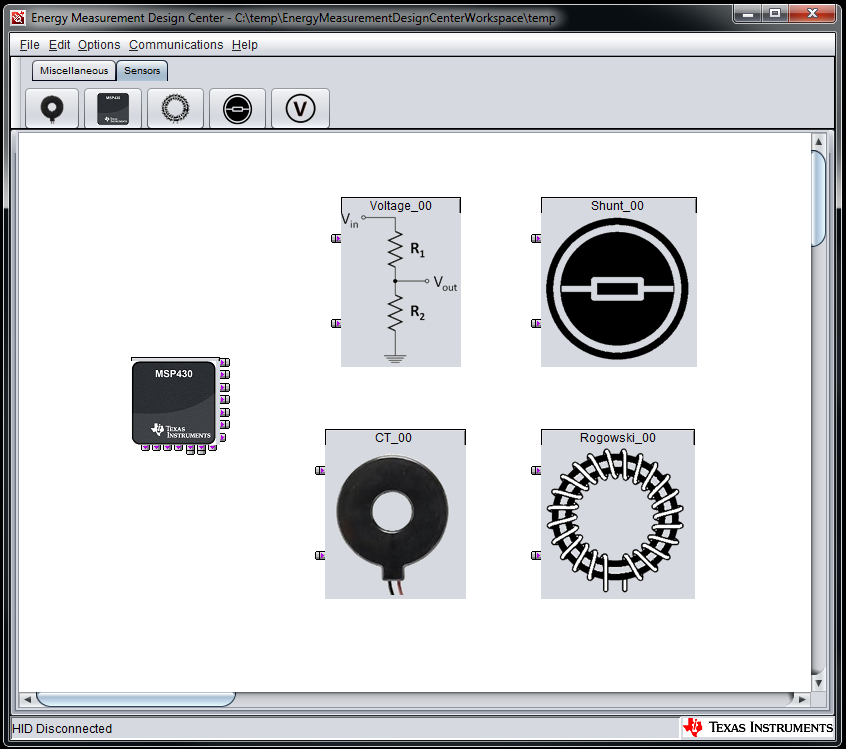
Fig. 1 Energy Measurement Design Center
The Energy Measurement Design Center (EMDC) is a rapid development tool that can simplify development and accelerate designs in a wide range of power monitoring and energy measurement applications, including smart grid and building automation. Using the Design Center you can configure, calibrate, and view results without writing a single line of code.
Set up a design in less than five minutes:
Drag and drop an MCU, voltage sensors, and current sensors into the GUI workspace
Configure each sensor and the MCU according to your system configuration
The GUI will check for errors before generating the source code
Import the code into an IDE and program the MCU
Easily calibrate the MCU using the GUI and view the results
Key Features
Intuitive GUI for connecting, configuring, and calibrating controller and sensors
Support for Shunt, Current Transformer (CT), and Rogowski Coil (RC) current sensors
Support for 1-phase, 2-phase, and 3-phase system configurations plus neutral monitoring
Support for voltage, current, power, energy, power factor, and frequency measurement
Estimated CPU bandwidth (library only) for supported system configurations
Automated generation of complete source code projects for supported IDEs
Real-time target communication through a USB HID communication bridge featuring:
Perform single-point calibration for gain and phase
View or log real-time results
Hardware and Software Requirements
The Energy Measurement Design Center can be used on a PC with the following minimum requirements:
Windows 7+ operating system with Java version 1.7+
Apple OS X 10.10.1+ with Java version 1.7+
Linux OS with Java version 1.7+
The source code projects generated by the GUI supports the following IDEs:
Texas Instruments Code Composer Studio (CCS) version 7.1.0 or later
IAR Systems Embedded Workbench for MSP430 version 7.10 or later
Additional Linux Requirements
If you are not running the application using a root account, you may not have permissions to the HID device mounted by the MSP microcontroller.
To enable access perform the one-time setup step:
Create the file /etc/udev/rules.d/ti_hid.rules.
Add the lines below to the file and save the file
## Allow open access to any usb device with the default Texas Instruments MSP
## Vendor Id of 0x2047
ATTRS{idVendor}=="2047", MODE="0666"
Licensing
The Energy Measurement Design Center is released under the BSD 3-clause license. See the license manifest in the installation directory for details.
Out-of-Box Experience
This section describes how to program the required tools, make the connections, and quickly view results using the provided EMDC example projects and example firmware images. These examples allow users to start measuring results without configuring the library or generating code through the Design Center GUI. For more detailed instructions about how to start a new EMDC project, please refer to the Quick Start Guide section.
Program the MSP-EXP430F5529LP (HID Bridge)
The MSP-EXP430F5529LP is used as the HID bridge, which is necessary for the target to communicate with EMDC running on the PC. This section describes how to program the LaunchPad with the provided HID bridge firmware image.
First, verify that all jumpers are populated on the LaunchPad.
Next, plug the LaunchPad into the PC using the provided micro USB cable. If the LaunchPad has never been connected to the host PC, then a message will pop up as shown below.
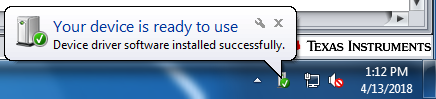
Fig. 2 Device Ready to Use
Open UniFlash.
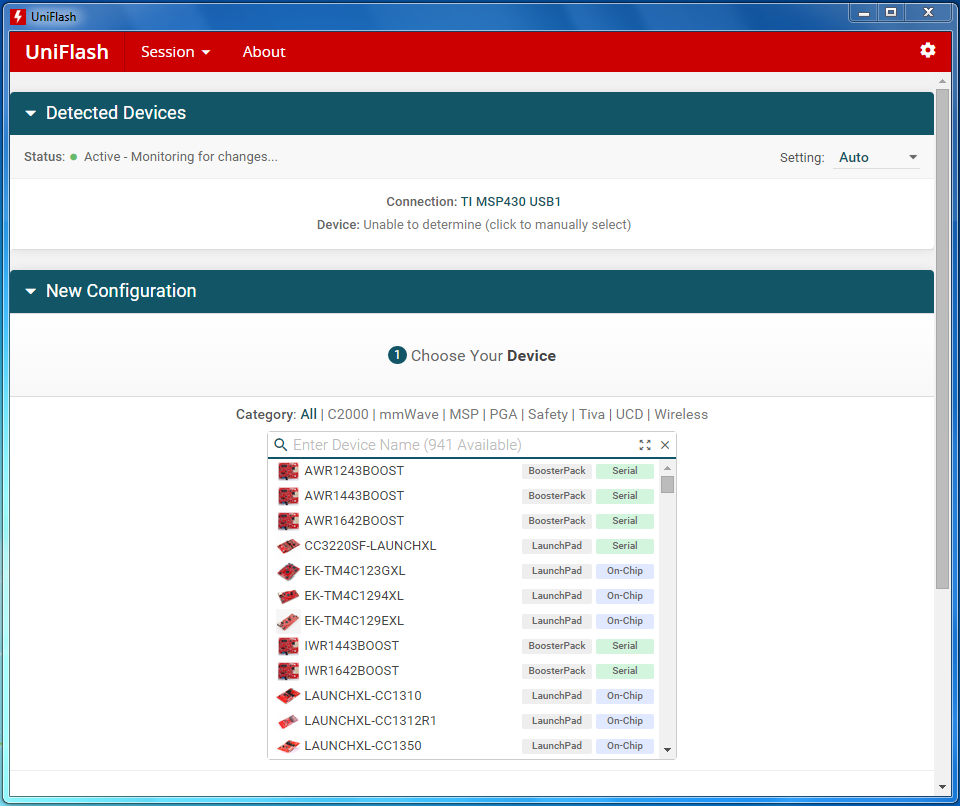
Fig. 3 UniFlash
Enter “MSP-EXP430F5529LP” in the search box under “New Configuration”.
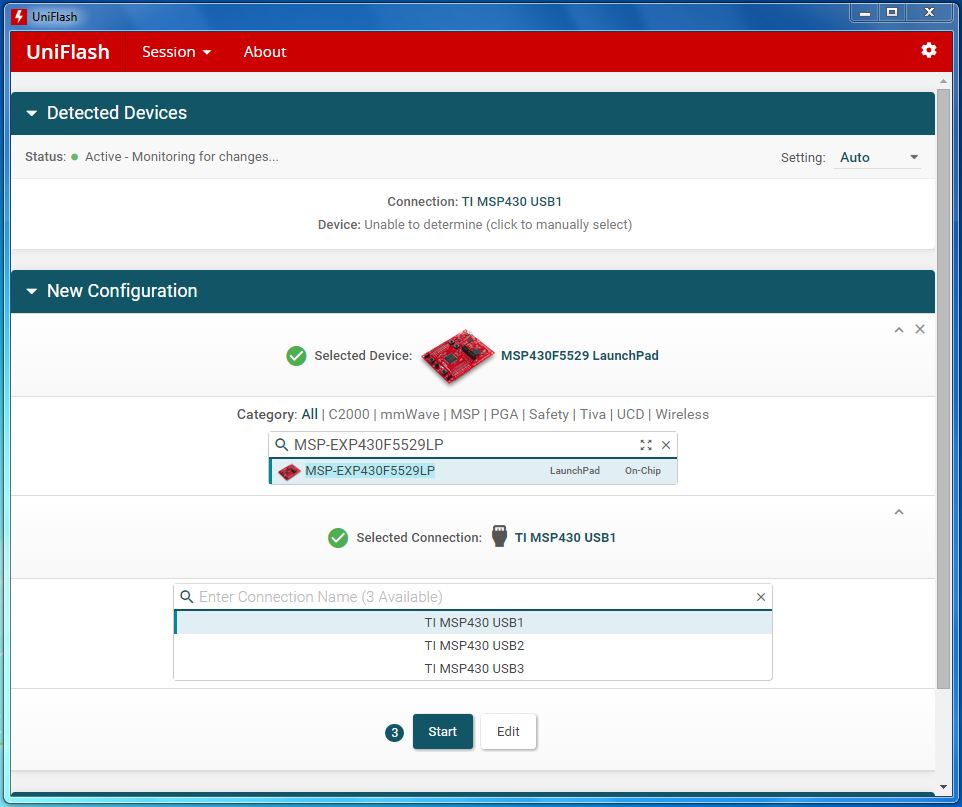
Fig. 4 MSP-EXP430F5529LP Selection
Select USB connection and click the “Start” button.
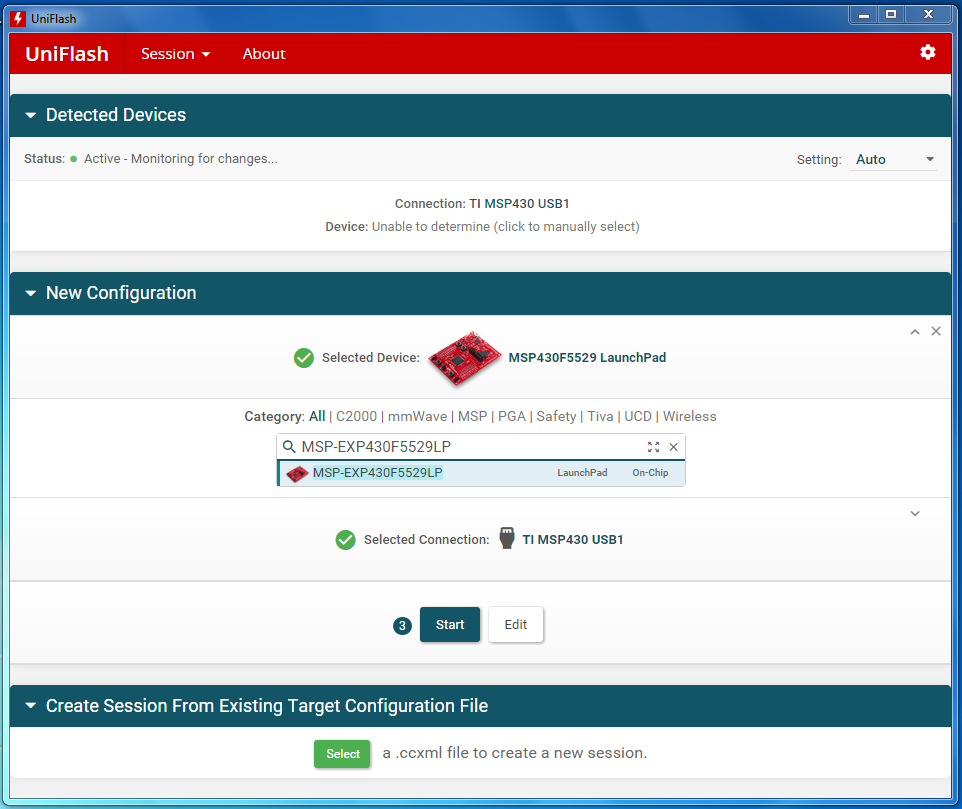
Fig. 5 USB Selection
Click “Browse” to select the HID Bridge firmware image. If the default installation location was used, the image can be found in the following location.
C:\ti\msp\EnergyMeasurementDesignCenter_<version>\EnergyMeasurementDesignCenter\hidbridge
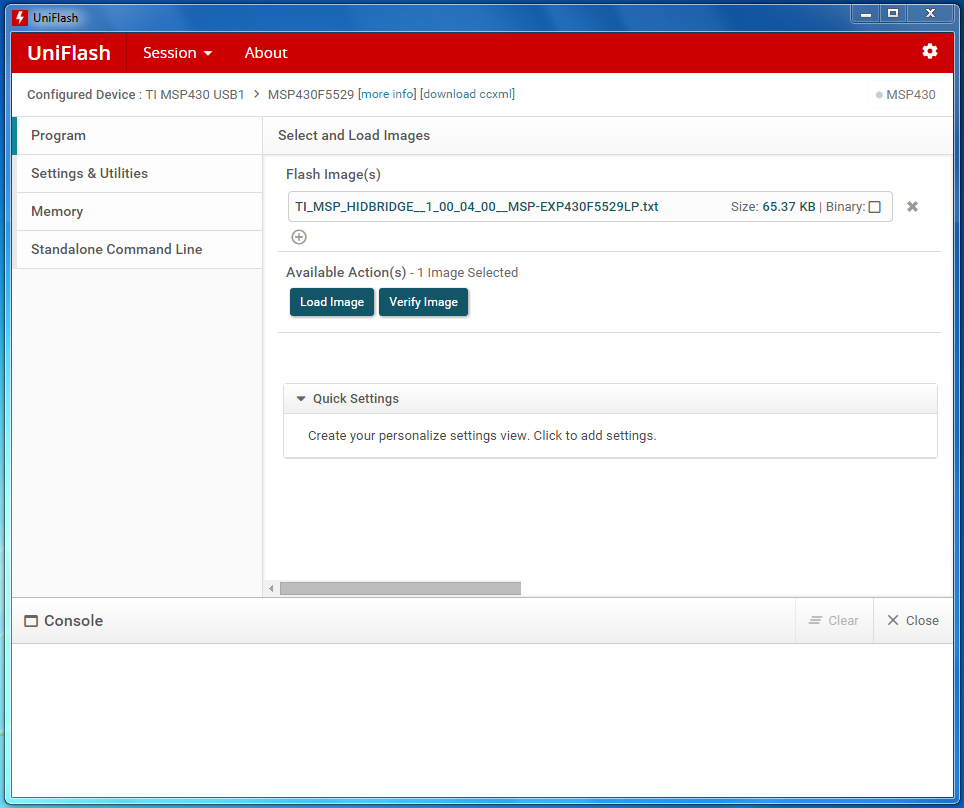
Fig. 6 Select HID Bridge Image
Open the TI_MSP_HIDBRIDGE__1_00_04_00__MSP-EXP430F5529LP.txt firmware image. Then, under “Available Actions”, click the “Load Image” button to program the LaunchPad.
Fig. 7 Download HID Bridge Firmware Image
If “Update Firmware” message appears, click “Update” and proceed.
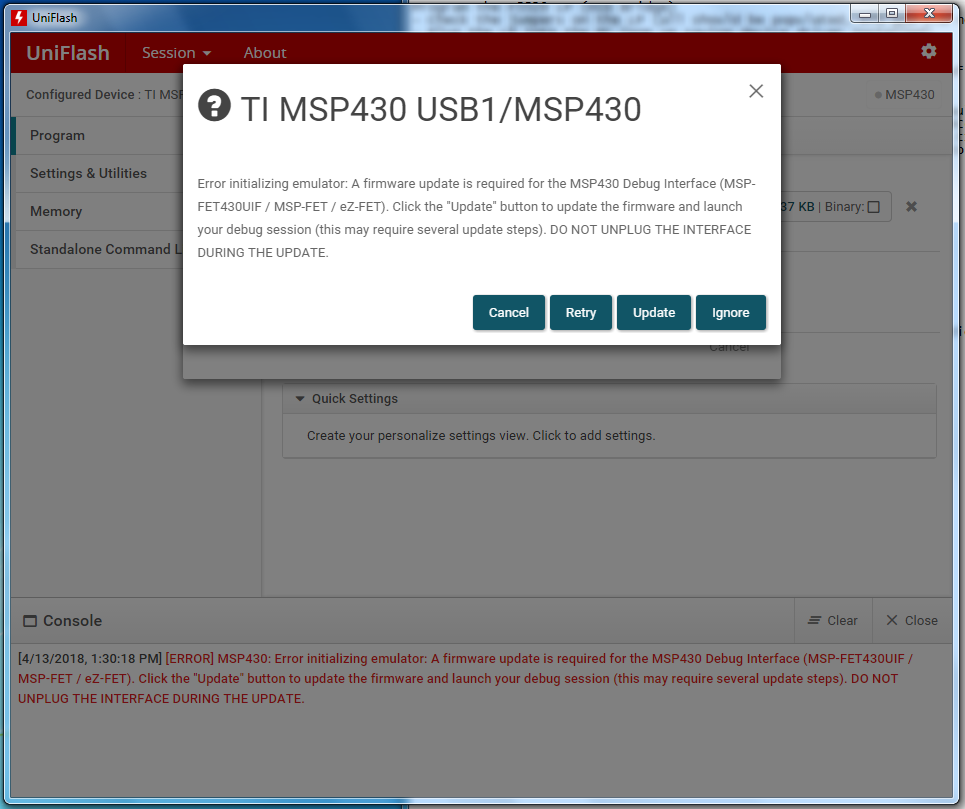
Fig. 8 Firmware Update
In the UniFlash “Console” window, “SUCCESS” should be shown when the program was loaded successfully.
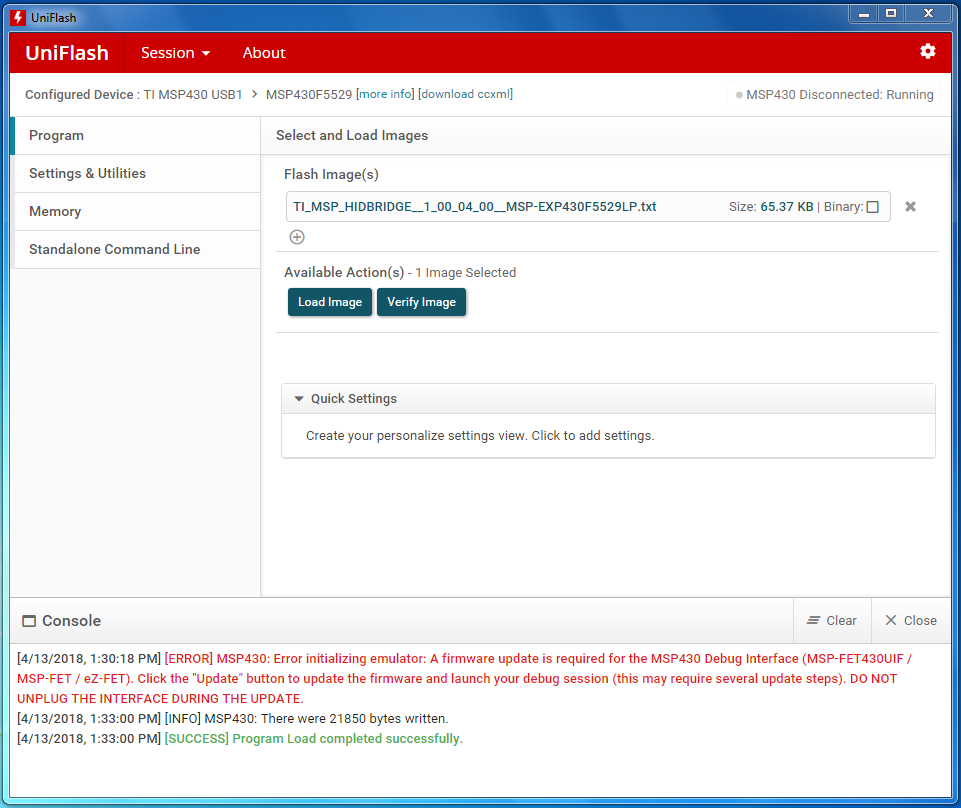
Fig. 9 Successful Image Load
The green LED2 on the LaunchPad should now be blicking slowly.
Unplug the LaunchPad from the PC, but don’t close UniFlash yet.
Program the EVM
This section describes how to program the supported EVM with a provided EMDC example firmware image, since the EVM may not have been programmed with the latest version.
First, plug the MSP-FET into the PC and then connect the 14-pin ribbon cable to the JTAG connector on the EVM. Please refer to the EVM’s User’s Guide for properly configuring the on-board jumpers, so the MSP-FET can power and program the EVM.
For the EVM430-i2040S, refer to Section 4.3 in Single Phase and DC Embedded Metering (Power Monitor) Using MSP430i2040.
For the EVM430-F6736, refer to Section 5.1.2 in Implementation of a Single-Phase Electronic Watt-Hour Meter Using the MSP430F6736(A).
For the EVM430-F6779, refer to Section 5.1.2 in Implementation of a Three-Phase Electronic Watt-Hour Meter Using MSP430F677x(A).
In UniFlash, click “Session” > “New Session” to reset the previous session used for programming the LaunchPad.
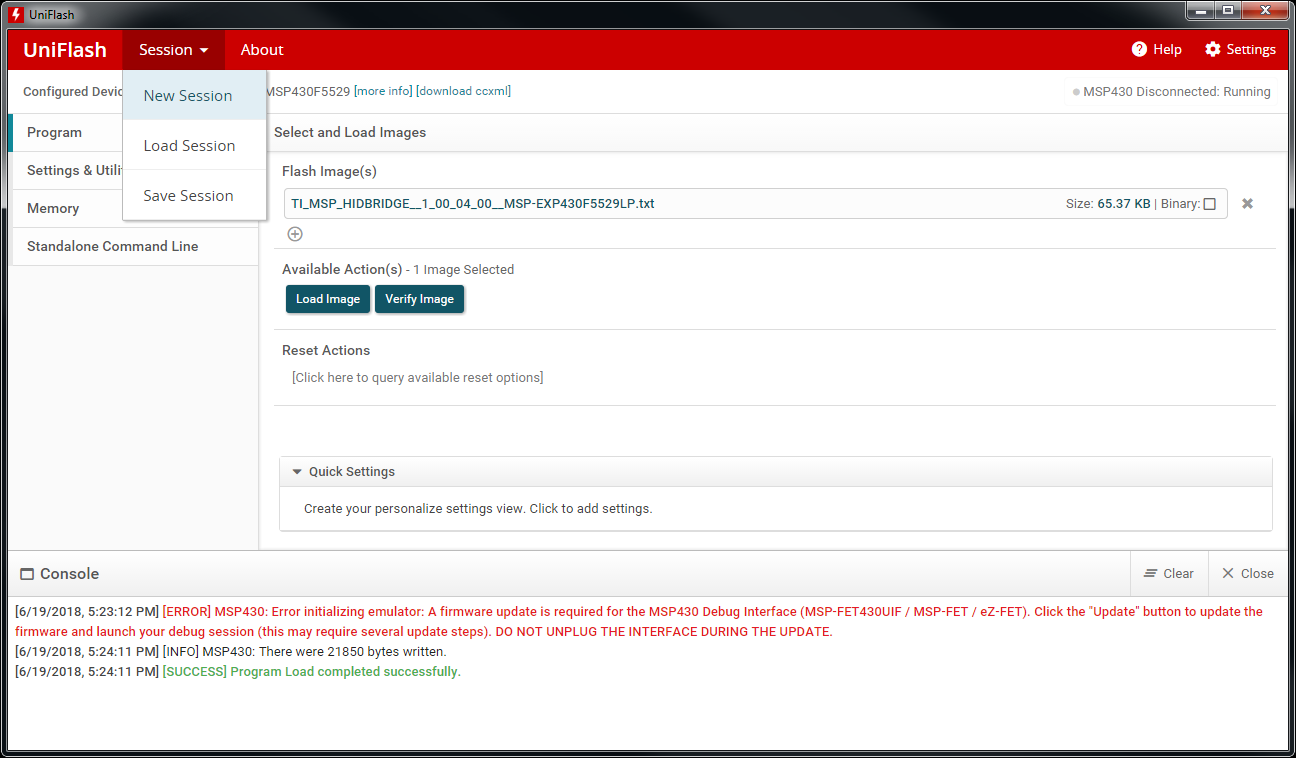
Fig. 10 Start New UniFlash Session
In the confirmation window, click “Yes” to continue.
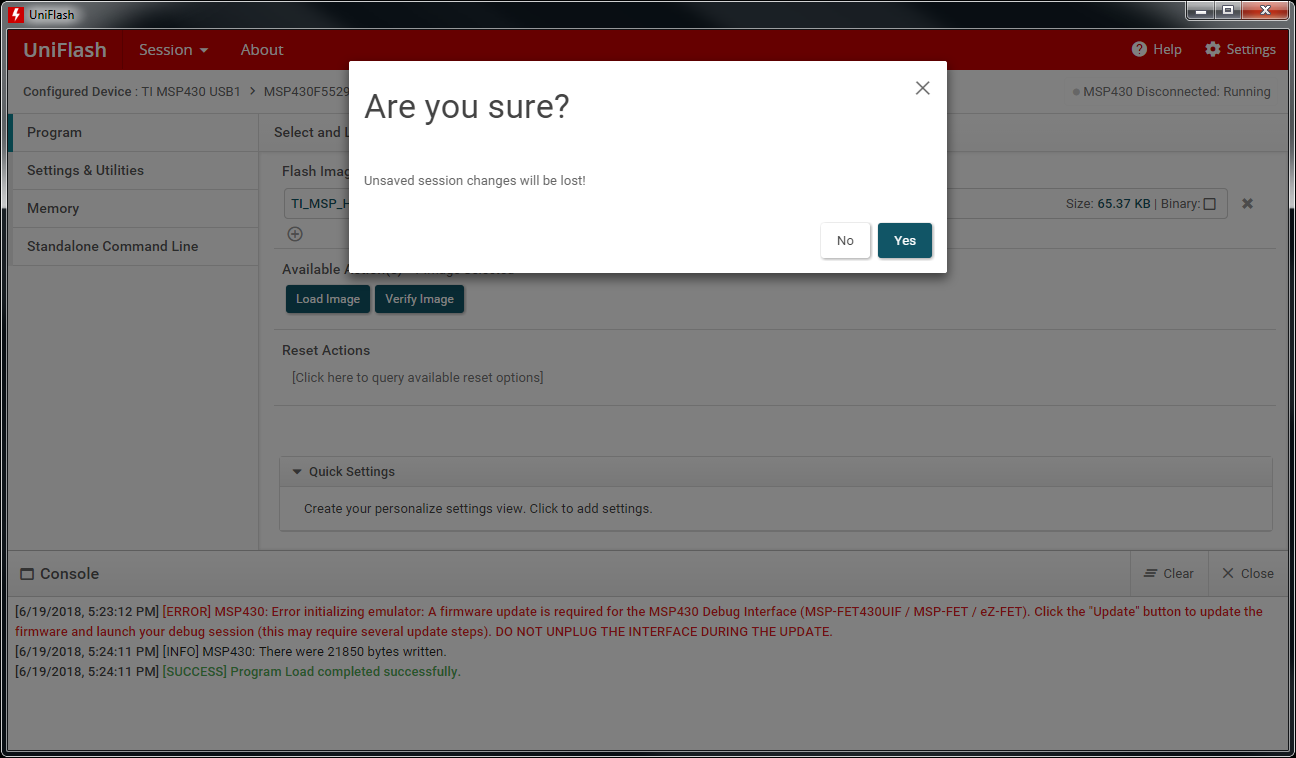
Fig. 11 Confirm New UniFlash Session
Next, enter the device’s part number (not the EVM’s part number) in the search box under “New Configuration”.
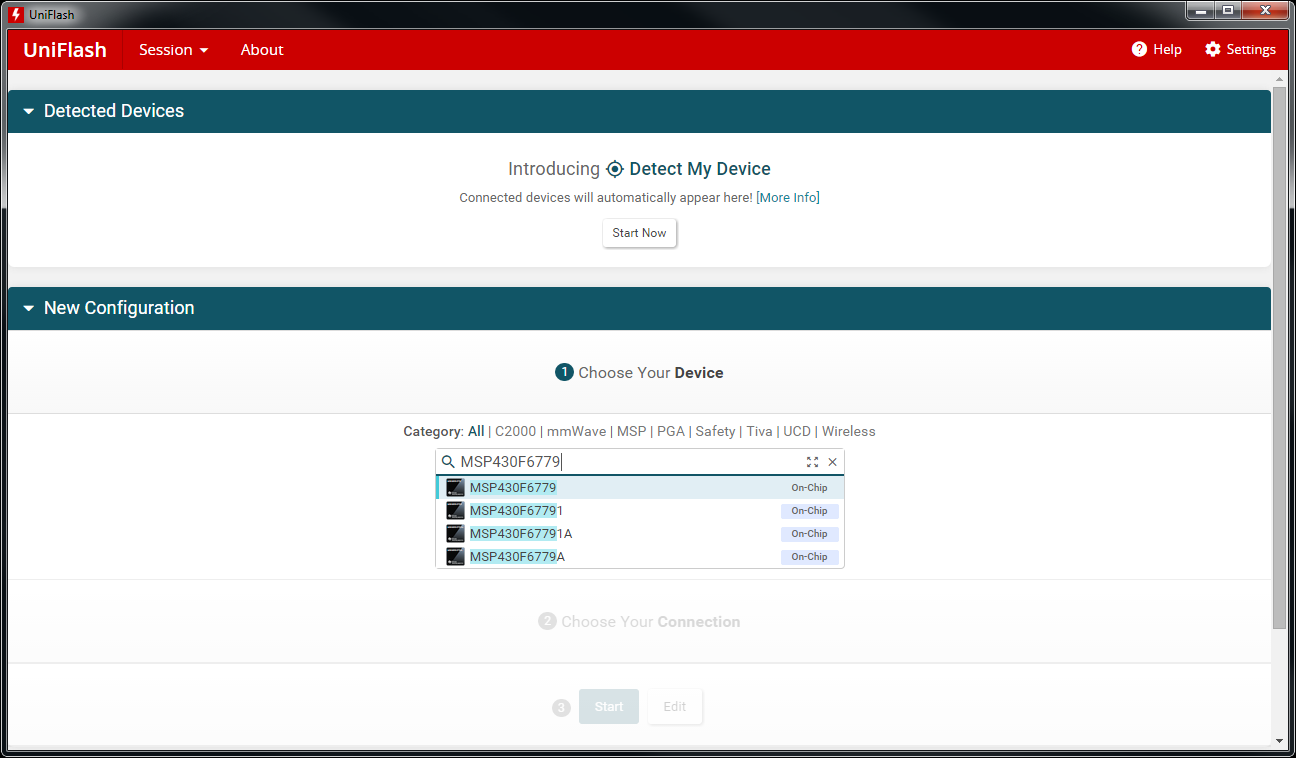
Fig. 12 Device Selection
Select USB connection and click the “Start” button.
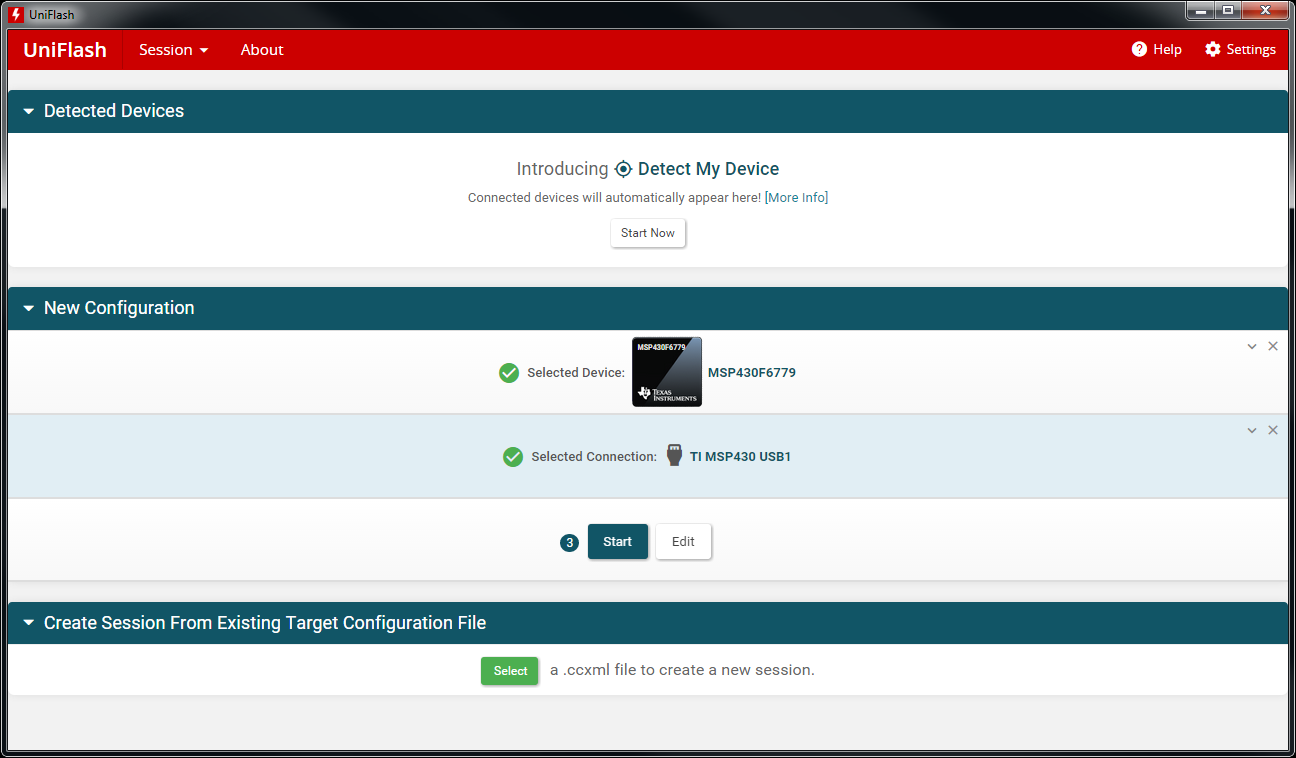
Fig. 13 USB Selection
Click “Browse” to select an EMDC example firmware image, located in one of the EMDC example project folders, for your specific EVM. For example, the EVM430-F6779_CT_3V_3C_60Hz.txt image can be found in the EVM430-F6779_CT_3V_3C_60Hz folder. If the default installation location was used, these folders can be found in the following location.
C:\Users\<profile>\EnergyMeasurementDesignCenter_<version>\EnergyMeasurementDesignCenterWorkspace
NOTE The naming convention for each example project folder and firmware image indicates the supported EVM part number, current sensor type, number of voltage channels, number of current channels, and the nominal AC mains input frequency.
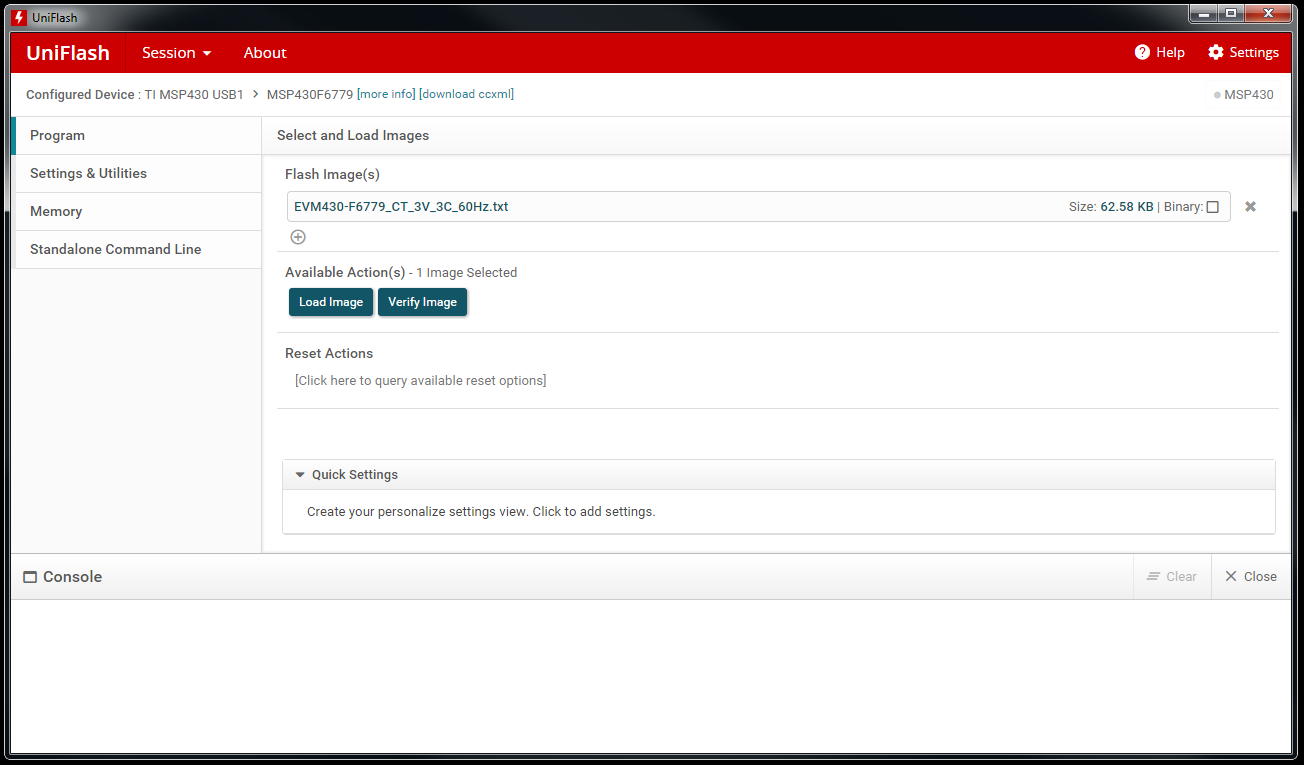
Fig. 14 Select Example Firmware Image
Under “Available Actions”, click the “Load Image” button to program the EVM. In the UniFlash “Console” window, “SUCCESS” should be shown when the program was loaded successfully.
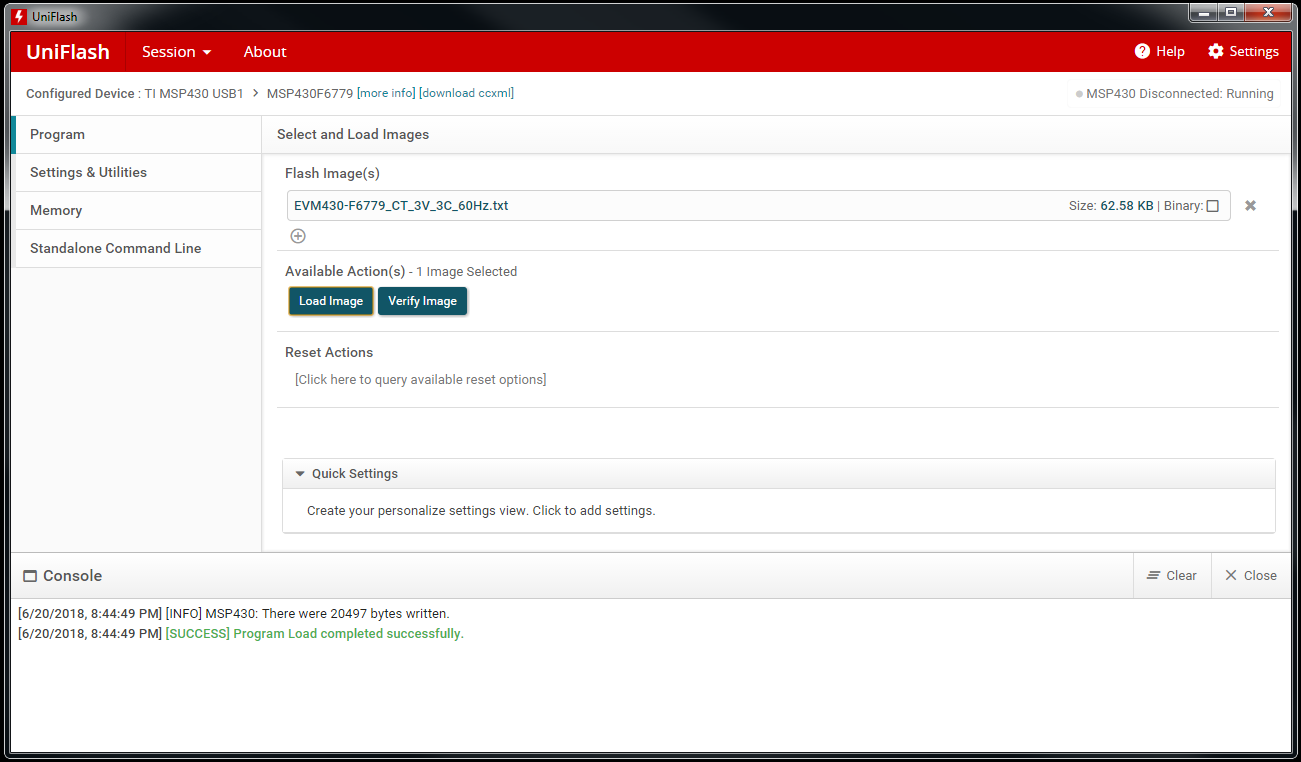
Fig. 15 Successful Program Load
Close UniFlash and disconnect the MSP-FET from the PC and EVM. NOTE The MSP-FET and JTAG interface on the EVMs are NOT isolated.
Make the Hardware Connections
This section describes how to properly make the communication connections and then the high voltage connections to the EVM.
Communication
Please refer to the high-level diagram below illustrating the communication connections between the PC and the EVM. These connections are for illustrative purposes only and do not indicate the connection locations. NOTE The RS232 connector cannot be used for communication with Energy Measurement Design Center at this time.
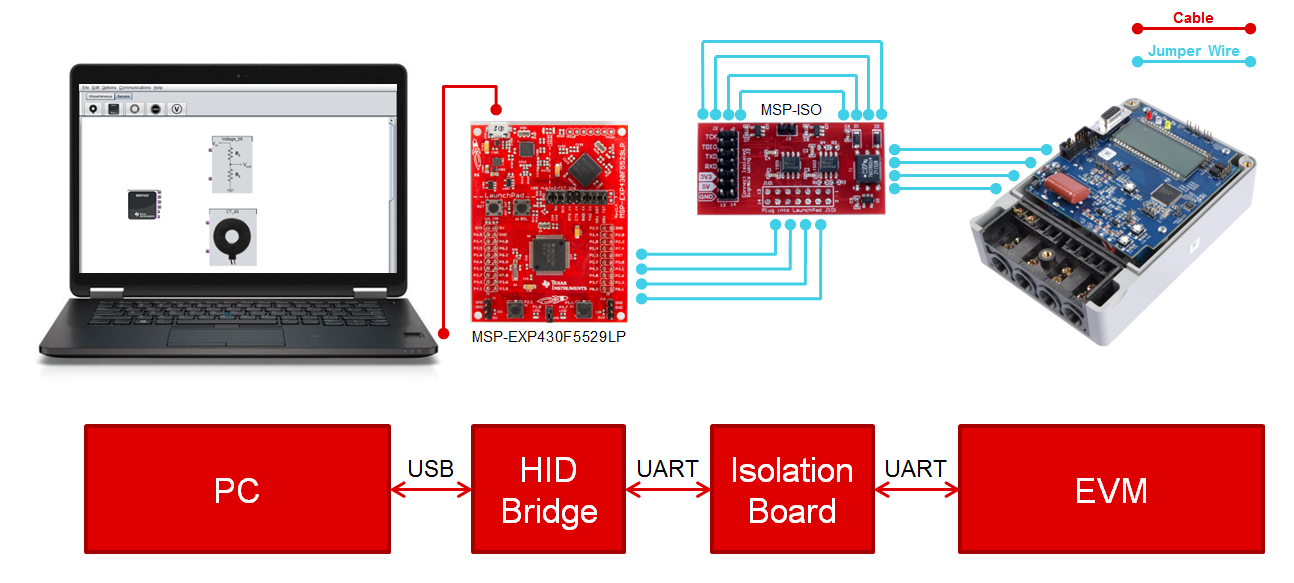
Fig. 16 Communication Connections Overview
First, plug the LaunchPad into the PC.
Next, the MSP-ISO Isolation board is a module that offers galvanic isolation between the HID bridge and the High Voltage EVM. The MSP-ISO must NOT be placed on the LaunchPad’s isolation jumper block but must be connected manually to the EVM and LaunchPad with jumper wires. The following pin map from the MSP-ISO Quick Start Guide can be used as a reference when connecting the jumper wires.
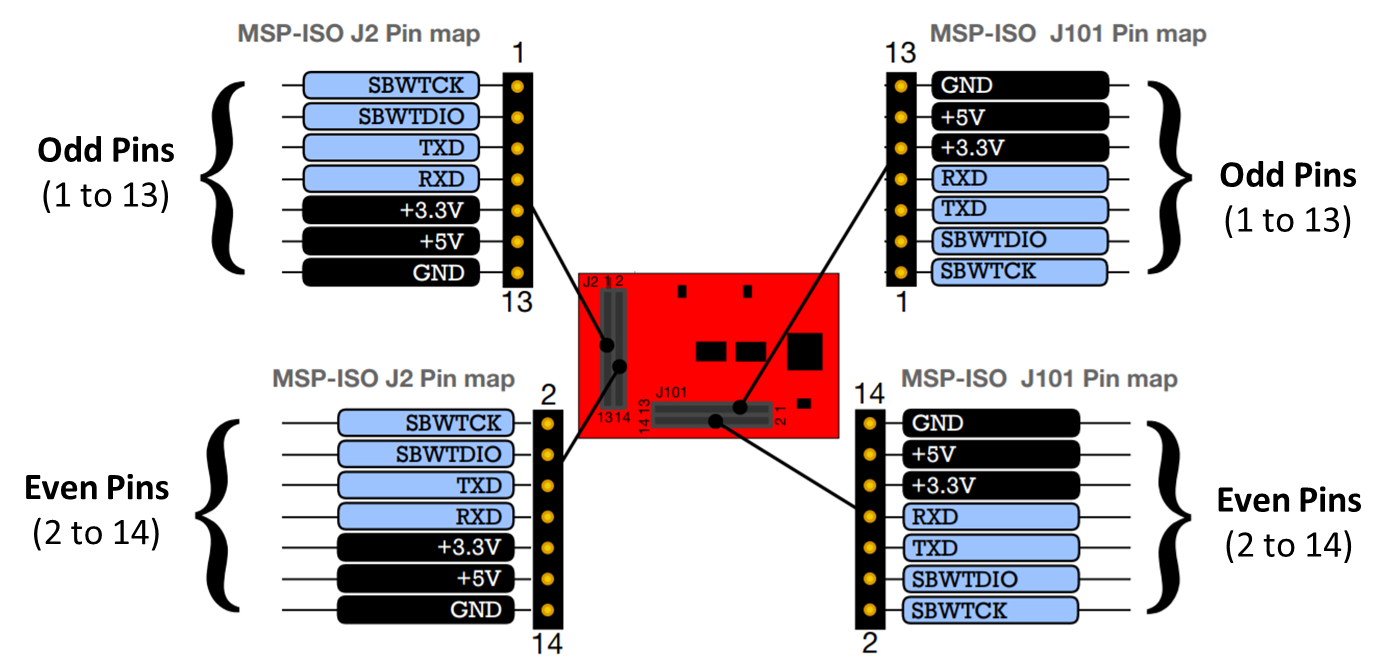
Fig. 17 MSP-ISO Pin Map
The table below shows how to connect the MSP-EXP430F5529LP (HID bridge) to the MSP-ISO (Isolation board). Information about the headers on the LaunchPad can be found in the MSP-EXP430F5529LP User’s Guide.
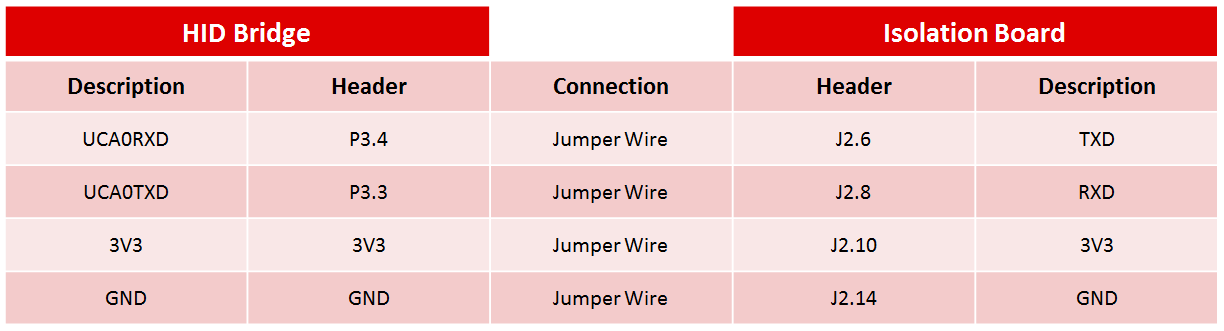
Fig. 18 Connections between HID Bridge and MSP-ISO
Next, the table below shows how to connect the pins of J101 on the MSP-ISO. NOTE Jumper J3 must be removed.
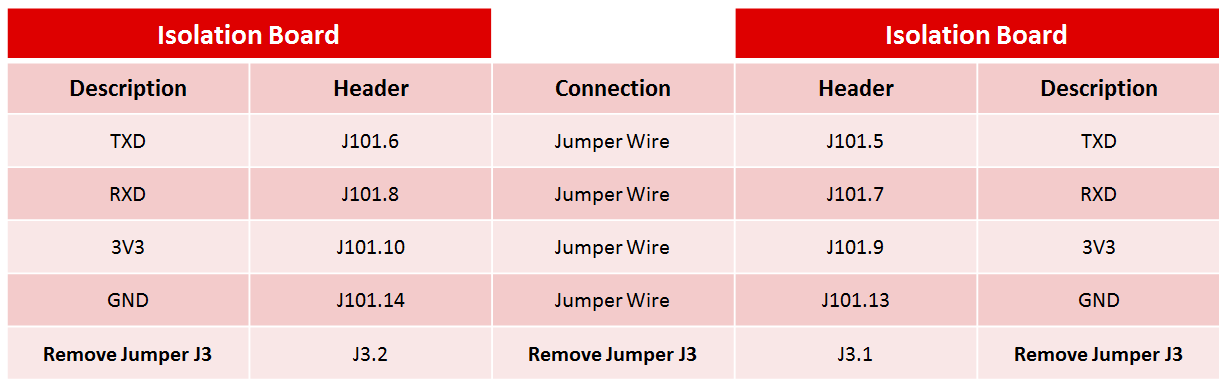
Fig. 19 Connections between MSP-ISO J101 Connector
Next, the table below shows how to connect the MSP-ISO to the supported EVMs. Information about these headers can be found in the EVM’s schematic and User’s Guide.
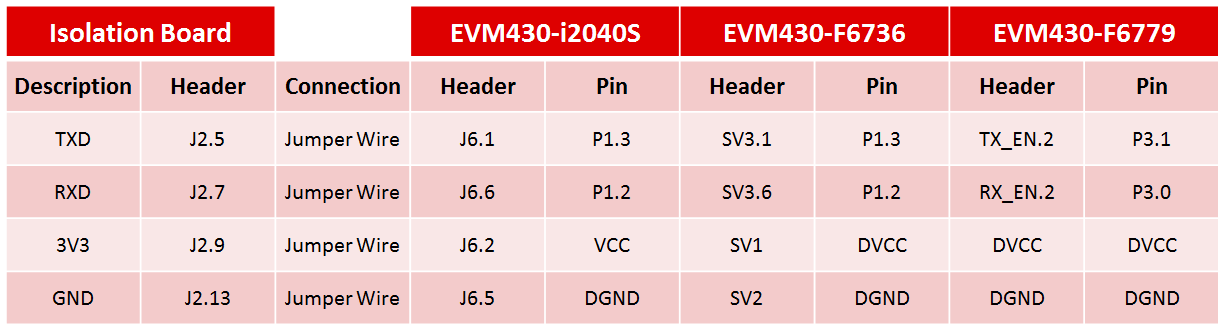
Fig. 20 Connections between MSP-ISO and EVM
High Voltage
Please refer to the EVM’s User’s Guide for properly configuring the on-board jumpers and connecting the EVM to a high voltage source.
For the EVM430-i2040S, refer to Section 4.3 in Single Phase and DC Embedded Metering (Power Monitor) Using MSP430i2040.
For the EVM430-F6736, refer to Section 5.1 in Implementation of a Single-Phase Electronic Watt-Hour Meter Using the MSP430F6736(A).
For the EVM430-F6779, refer to Section 5.1 in Implementation of a Three-Phase Electronic Watt-Hour Meter Using MSP430F677x(A).
View the Results
This section describes how to view results from the EVM. NOTE Assuming the instructions above have been followed, turn on the high voltage source at this point.
First, start the EMDC GUI by double-clicking on the desktop shortcut called “EnergyMeasurementDesignCenter”.
Fig. 21 Energy Measurement Design Center Shortcut
The GUI will open a blank design canvas.
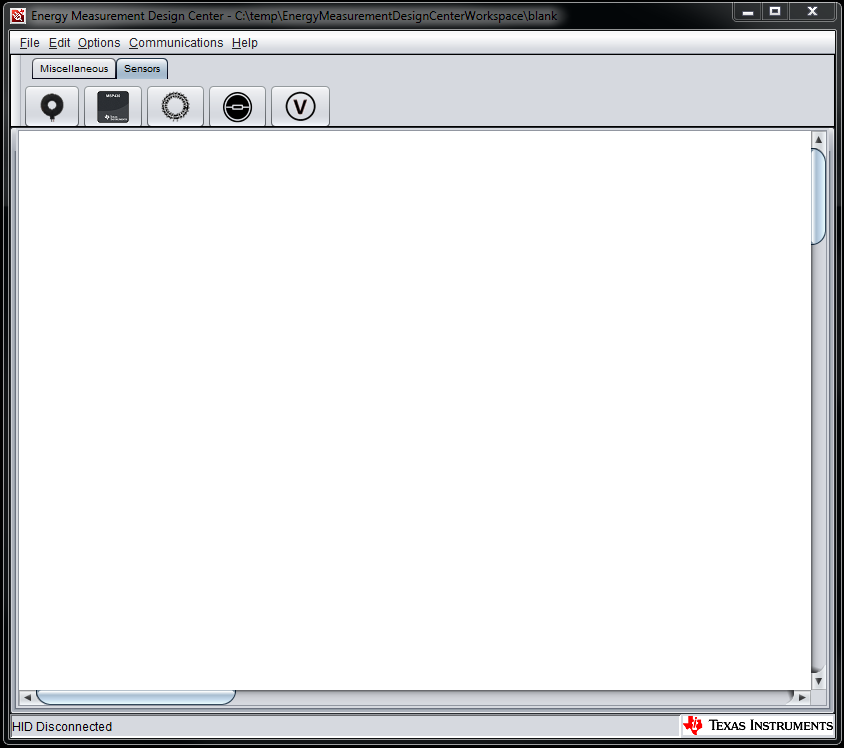
Fig. 22 Blank Design Center Canvas
Next, click “File” > “Project Open” in the Design Center menu bar to open an EMDC example project. Select the example project that matches the example firmware image you selected earlier.
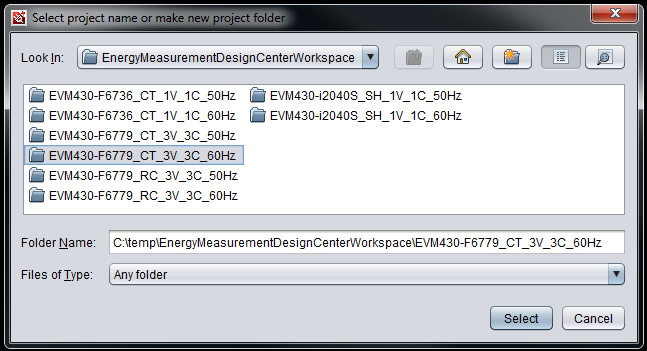
Fig. 23 Open Project Window
Next, double-click the MSP430 controller to display its properties window.
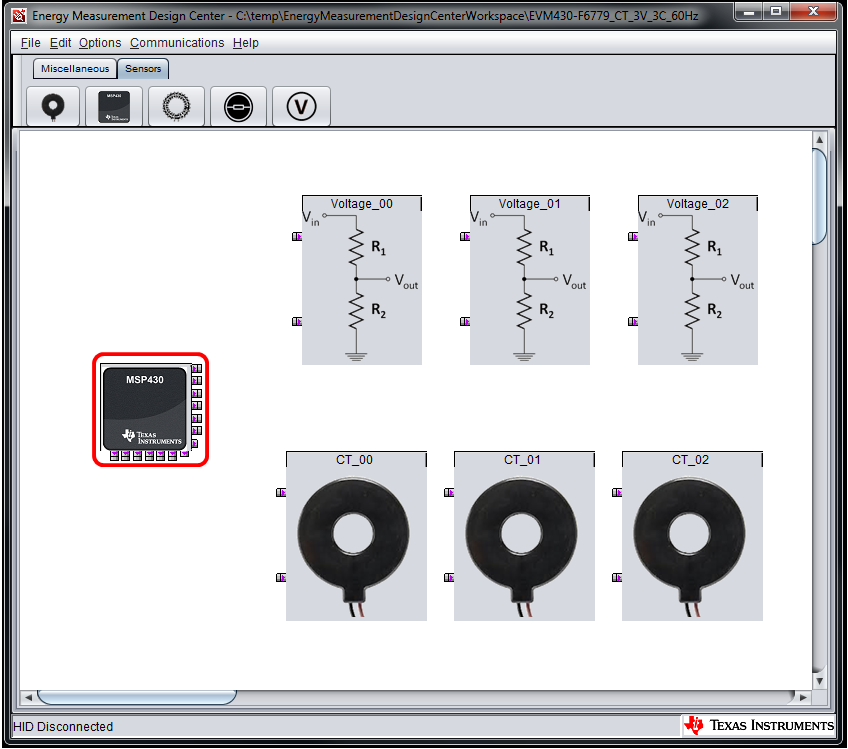
Fig. 24 Open Controller Properties Window
In the Controller properties window, enable the communication by clicking the “Connected” checkbox under “Target Communications”.
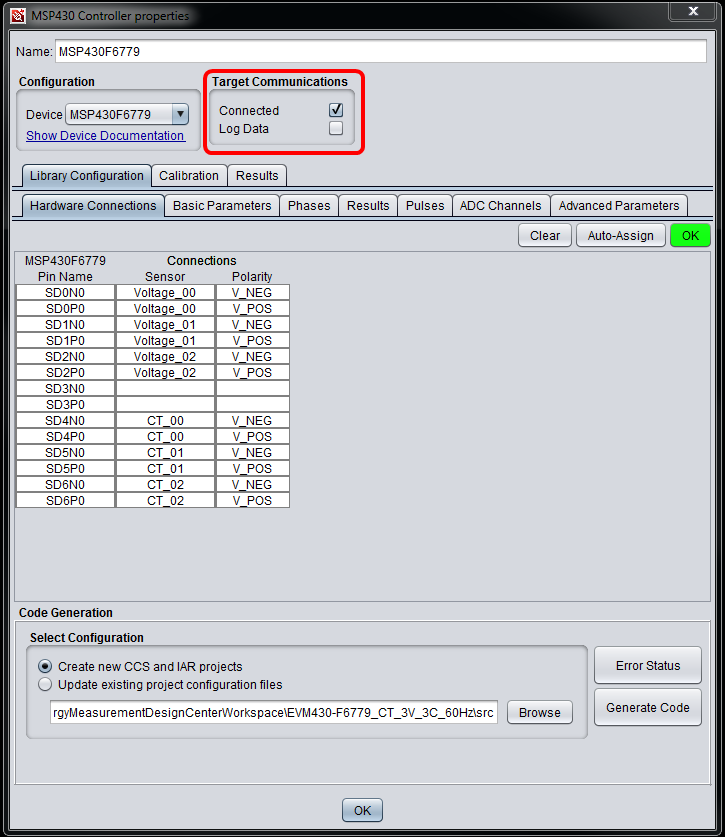
Fig. 25 Controller Properties Window
When the connection handshake is complete, the EMDC status bar will display the device name and firmware ID.

Fig. 26 Status Bar with Device Name and FW ID
Finally, click the “Results” tab (next to the “Calibration” tab) in the Controller properties window to view the results.
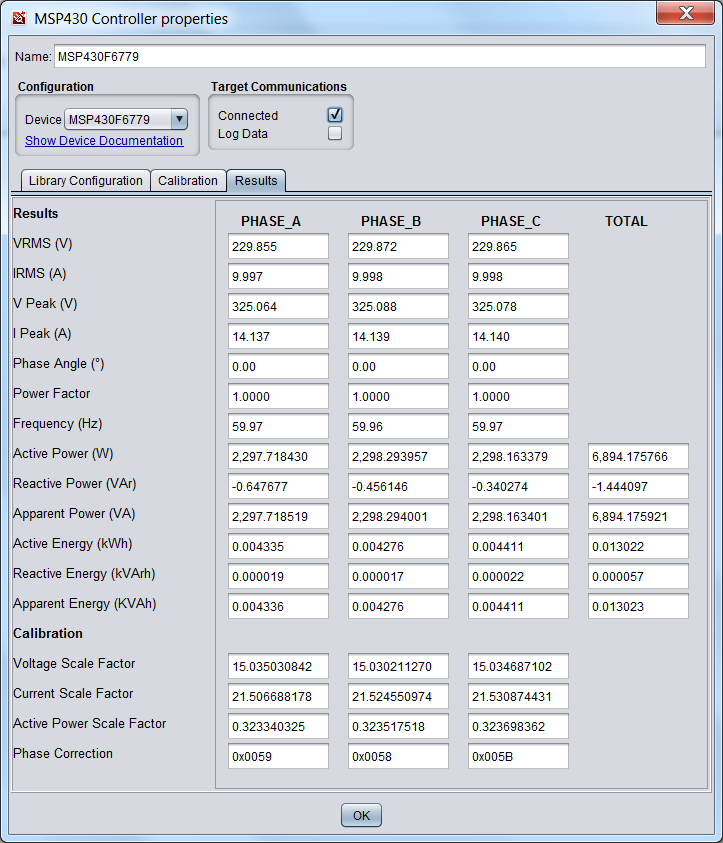
Fig. 27 3 Phase Results
Quick Start Guide
This section is intended to provide a very basic and quick overview of how to use the Energy Measurement Design Center (EMDC) to configure a typical energy measurement design (based on the three-phase EVM430-F6779), generate the source code, communicate with the target, and calibrate the system. For additional detailed information about the features of the Energy Measurement Design Center, please refer to the Energy Measurement Design Center User’s Guide.
Start the Design Center
The following sections will describe how to open an existing project or create a new project for the EVM430-F6779. The process to create a new project also applies to the other supported EVMs.
Double-click on the desktop shortcut called “EnergyMeasurementDesignCenter” to start the Design Center GUI.
Fig. 28 Energy Measurement Design Center Shortcut
The GUI will open a blank design canvas.
Fig. 29 Blank Design Center Canvas
Open an existing project
Click “File” > “Project Open” in the Design Center menu bar to open an existing project. For example, the EMDC example projects are shown below. If no changes are required to the opened project, then skip to Generate the Source Code section to generate the code.
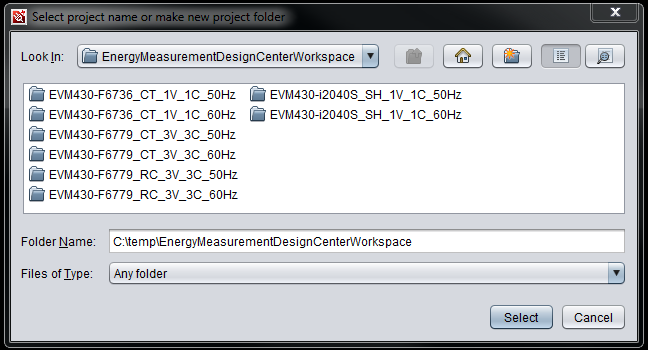
Fig. 30 Open Project Window
NOTE If the EVM has the default voltage and current sensors, the user can skip to Configure the MSP430 Controller. If the sensors have been changed, then skip to Configure the voltage sensors or Configure the current sensors and update the sensor / system parameters.
Create a new project
Click “File” > “Project New” in the Design Center menu bar to create a new project called “EVM430-F6779” and click “OK”.
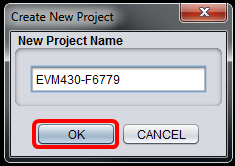
Fig. 31 Create New Project Window
Place the MSP430 controller
Start by clicking the MSP430 controller icon. Select “MSP430F6779” in the Device Selection window and click “OK”. Place the controller by clicking on the design canvas.
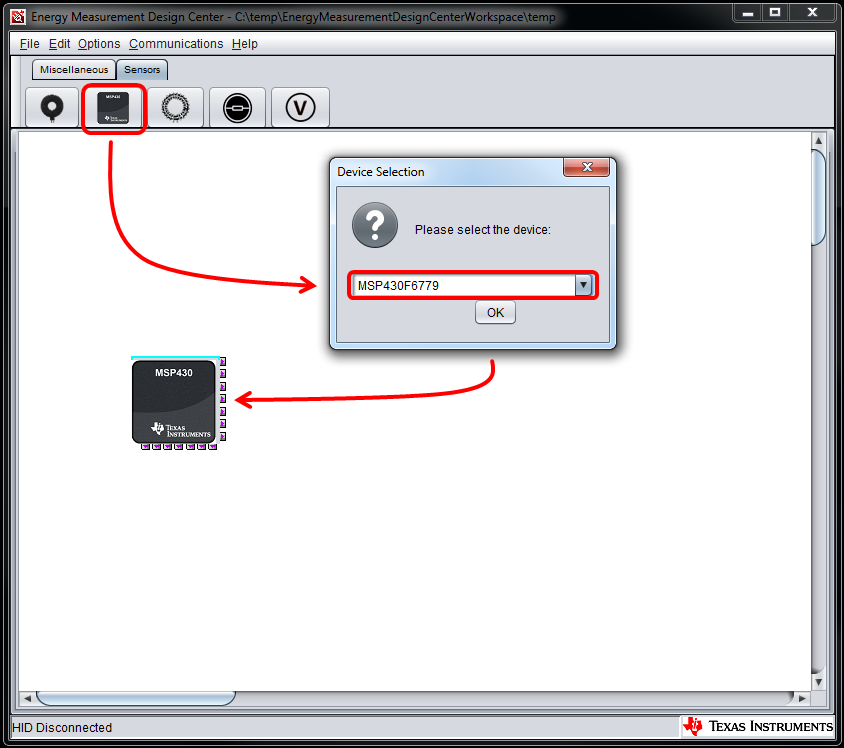
Fig. 32 Select and Place MSP430 Controller on Design Canvas
Place the voltage sensors
Start by clicking the voltage sensor icon. Place the voltage sensor by clicking on the design canvas. Repeat this process twice to place a total of three voltage sensors.
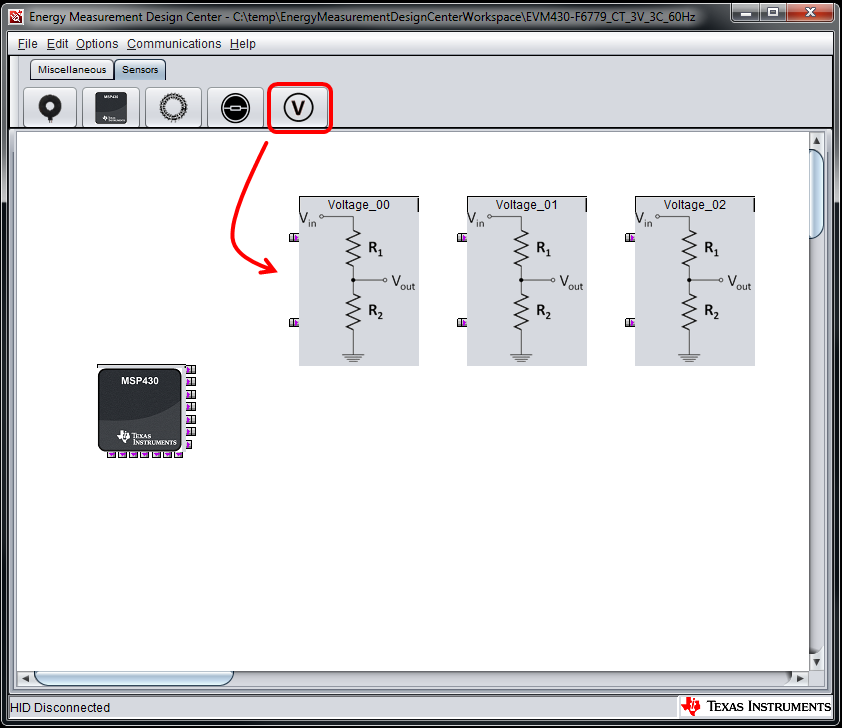
Fig. 33 Select and Place Voltage Sensors on Design Canvas
Place the current sensors
Since the EMV430-F6779 features CTs, start by clicking the CT icon. Place the current sensor by clicking on the design canvas below the voltage sensors. Repeat this process twice to place a total of three CTs.
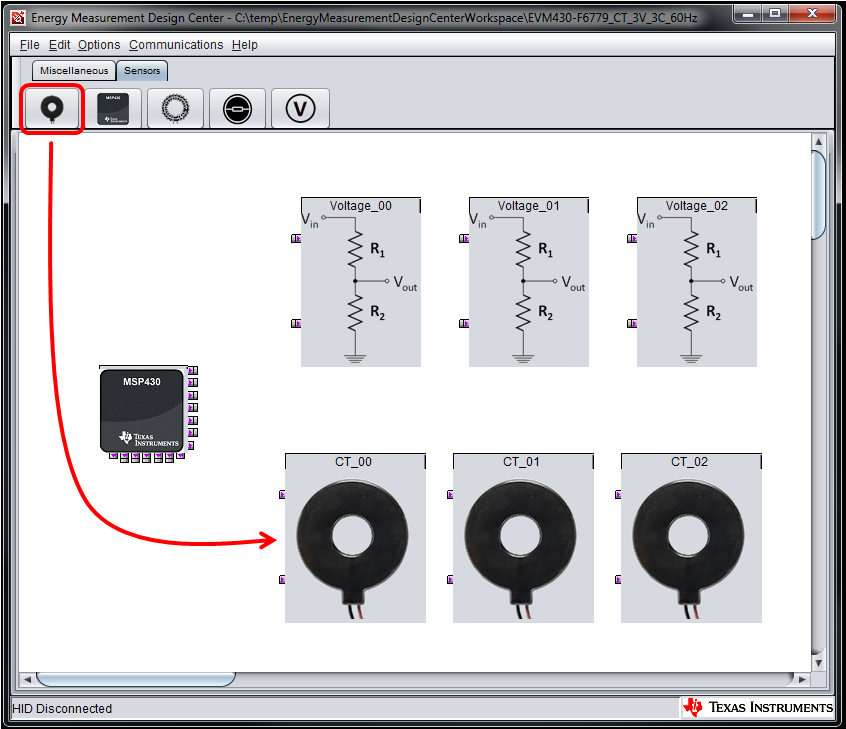
Fig. 34 Select and Place Current Sensors on Design Canvas
Configure the voltage sensors
Start by double-clicking a voltage sensor to display its properties window. Enter the parameters based on the user’s guide and schematic for the EVM430-F6779 and click “OK”. Repeat this process for the other voltage sensors.
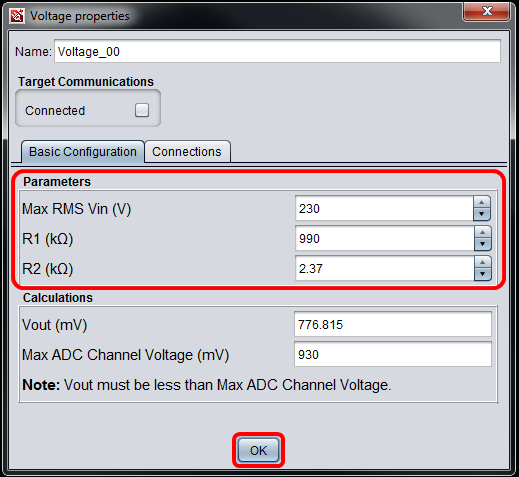
Fig. 35 Configure Voltage Sensor Parameters
Configure the current sensors
Start by double-clicking a CT to display its properties window. Enter the parameters based on the user’s guide and schematic for the EVM430-F6779 and click “OK”. Repeat this process for the other CTs.

Fig. 36 Configure Current Sensor Parameters
Configure the MSP430 controller
Start by double-clicking the MSP430 controller to display its properties window.
Library Configuration
Hardware Connections
Note that the initial connections for the CTs do not match the EVM430-F6779 connections and were made automatically according to the placement order of the voltage and current sensors.
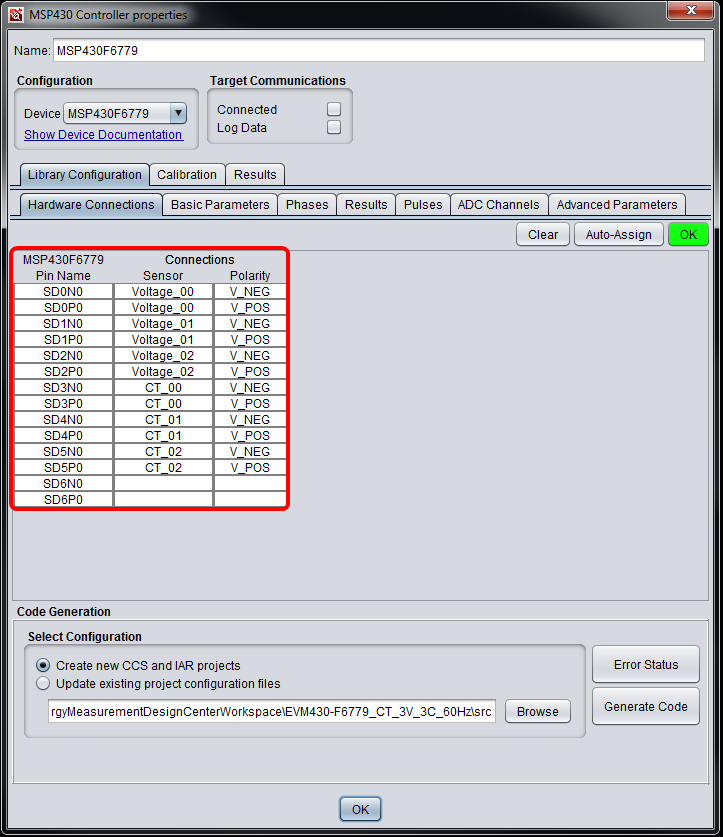
Fig. 37 Initial Connections between Controller and Sensors
Disconnect each current sensor by clicking each CT cell under the “Sensor” column and selecting “DISCONNECT” from the drop-down menu.
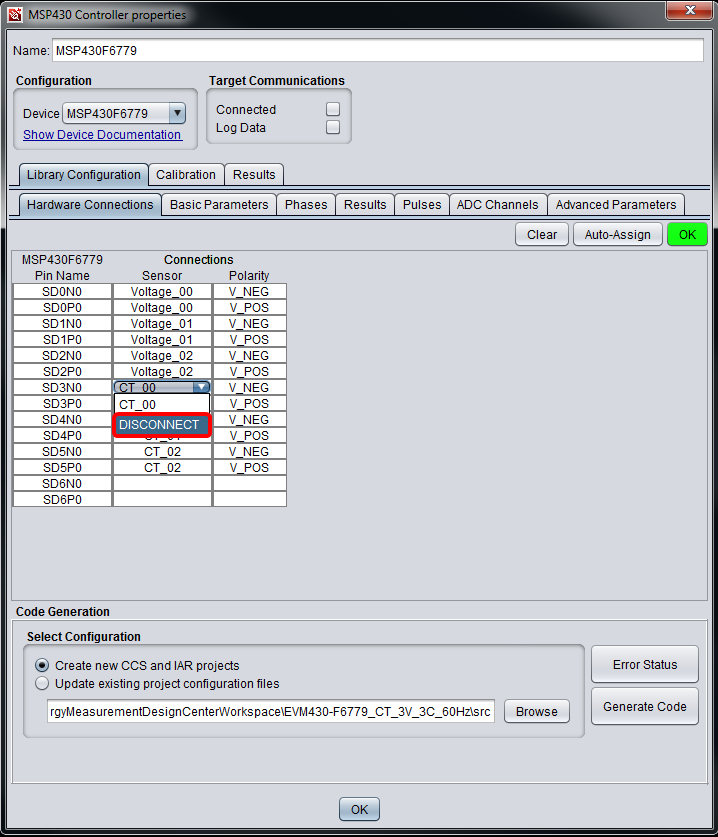
Fig. 38 Disconnect CTs
Reconnect the current sensors by clicking the cells in the “Sensor” and “Polarity” columns to correctly match the EVM430-F6779 connections. Note that the green “OK” button indicates that all sensor pins have been connected to controller pins.
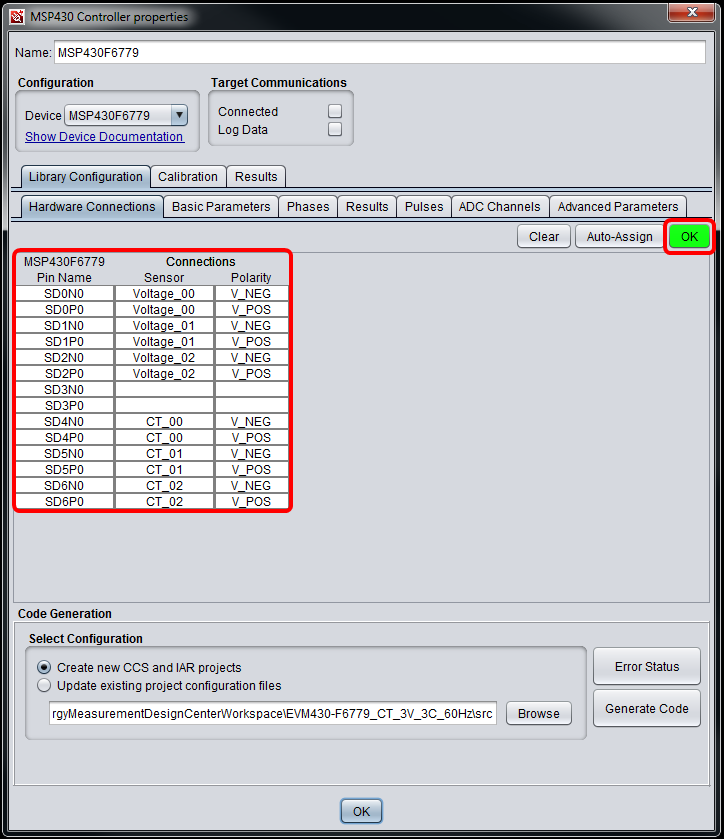
Fig. 39 Correct Connections between Controller and Sensors
Basic Parameters
Click the “Basic Parameters” tab and change the meter name to “EVM430-F6779”. Using the drop-down menus, increase the sampling frequency to 4096 Hz, increase the OSR to 256, and increase the SMCLK frequency to 25,165,824 Hz. Change the default AC mains frequency to 60 Hz, but keep the default number of voltage and current sensors.
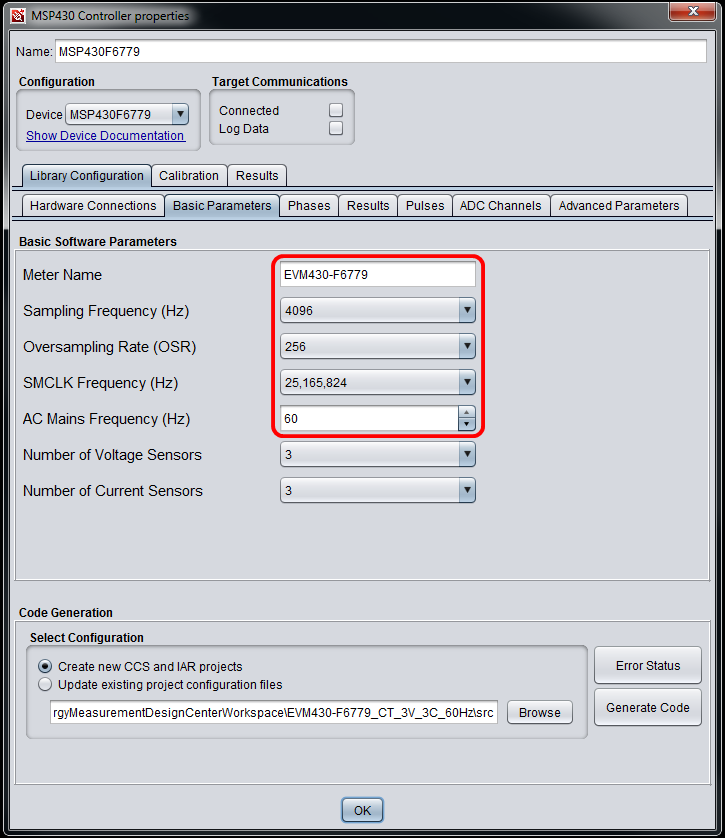
Fig. 40 Change Default Basic Parameters
Phases
Click the “Phases” tab and choose three different phase names. Assign a pair of ADC voltage and current channels to each phase name. Note that these phase names are used during calibration and communication. Check each box under “Total” to aggregate all phases.
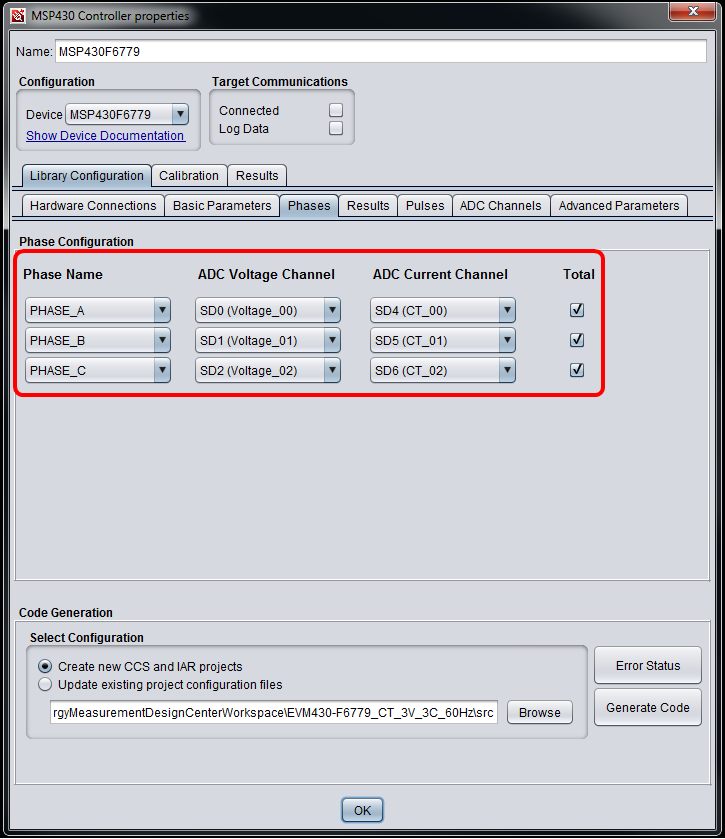
Fig. 41 Configure the Phases
Results
Click the “Results” tab and click the “Select All” button to choose all results. Click the “Save” button to validate any dependencies across selected results before saving the configuration. Note that the estimated CPU bandwidth is for the software library only. The estimation depends on these results and the parameters selected in the “Basic Parameters” tab.
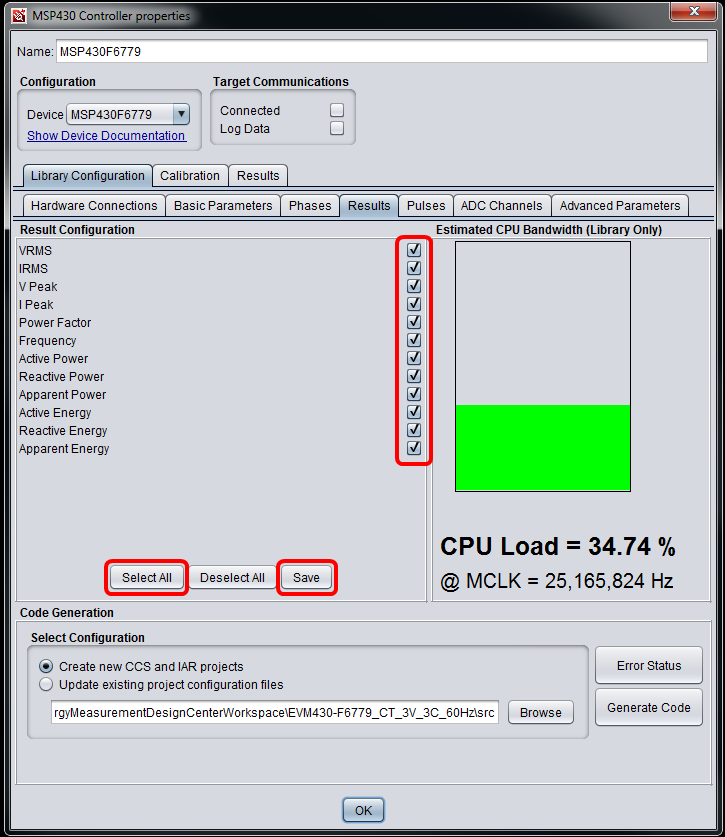
Fig. 42 Select Results and View Estimated CPU Bandwidth
Pulses
Click the “Pulses” tab. Note that the phase names are automatically populated with those selected in the “Phases” tab. The EVM430-F6779 features several LEDs and headers that are used to output active and reactive energy pulses used for measuring accuracy during calibration and indicating power consumption for individual phases and total (aggregate). Start by checking each box under “Enable”. Select the Active/Reactive Ports/Pins for each phase according to the user’s guide and schematic for the EVM430-F6779.
NOTE The pulses are disabled automatically when Active Energy or Reactive Energy are not selected in the Results tab, since they’re not needed.
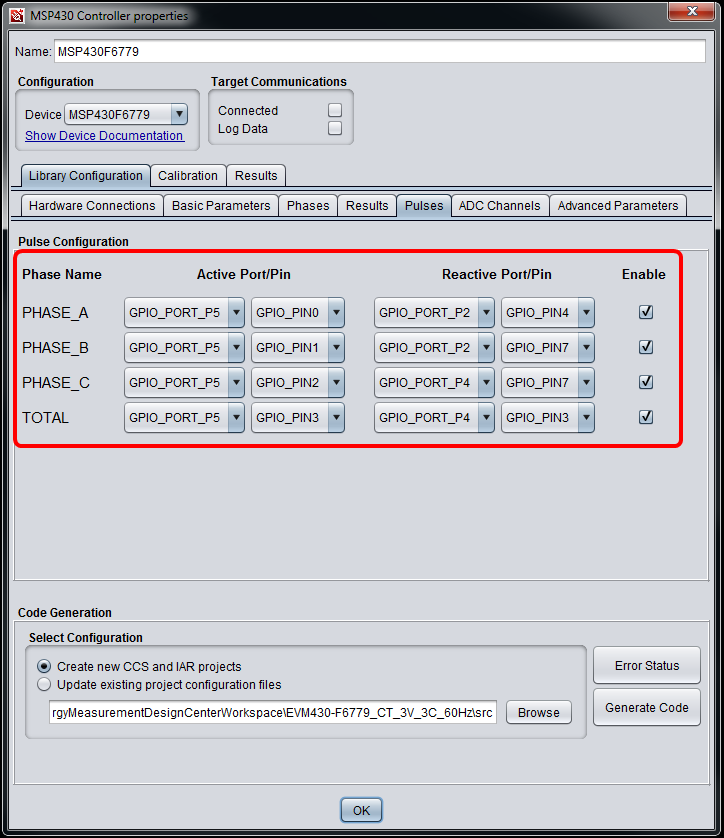
Fig. 43 Select GPIOs for Active and Reactive Energy Pulses
Check for errors
Click the “Error Status” button to check for configuration errors.
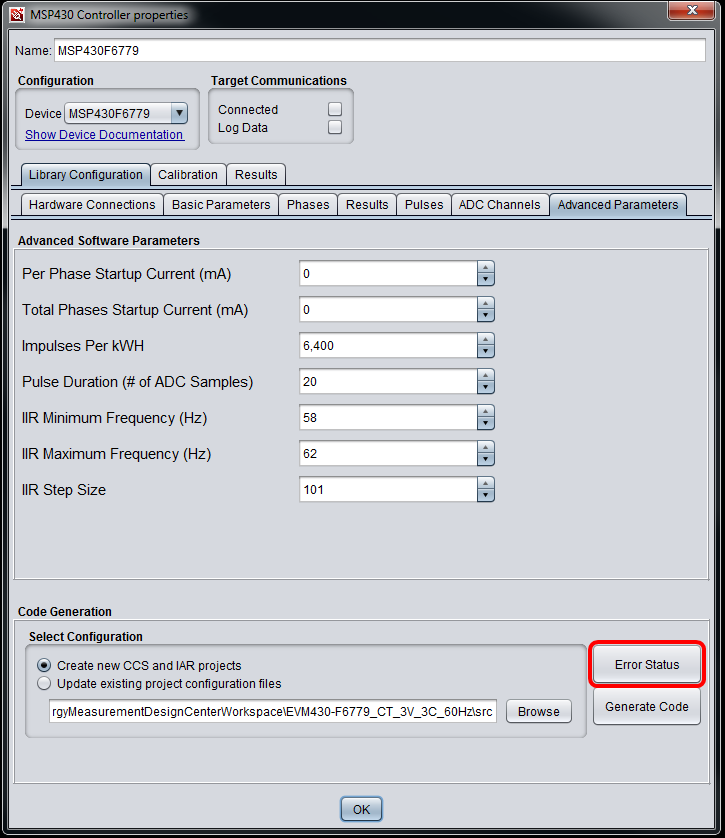
Fig. 46 Error Status Button
The Configuration Error Status window will pop up. Note that each section matches a tab under the Library Configuration tab in the MSP430 controller properties window. Errors will be shown as a red X instead of the green checkmark. If there are no errors, click “OK” to continue.
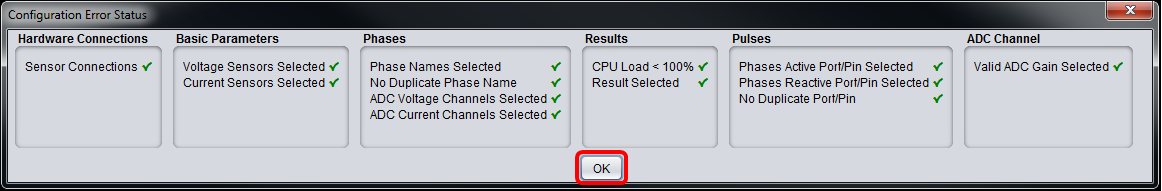
Fig. 47 Error Status Window
Generate the source code
Start by selecting where the source code project will be generated by clicking the “Browse” button or keep the default location. Copy this file path to use later when importing the source code project into the IDE.
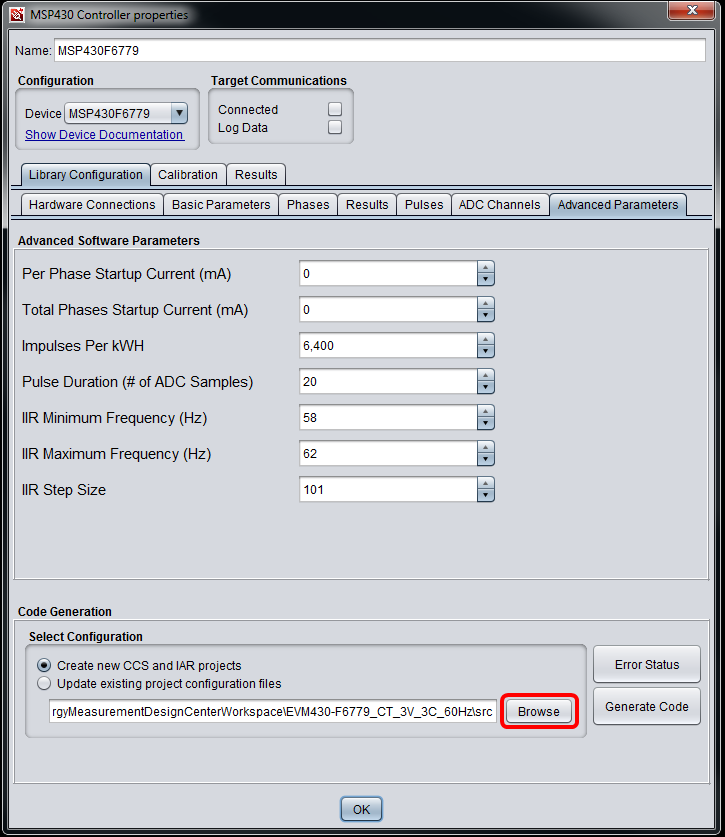
Fig. 48 Browse Button
Click the “Generate Code” button to create the source code project.
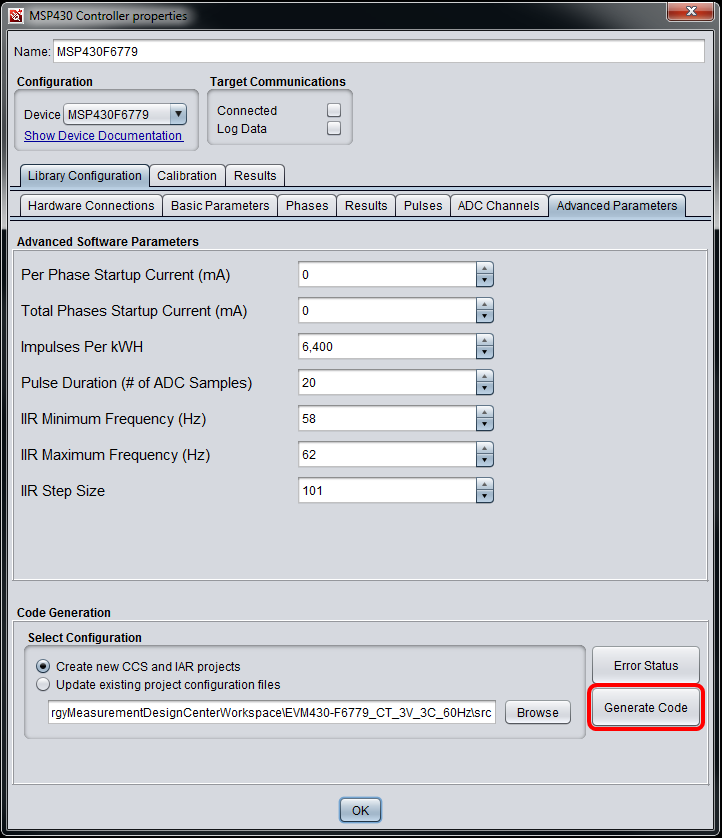
Fig. 49 Generate Code Button
An information window will pop up confirming that code has been generated successfully. Click “OK” to continue.
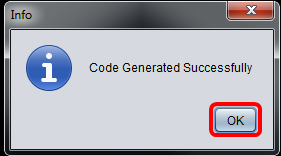
Fig. 50 Code Generation Confirmation Window
Update existing project
For existing CCS projects in the CCS workspace, follow these instructions:
Copy the CCS project’s path
Select “Update existing project configuration files” under “Select Configuration”
Click on Browse button
Paste CCS project’s path into the Folder name text box
Hit Enter
Click the “Generate Code” button
For existing IAR projects, follow these instructions:
Select “Update existing project configuration files” under “Select Configuration”
Click the “Generate Code” button
An information window will pop up confirming that code has been generated successfully. Click “OK” to continue.
This will update the configuration in the following files:
EM_Config\EM_config.cEM_Config\EM_config.hEM_Config\emReactivePowerIIRCoeff.hhal\hal_adc.chal\hal_adc.hDesignCenter\guiApp\hmiDC\hmi.cDesignCenter\guiApp\hmiDC\hmi.h
Load and run the generated firmware using the CCS IDE
Open Code Composer Studio IDE, right click on the Project Explorer window and select “Import” > “CCS Project”.
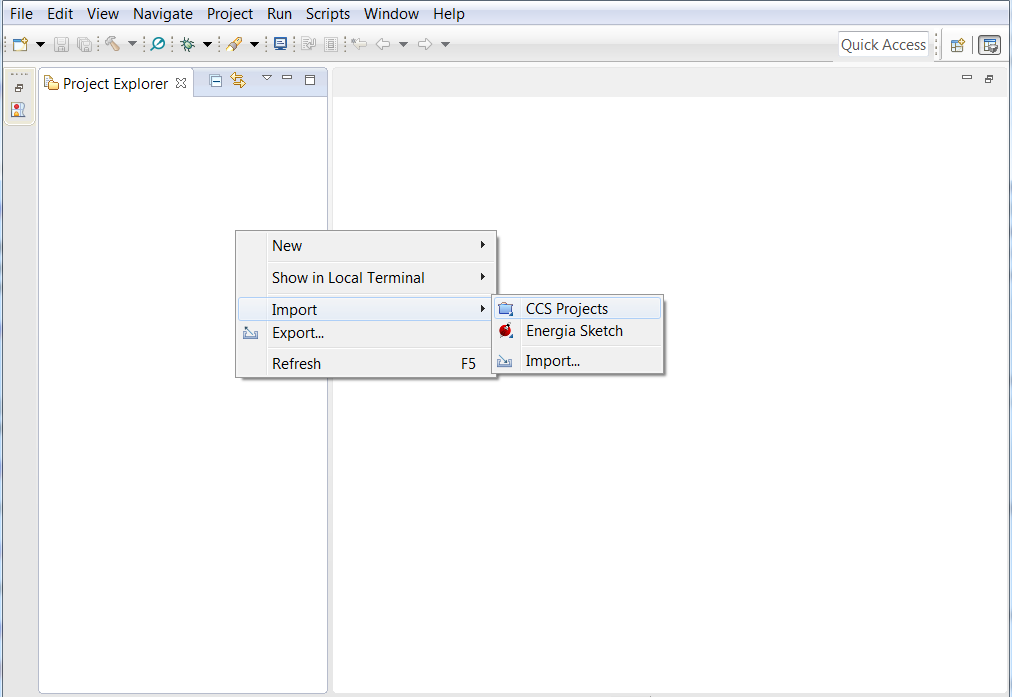
Fig. 51 Code Composer Studio Workspace
Click on “Browse” and select the CCS folder inside of the EMDC project as shown below.
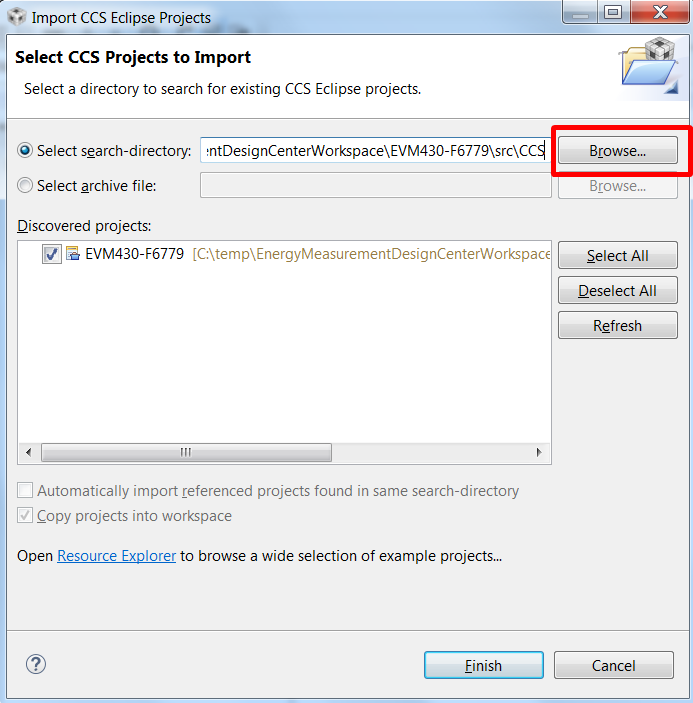
Fig. 52 Code Composer Studio Importing Project
Click on “Finish” to complete the project import.
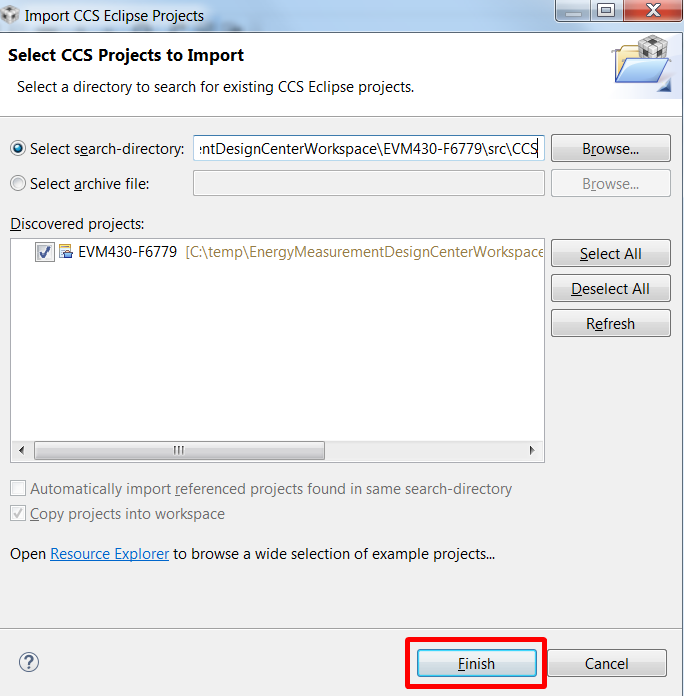
Fig. 53 Code Composer Studio Imported Project
After importing the project, click the debugger icon to build and download the code to the target. Then start the code by clicking the run button. Then click stop debugging and power cycle the target.
Load and run the generated firmware using the IAR IDE
Open IAR Embedded Workbench IDE, select “File” > “Open Workspace…”
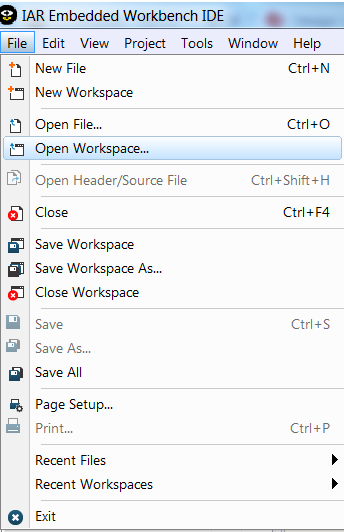
Fig. 54 Open IAR Workspace
Select the IAR workspace project (*.eww) located in the IAR folder inside of the EMDC project as shown below.
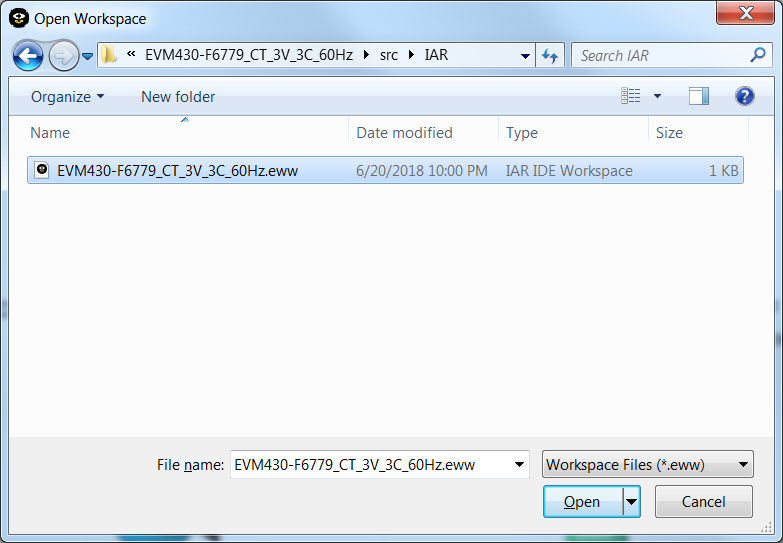
Fig. 55 Open IAR Project
If the following prompt appears to convert the project to the new format, select “Yes”
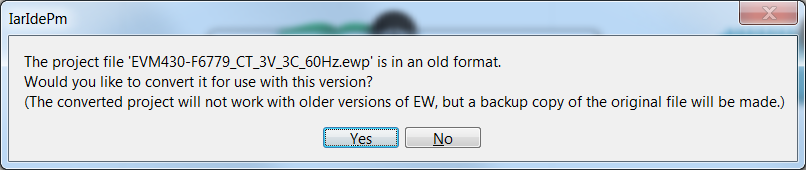
Fig. 56 Convert IAR Project to New Format
After importing the project, select “Project” > “Download and Debug”. Then start the code by clicking the run button. Then click stop debugging and power cycle the target.
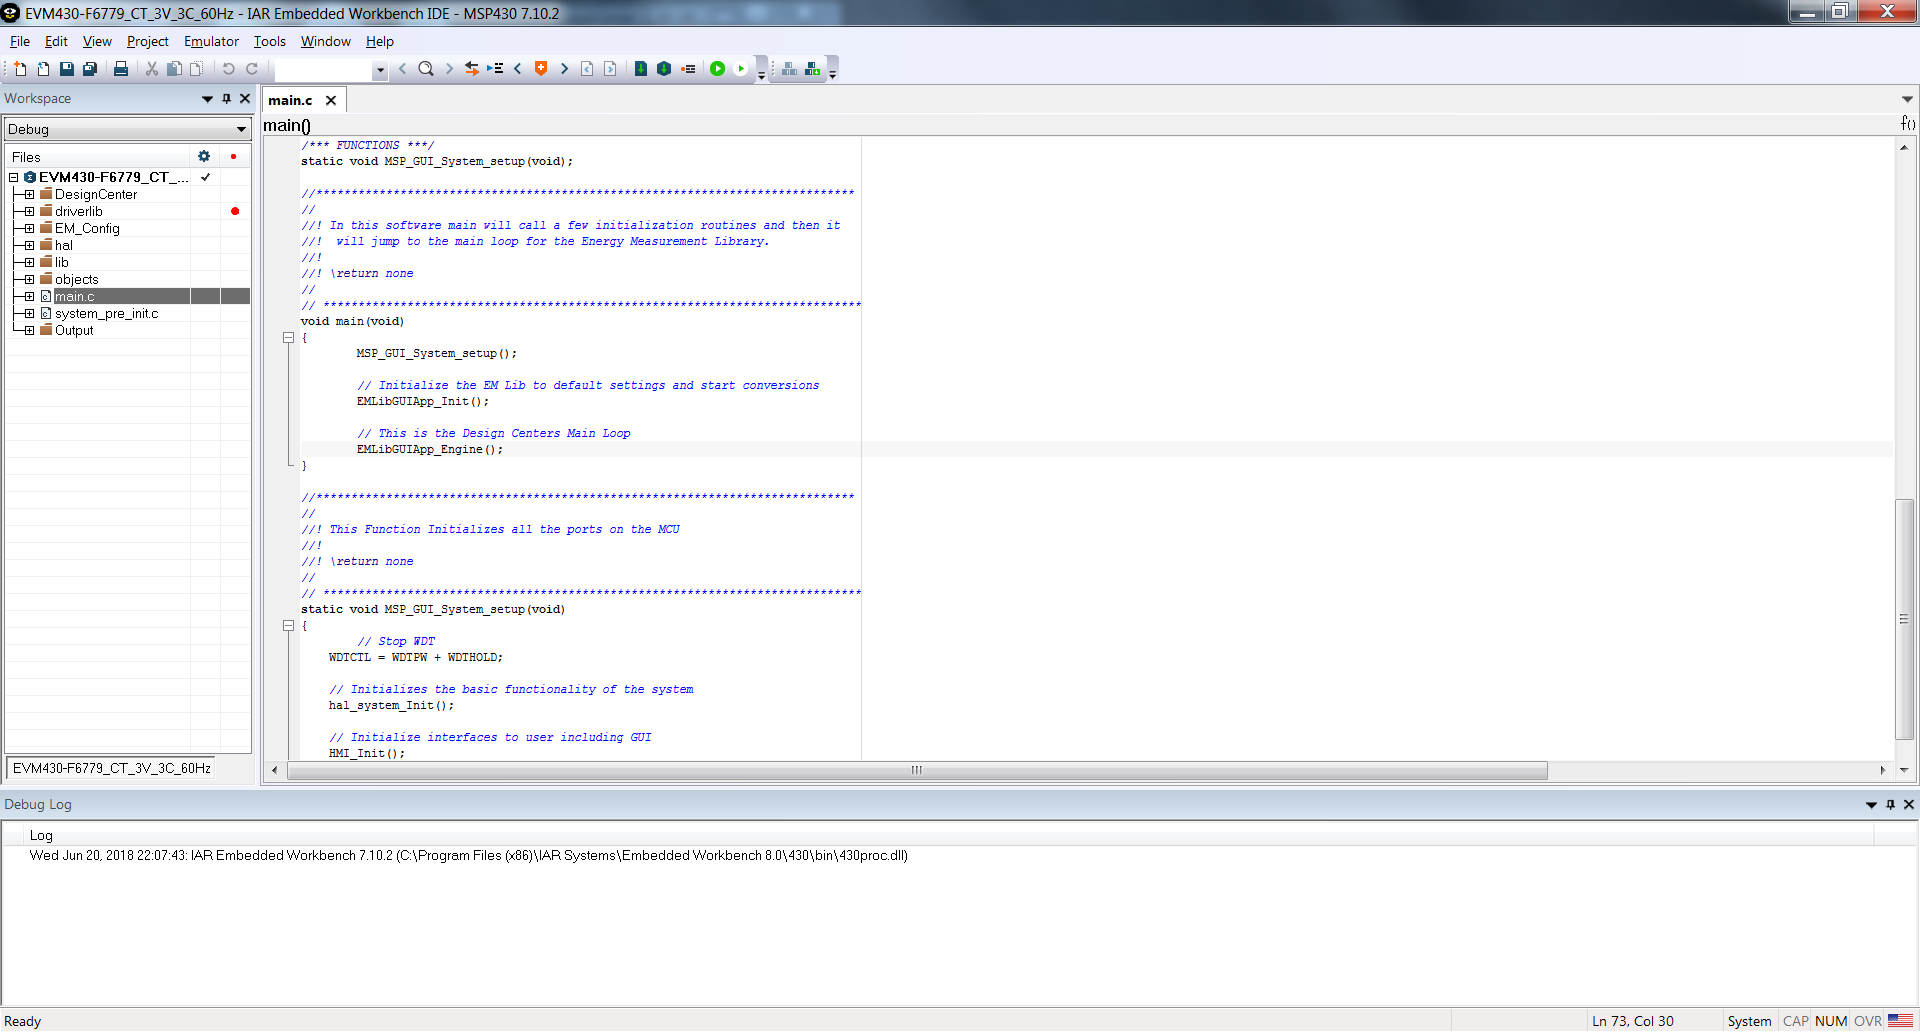
Fig. 57 Energy Measurement IAR Project
Start communicating with Controller
In the controller properties window, click on the Connected button as shown below.
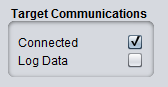
Fig. 58 EMDC Connection Window
When the connection handshake is complete, the EMDC status bar will display the device name and firmware ID.
NOTE Communication with the controller is required for calibration and viewing results.
Fig. 59 Status Bar with Device Name and FW ID
Calibration
Configure the high voltage setup at desired VRMS, IRMS, phase angle and frequency.
Open the controller properties window and click on the “Calibration” tab.
Select Phase A in the “Phase Selection” panel and click on Gain calibration checkbox as shown below. Note that the phase angle will default to 0 degrees when clicking this checkbox.
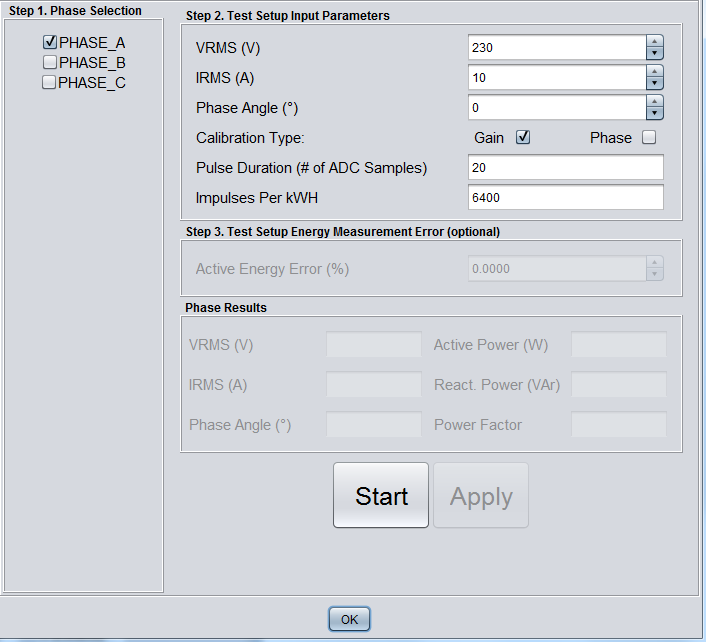
Fig. 60 Starting Calibration
Gain Calibration
Enter the test setup configuration parameters in Step 2 and click the “Start” button to initiate calibration for Phase A.
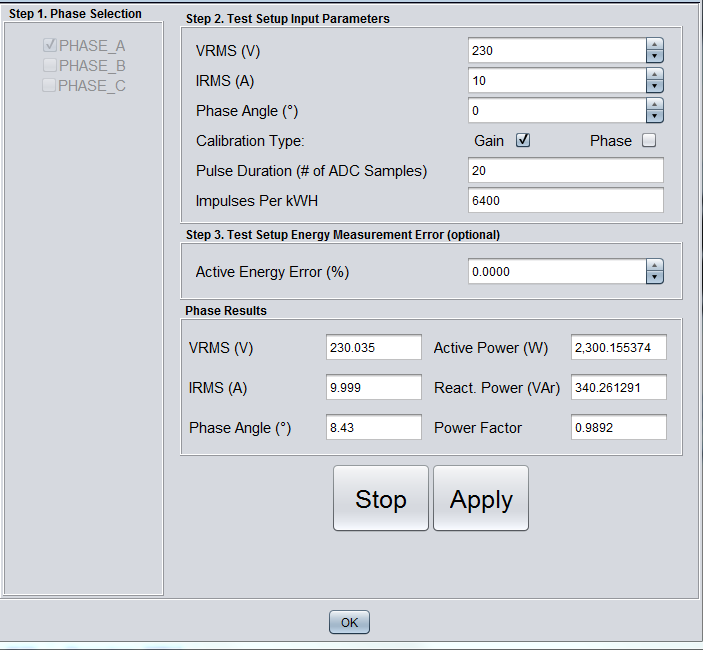
Fig. 61 Phase A Gain Calibration
If the high voltage test equipment supports energy measurement error, the error can be entered in the “Active Energy Error” field. Otherwise, EMDC can automatically calculate the energy measurement error based on the expected energy result. This is calculated using the VRMS, IRMS, and phase angle parameters entered in Step 2.
Click on Apply to calibrate the voltage, current and active power scaling factors. When the calibration values have been sent to the target a Gain Calibration Window message will appear.
Fig. 62 Phase A Gain Calibration Complete
Phase Calibration
Select the “Phase” checkbox for the Calibration Type. Note that the phase angle will default to 60 degrees when clicking this checkbox. Remember to change the phase angle on the high voltage test equipment
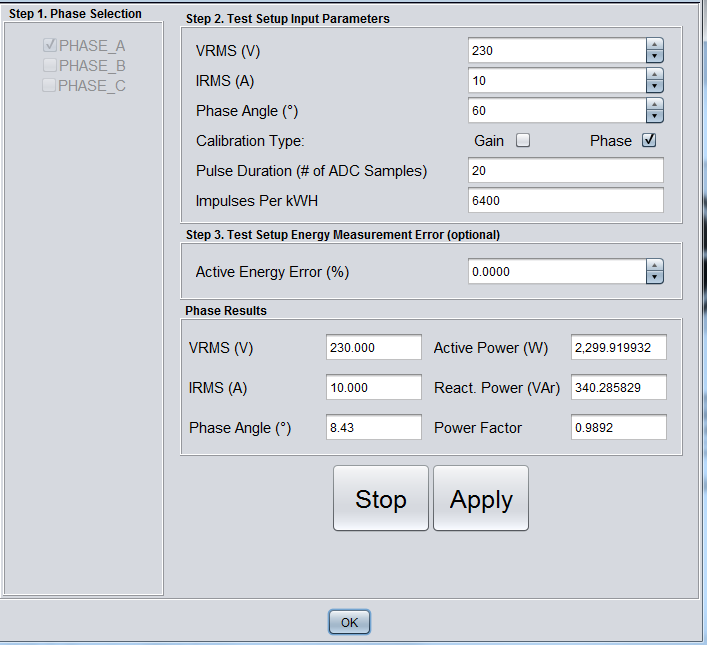
Fig. 63 Phase A Phase Calibration Complete
Enter the test equipment error. (optional)
Click on Apply to calibrate the target’s current ADC channel preload values. When the calibration values have been sent to the target a Phase Calibration Window message will appear.
Fig. 64 Phase A Phase Calibration Complete
Saving Calibration Values to Flash Memory
Once calibration is complete click on the “Stop” button. A message will appear as shown below to store the calibration values in Flash. If “Yes” is selected, the values will be saved to INFO A and will remain on the target after a power reset. Otherwise, the previously used calibration values will remain the same.
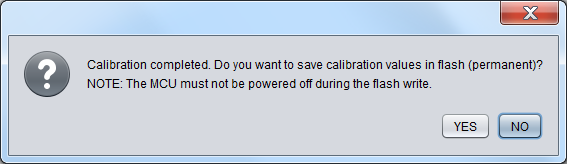
Fig. 65 Save Calibration Values
Repeat the previous calibration process for the remaining phases.
User’s Guide
Design Center GUI Panels
The Design Center GUI consists of three main panels:
Menu bar
Object selection tabs
Design canvas
Fig. 67 Design Center GUI

Object Selection Tabs
The object selection tabs display objects that can be selected for placement in the design canvas and include:
Sensors and controller tab
Miscellaneous tab
Sensors and Controller Selection Tab
The sensors and controller selection tab includes two object types:
Sensor Objects
Voltage Sensor
Current Sensors
Current Transformer (CT)
Rogowski Coil (RC)
Shunt
MSP430 Controller Object
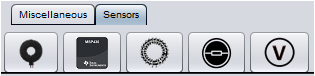
Fig. 69 Sensors and Controller Selection Tab
Miscellaneous Selection Tab
The Miscellaneous selection tab includes only the Comment object type.
Fig. 70 Miscellaneous Selection Tab
Comments can be added by clicking the “/*” icon. Place the comment object by clicking on the design canvas. Double-click the comment object to open the Comment properties window. Enter text and click “OK” to continue.
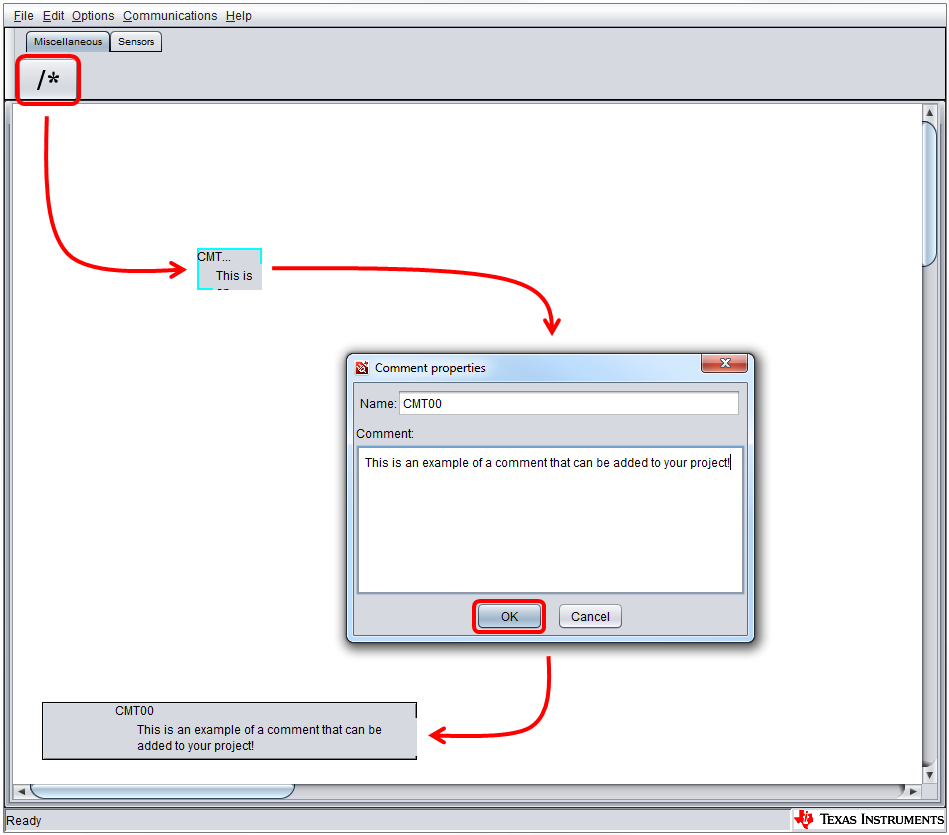
Fig. 71 Add a Comment to Design Canvas (optional)
Design Canvas
To place an object in the design canvas:
Select an object from the object tab with the left mouse button
Position the cursor in the design canvas area and place the object by clicking the left mouse button
Objects may be selected and moved anywhere on the canvas. Additional object operations can be displayed by right-clicking the mouse button on the object. To display the properties and configure the object, double-click using the left mouse button.
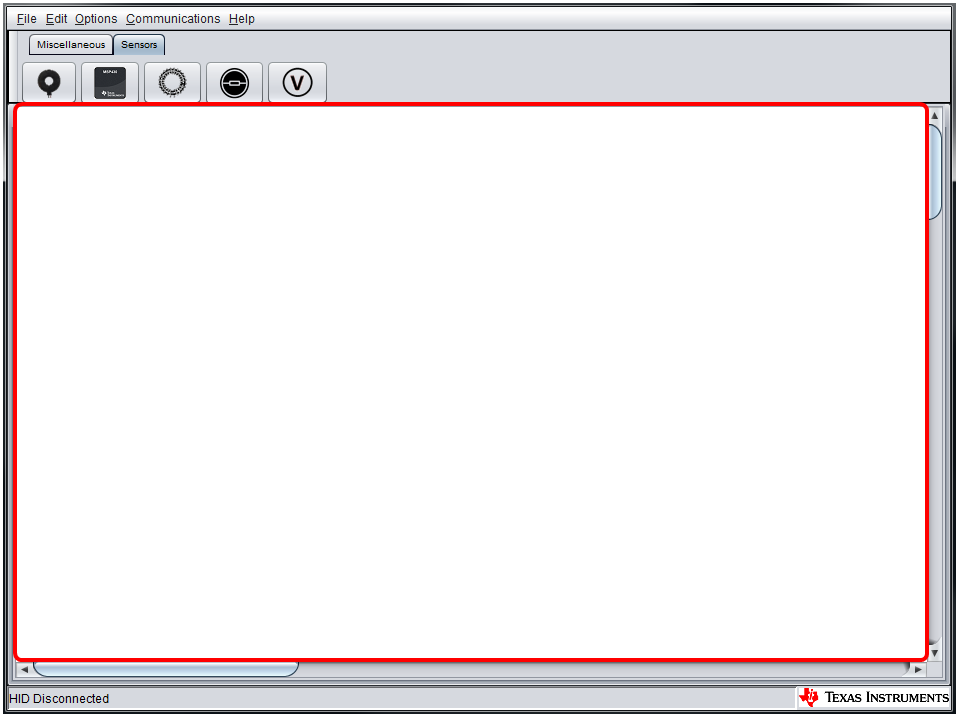
Fig. 72 Design Canvas
Design Center Menu Descriptions
File Menu
This menu provides selections for projects, workspaces, printing, and exiting.
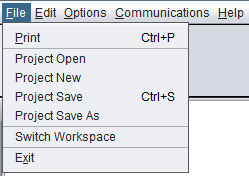
Fig. 73 File Menu
Print
Allows the user to print window.
Project Open / Save / Save As
Allows the user to:
Open a new or existing project in the current workspace
Save the current project
Save the current project as a different name
Fig. 74 Select Project Name Window
Switch Workspace
Design Center stores projects within a workspace directory. This menu allows the user to open a different workspace. This behavior is similar to the way TI Code Composer Studio uses workspaces and projects.
The default workspace path is %USERPROFILE%/EnergyMeasurementDesignCenter/EnergyMeasurementDesignCenterWorkspace.
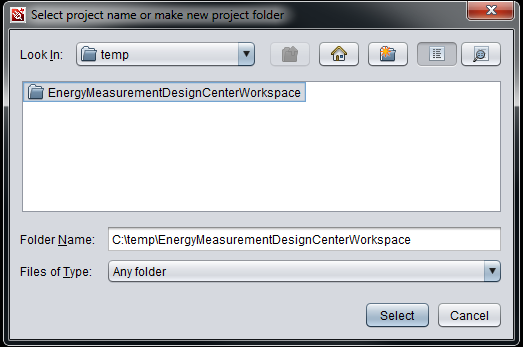
Fig. 75 Select Workspace Window
Exit
Exit the Energy Measurement Design Center application.
Edit Menu
This menu provides options for deleting or restoring one or more selected objects. For example, if the canvas is populated with multiple sensors, to clear the canvas simply select all, then cut (delete).
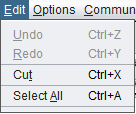
Fig. 76 Edit Menu
Undo / Redo
Undo or redo a previous edit menu operation.
Cut
Remove the selected object from the design canvas.
Select All
Select all the objects in the design canvas.
Communications Menu
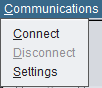
Fig. 79 Communications Menu
Connect / Disconnect
Controls whether the Design Center communicates with the target over HID.
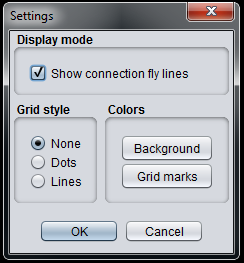
Settings
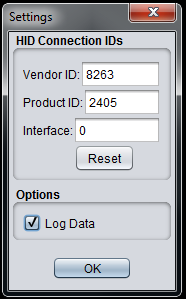
Fig. 80 Settings Window
HID Connection IDs
Enables the user to change the HID connection parameters.
NOTE The parameters default to the correct values for the supported EVMs.
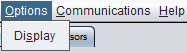
Options
Clicking the “Log Data” checkbox will enable data logging and will allow the selected results to be logged to *.csv files automatically and generated in the project’s directory.
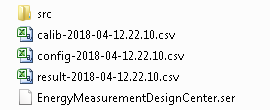
Fig. 81 CSV Log Files
After “Log Data” has been enabled under “Options”, use “Connect” and “Disconnect” under the “Communications” menu to collect and append data to the log files.
NOTE Disabling then re-enabling “Log Data” will create new log files.
Help Menu
This menu provides access to the Energy Measurement Design Center documentation and software version.
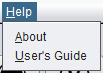
Fig. 82 Help Menu
About
Displays the software version information.
Fig. 83 Design Center Version Information Tab
Displays your system information.
Fig. 84 System Information Tab
User’s Guide
Opens the Energy Measurement Design Center User’s Guide.
Design Center Object Properties
Controller Properties
This section discusses how to configure the controller. Double-clicking on the controller object will open its properties window.
Fig. 85 Controller Object
The properties window allows the user to:
Select a supported device
Configure basic and advanced library parameters
Check for configuration errors
Generate source code
Enable target communication
Perform calibration
View results
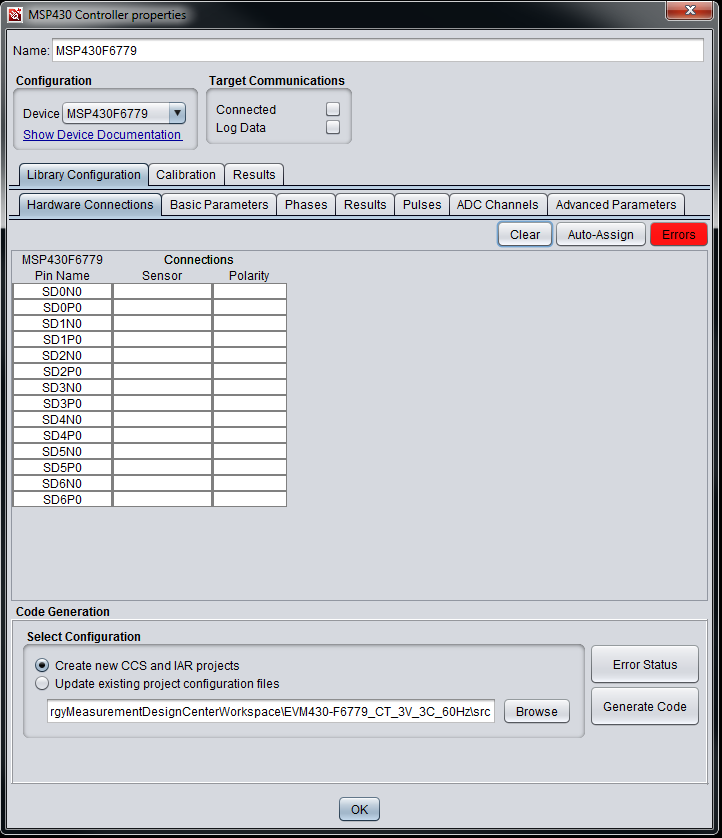
Fig. 86 Controller Properties Window
Select a supported device
If the MSP430 controller has been placed on the design canvas, you have already selected a device from the “Device Selection” window. To choose a different device, select one from the “Device” drop-down menu. Click the “Show Device Documentation” link to open the selected device’s Product page on TI.com.
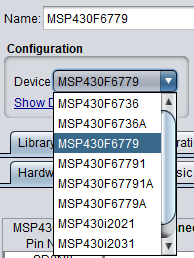
Fig. 87 Select a Device
Configure Basic and Advanced Library parameters
Hardware Connections
There are three ways to map the ADC channel pins of the controller to the sensor pins:
Automatically map all the connections using the “Auto-Assign” button
Manually map the connections using the “Connections” table
Graphically connect the sensor and controller pins on the objects in the design canvas
After selecting and placing the controller in the design canvas, each sensor is connected automatically according to the placement order. In this case, the connections most likely will not match the connections on the EVM or your design. Easily disconnect all the sensors by clicking the “Clear” button.
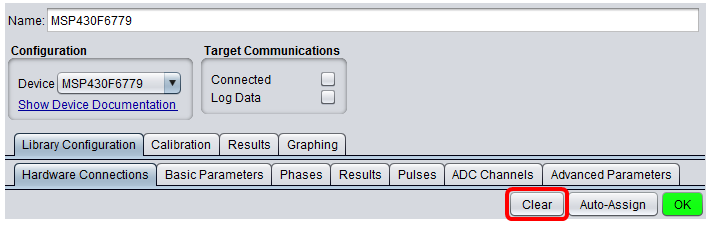
Fig. 88 Clear Button
Automatic Connections
If the “Auto-Assign” button is clicked, the Design Center will automatically (randomly) connect all of the unconnected sensor pins to the controller pins. This is a good option if there are no pre-existing restrictions on the connections. For example, if the connections are already defined by the EVM or your design, map the connections manually or graphically.
Note that any existing connections will not be changed. In this case, it is possible to make one of the two polarity connections per sensor manually and then auto-assign the rest.
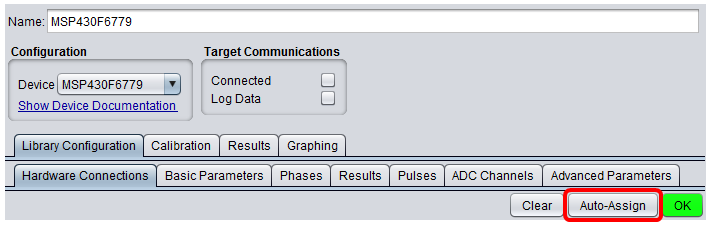
Fig. 89 Auto-Assign Button
The red “Errors” button indicates that the assignments did not complete successfully.
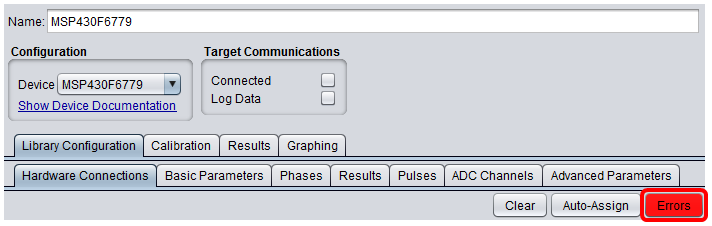
Fig. 90 Errors Button
Clicking on the button will open the connections “Error” window listing the remaining errors.
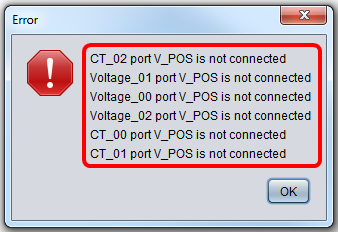
Fig. 91 Connection Error Window
If the assignments complete successfully, the red “Errors” button will turn into a green “OK” button indicating no assignment errors. Note that this also applies to manual and graphical connections.
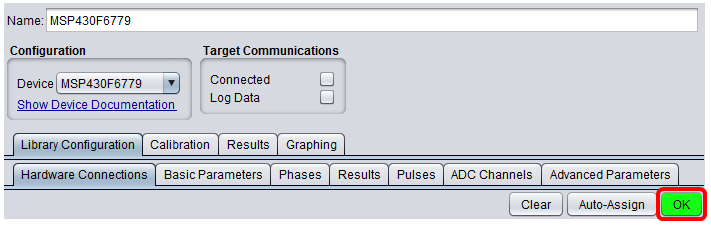
Fig. 92 OK Button
Manual Connections
The “Connections” table enables detailed manual control for mapping the sensor pins to the controller pins. There are three columns:
Pin Name column
Sensor column
Polarity
Pin Name column
This column lists the selected controller’s Sigma Delta ADC channels. Note that a channel is a pair of positive and negative pins. The pin names match the selected controller’s datasheet. Note that the data in this column is read-only.
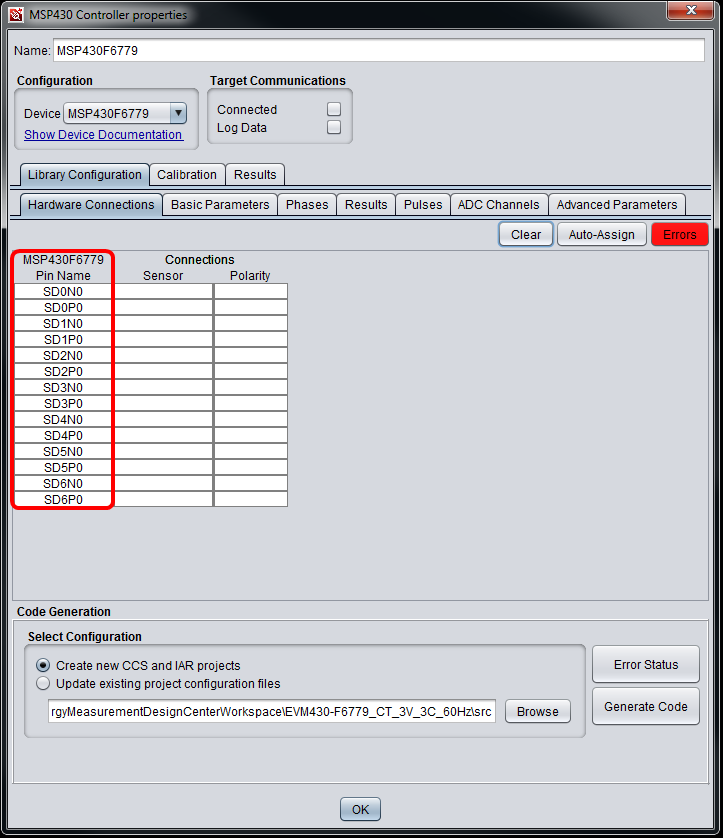
Fig. 93 Pin Name Column
Sensor column
This column lists any placed sensors that have been connected.
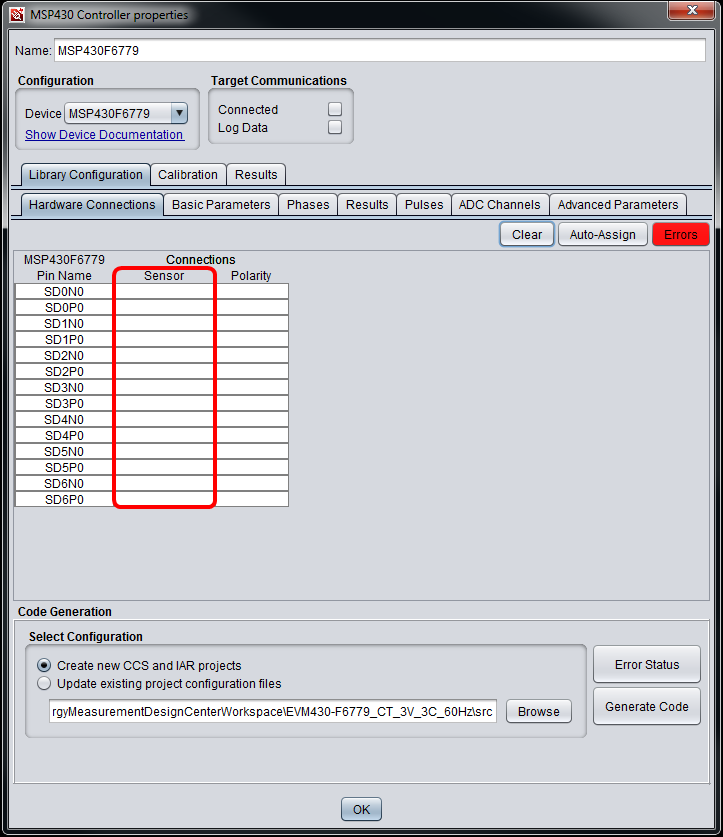
Fig. 94 Sensor Column
Start by clicking a cell in the Sensor column and selecting a voltage or current sensor from the drop-down menu. Before moving to another cell in the Sensor column, click the neighboring cell in the Polarity column and select the polarity. Select only one sensor per channel.
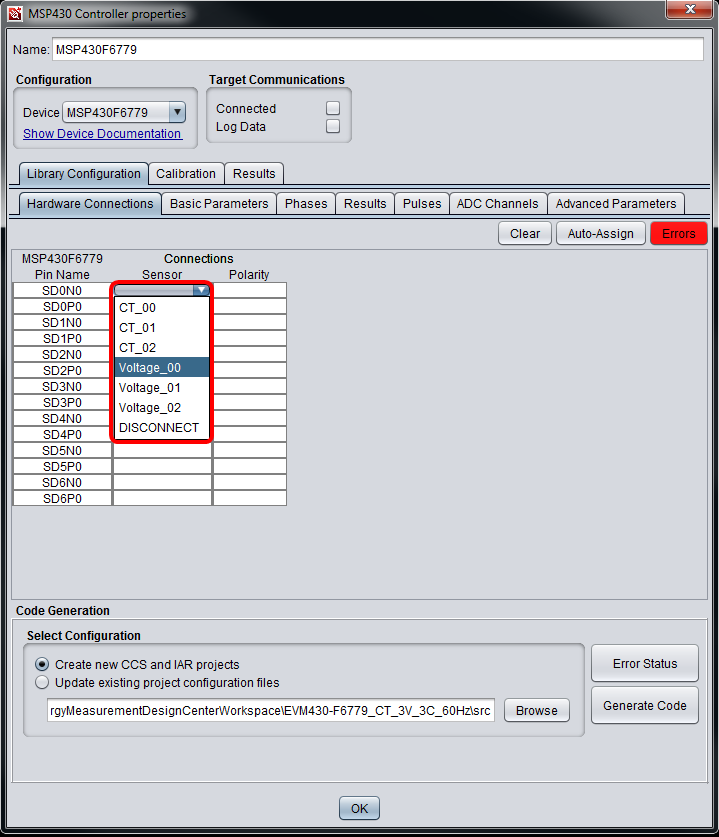
Fig. 95 Drop-down Menu in Sensor Column
Polarity column
This column lists the polarities of the connected sensors.
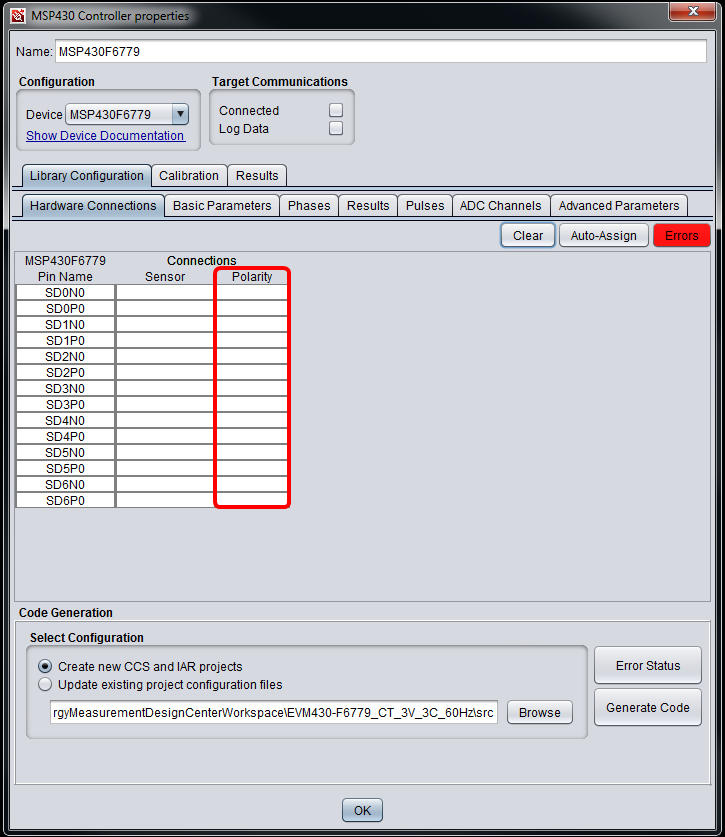
Fig. 96 Polarity Column
After selecting a sensor in the Sensor column, click the neighboring cell in the Polarity column and select “V NEG” or “V POS” from the drop-down menu. Note that the sensor polarities should match the ADC channel polarities.
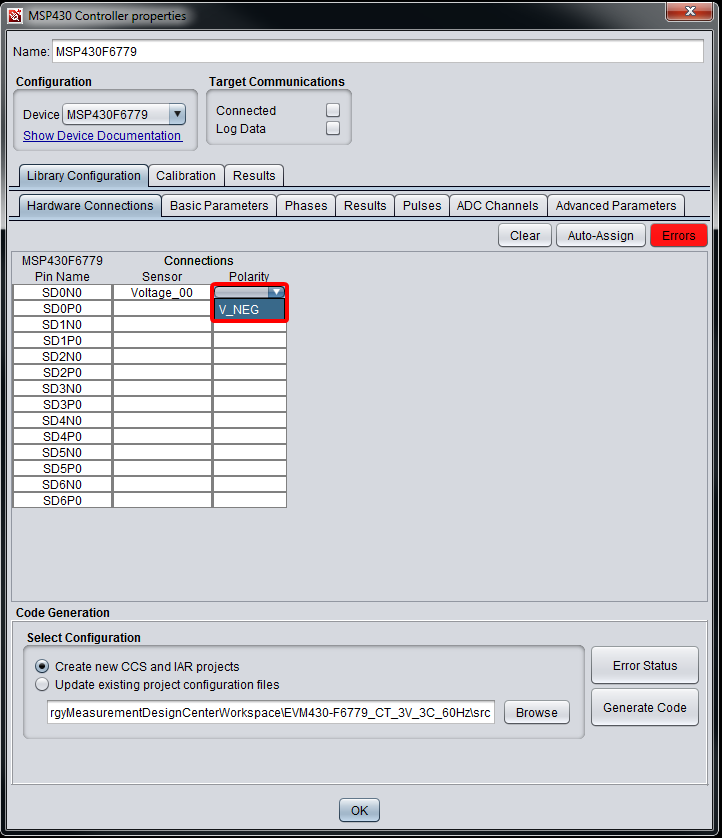
Fig. 97 Drop-down Menu in Polarity Column
Graphical Connections
Connections between the controller and sensors can be made by clicking a sensor pin and dragging the connection to the desired controller pin.
NOTE Be sure to display the connection fly lines first using the “Options” > “Display” menu.
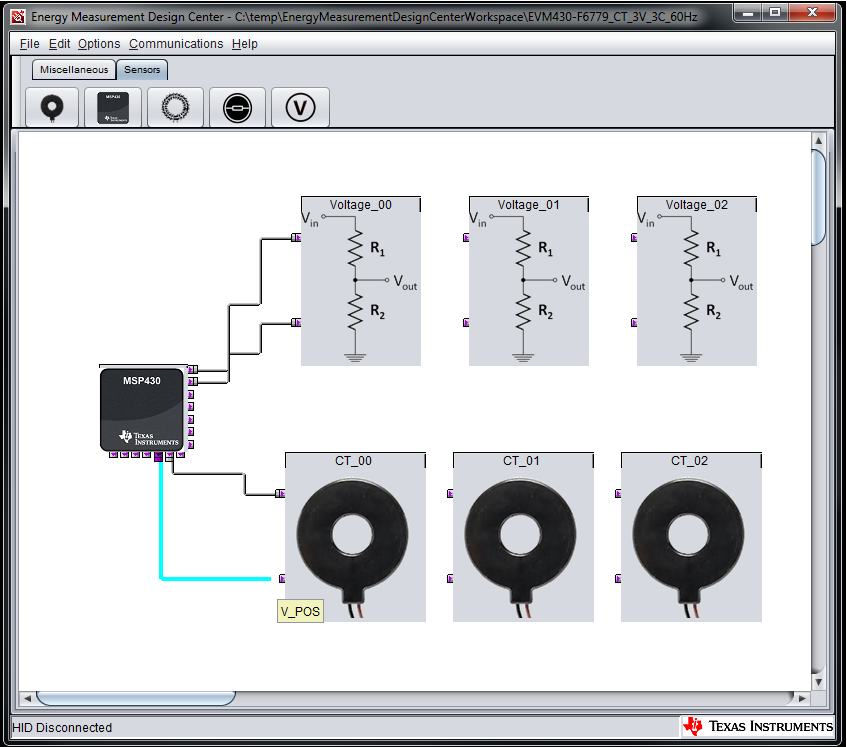
Fig. 98 Graphical Connections on Design Canvas
The graphical connections are still shown in the “Connections” table.
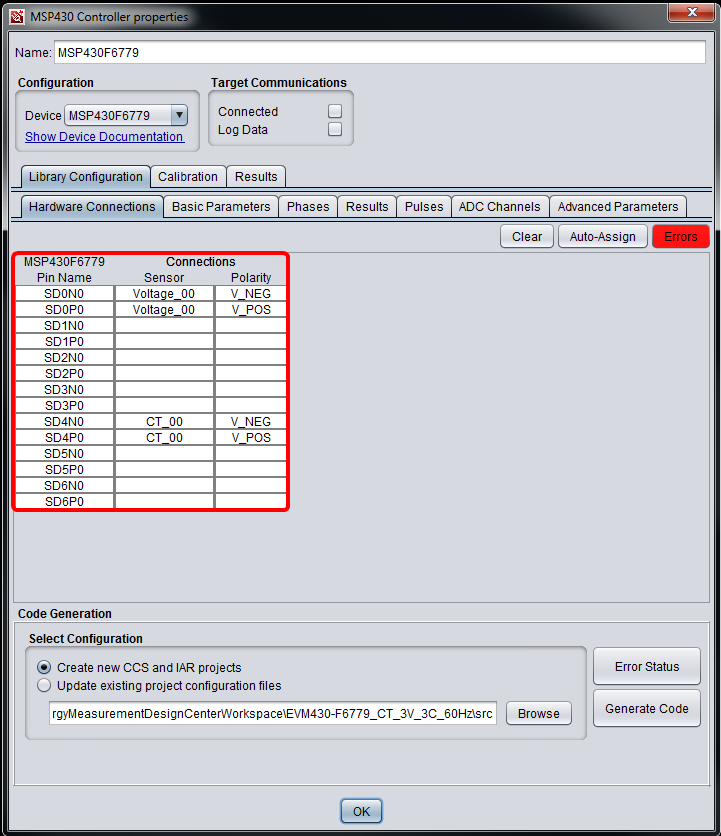
Fig. 99 Graphical Connections in Connections Table
Basic Parameters
Configure the basic library parameters in the Basic Parameters tab:
Meter Name
Sampling Frequency
Oversampling Rate
SMCLK Frequency
AC Mains Frequency
Number of Voltage Sensors
Number of Current Sensors
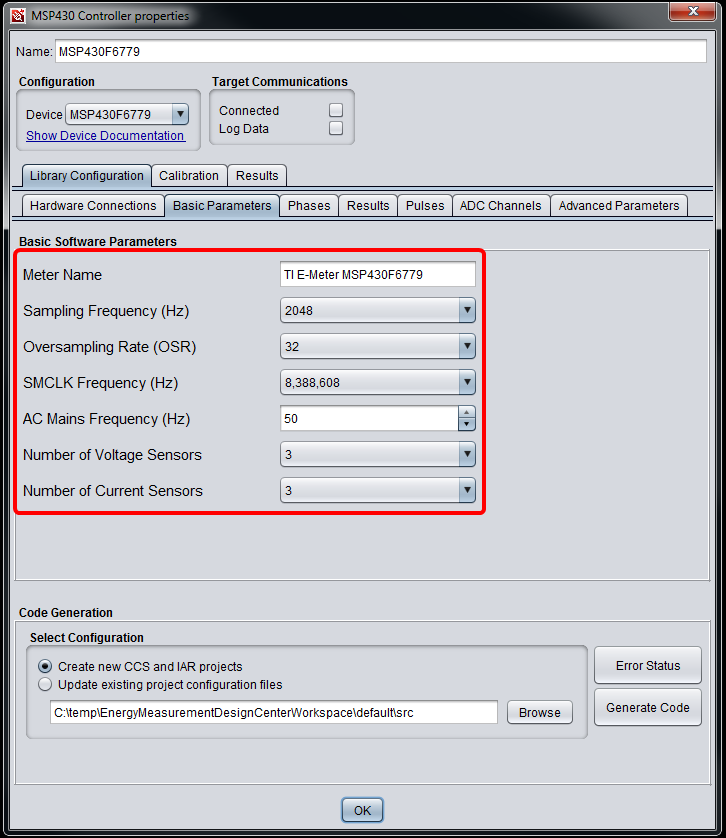
Fig. 100 Graphical Connections in Connections Table
Meter Name
If desired, change the default meter name by entering a new name (such as “EVM430-F6779”) in the text box.
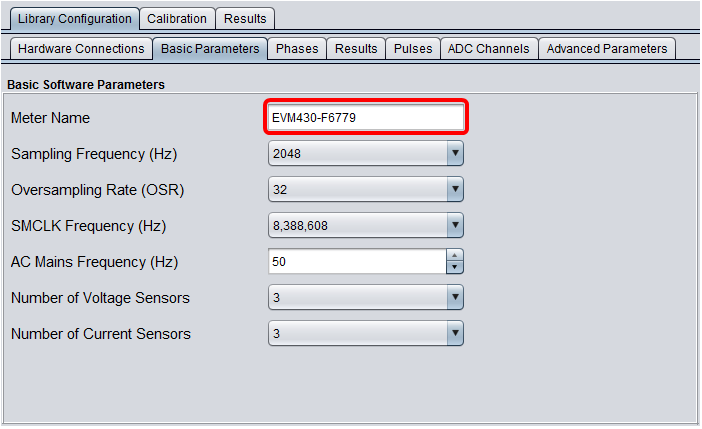
Fig. 101 Updated Meter Name
Sampling Frequency
Select a supported sampling frequency from the drop-down menu. Note that the sampling frequency is equal to the ADC modulation frequency (not shown but configured automatically) divided by the Oversampling Rate (OSR).
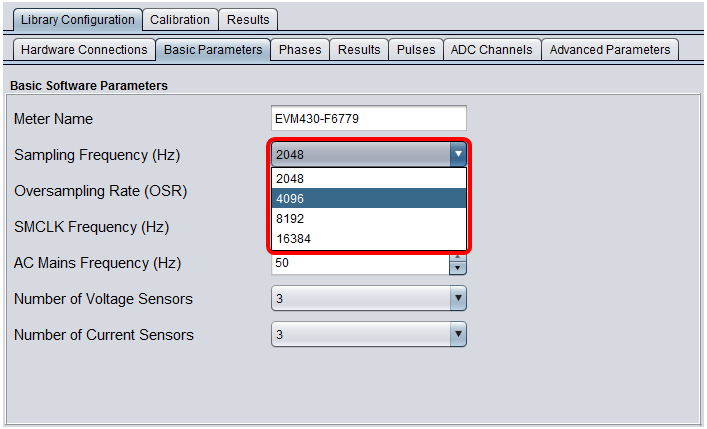
Fig. 102 Select a Sampling Frequency
The supported sampling frequencies depend on the selected controller. For example, MSP430F67xx controllers feature a variable modulation frequency that supports multiple OSRs for each sampling frequency. MSP430i20xx controllers feature a fixed modulation frequency that supports a single OSR for each sampling frequency. When this parameter is updated, the OSR will also be updated.
NOTE Increasing the sampling frequency reduces the available CPU bandwidth.
Oversampling Rate (OSR)
Select a supported OSR from the drop-down menu. Note that the OSR is equal to the ADC modulation frequency (not shown but configured automatically) divided by the sampling frequency.
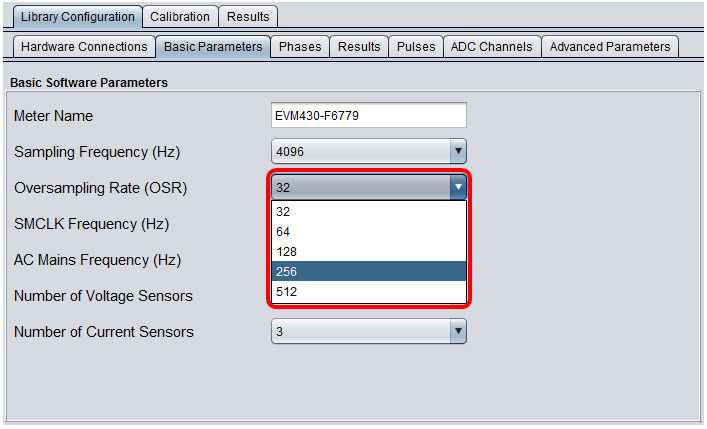
Fig. 103 Select an OSR
The supported OSRs depend on the selected controller. For example, MSP430F67xx controllers feature a variable modulation frequency that supports multiple OSRs for each sampling frequency. MSP430i20xx controllers feature a fixed modulation frequency that supports a single OSR for each sampling frequency.
NOTE Increasing the OSR increases the ADC sample resolution but may decrease the sampling frequency for some devices.
SMCLK Frequency
Select a supported SMCLK (Sub-Main Clock) frequency using the drop-down menu. OSR is equal to the ADC modulation frequency (not shown but configured automatically) divided by the sampling frequency.
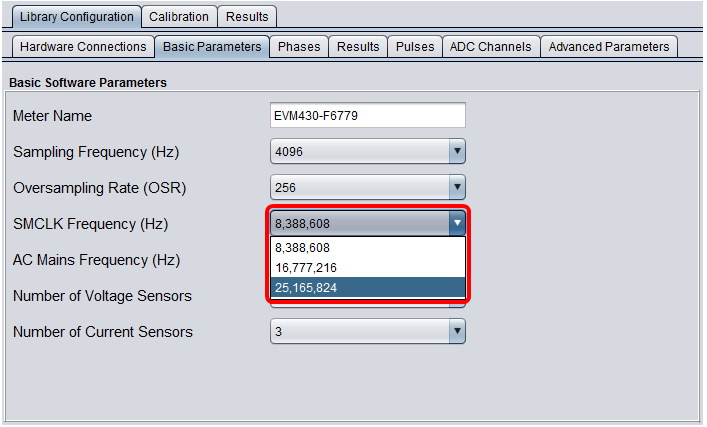
Fig. 104 Select an SMCLK Frequency
The supported SMCLK frequencies depend on the selected controller. For example, MSP430F67xx controllers feature a variable SMCLK frequency whereas the MSP430i20xx controllers feature a fixed SMCLK frequency.
NOTE Both SMCLK and MCLK are configured according to the selected frequency. MCLK can be manually changed in the code but must be equal or greater than the SMCLK frequency.
AC Mains Frequency
Choose a nominal AC mains frequency between 40 and 70 Hertz (Hz) by entering a value in the text box or using the up and down arrows. Note that this frequency influences some default parameters in the Advanced Parameters tab.
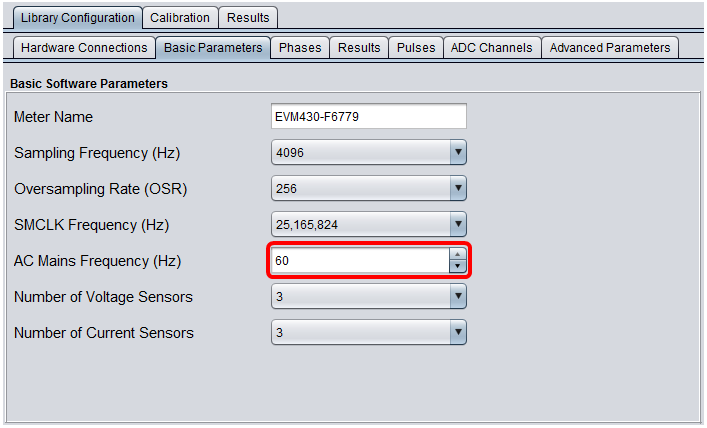
Fig. 105 Select an AC Mains Frequency
Number of Voltage Sensors
The default selection equals the total number of connected voltage sensors. If desired, select a sub-set. This feature allows users to easily debug individual phases in a poly-phase system configuration.
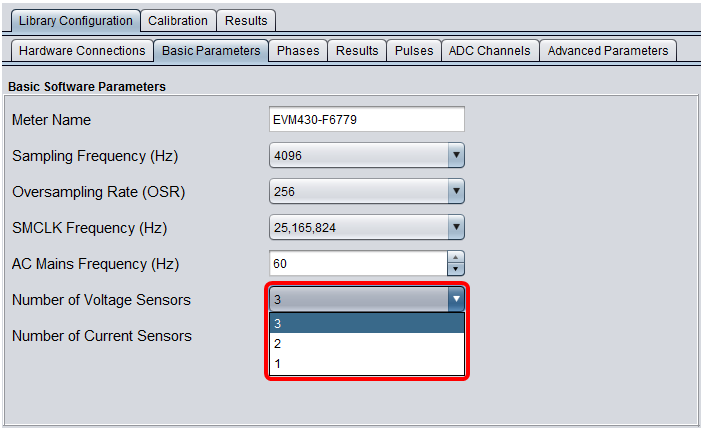
Fig. 106 Select the Number of Voltage Sensors
Number of Current Sensors
The default selection equals the total number of connected current sensors. If desired, select a sub-set. This feature allows users to easily debug individual phases in a poly-phase system configuration.
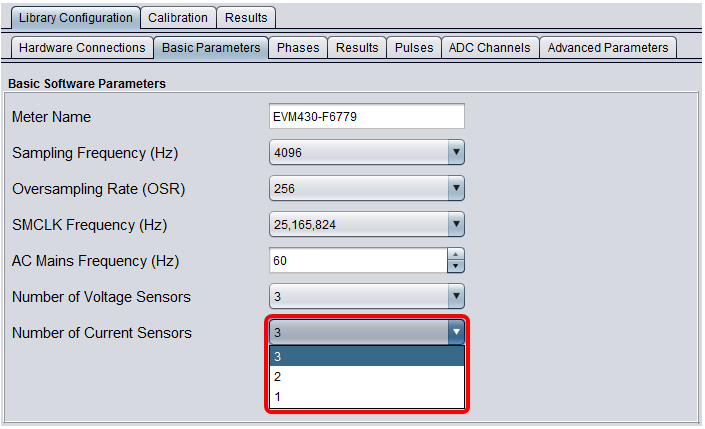
Fig. 107 Select the Number of Current Sensors
Phases
Configure the phase parameters in the Phases tab:
Phase Name column
ADC Voltage Channel column
ADC Current Channel column
Total column
Phase Name column
Select a different phase name from the drop-down menu for each pair of voltage and current ADC channels. These names allow the phases to be easily distinguished when calibrating, communicating, and viewing results. If the system configuration requires neutral monitoring, choose “NEUTRAL” as one of the phase names from the drop-down menu. Note that the number of available phase names depends on the number of voltage and current sensors selected in the “Basic Parameters” tab.
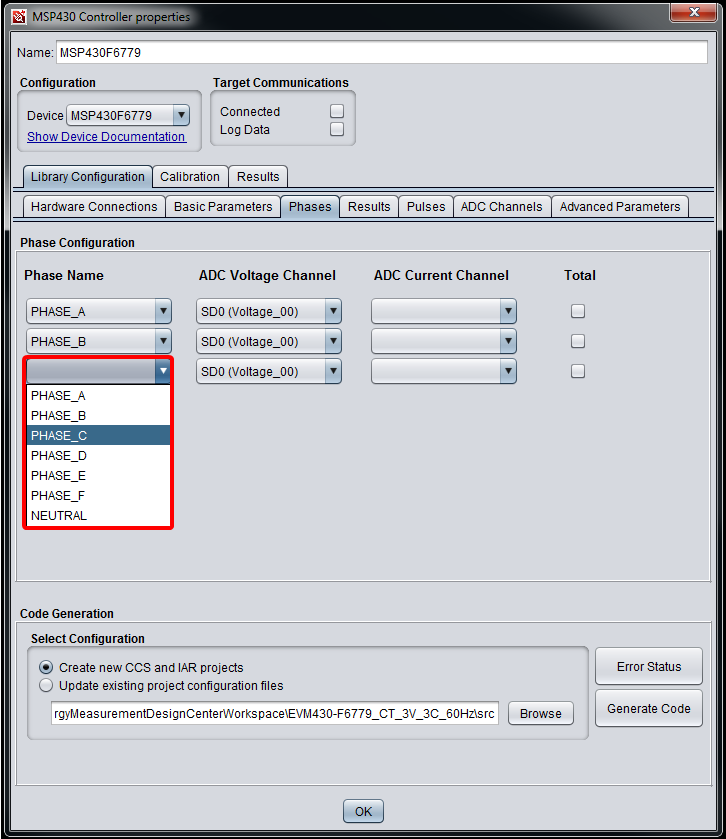
Fig. 108 Select Phase Names
ADC Voltage Channel column
Select a voltage channel from the drop-down menu. If the system configuration requires a single voltage channel with multiple current channels, select the same voltage channel (voltage sensor) for the current channels. Note that the available voltage channels depend on the connected sensors in the “Hardware Connections” tab.
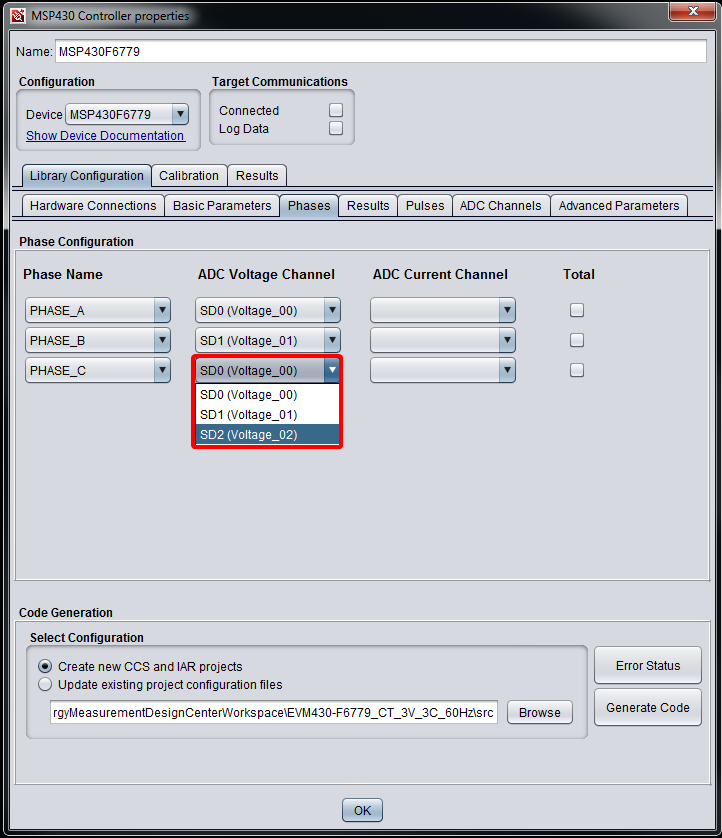
Fig. 109 Select ADC Voltage Channels
ADC Current Channel column
Select a current channel from the drop-down menu. Note that the available current channels depend on the connected sensors in the “Hardware Connections” tab.
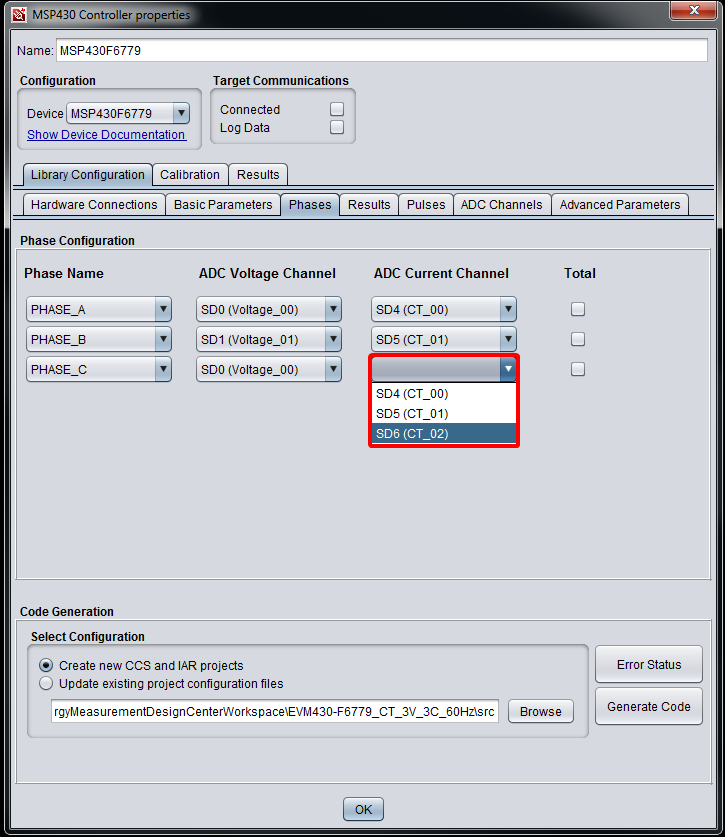
Fig. 110 Select ADC Current Channels
Total column
Add each phase to the total (aggregate) by selecting its checkbox under the “Total” column.
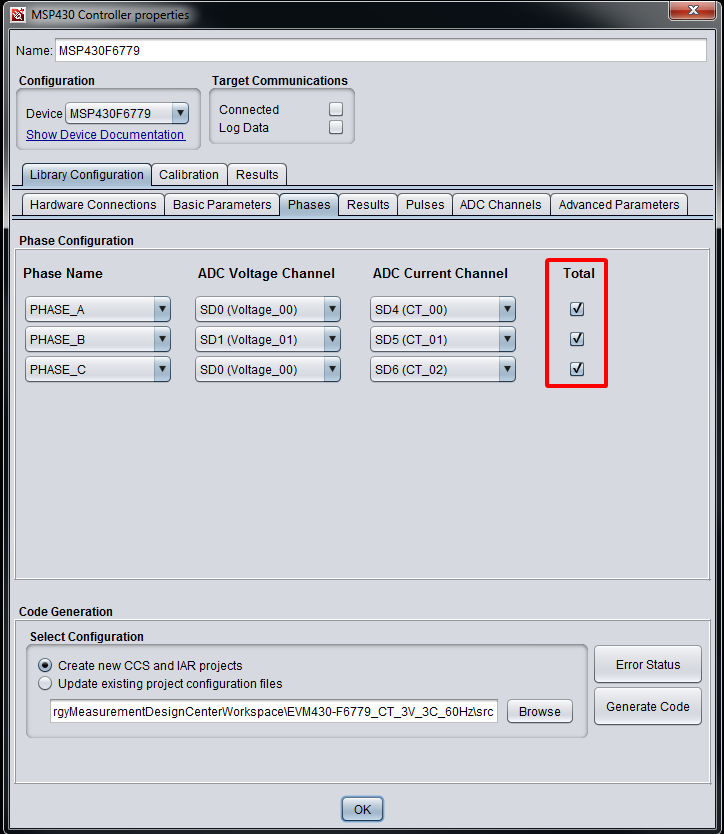
Fig. 111 Select Totals
Results
Select the supported results according to your system requirements and view the estimated CPU bandwidth in the “Results” tab.
VRMS
IRMS
V Peak
I Peak
Power Factor
Frequency
Active Power
Reactive Power
Apparent Power
Active Energy
Reactive Energy
Apparent Energy
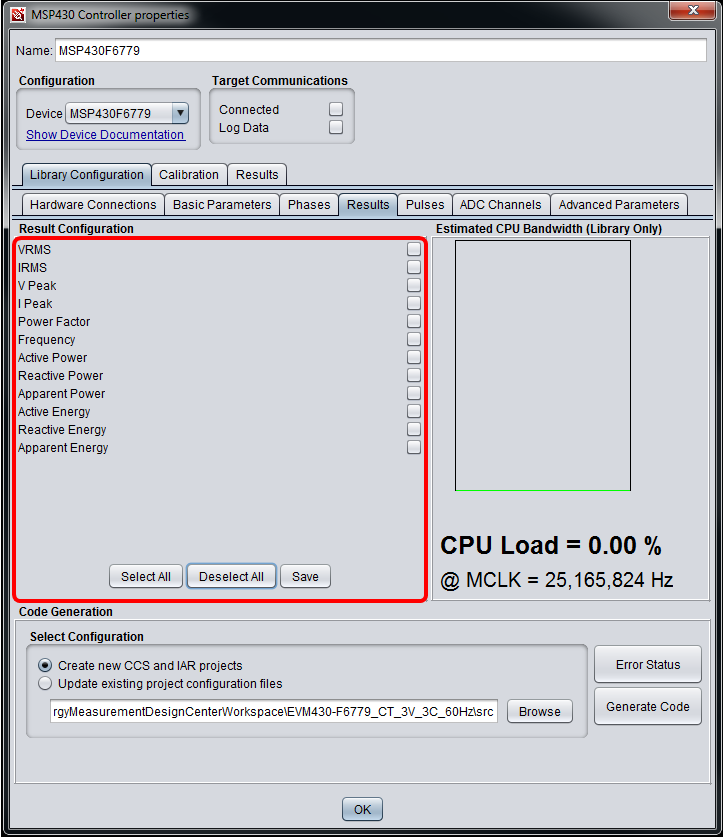
Fig. 112 Results Configuration Section
Easily select or deselect all the results by clicking the “Select All” or “Deselect All” buttons in the “Result Configuration” section.
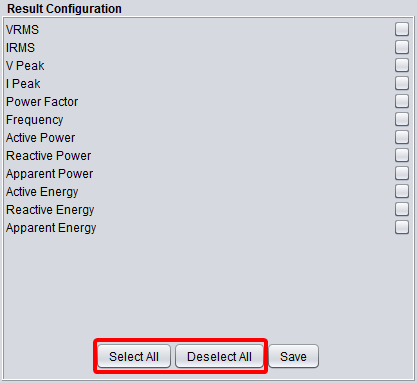
Fig. 113 Select All and Deselect All Results Buttons
Manually select or deselect results using the checkboxes. Hover the cursor over a checkbox to quickly see its result.
NOTE The user must click the “Save” button to both validate dependencies (some results depend on others) and save the selections.
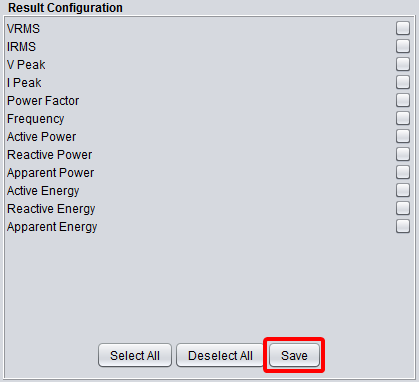
Fig. 114 Save Result Configuration Button
Clicking the “Save” button when the dependencies are not met will display an Error window listing all the dependencies. Click “OK” and enable the other results accordingly.
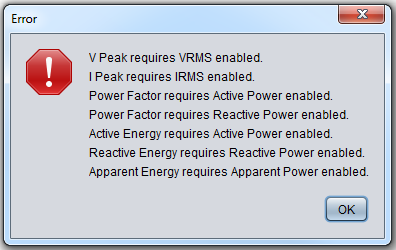
Fig. 115 Dependencies shown in Error Window
Clicking the “Save” button when all dependencies are met will display an Info window confirming the result configuration has been saved successfully.
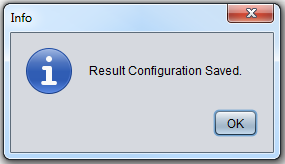
Fig. 116 Result Configuration Saved Window
The bar graph in the “Estimated CPU Bandwidth” section represents the CPU load percentage and changes dynamically based on the selected results. Note that certain results such as reactive power impact the CPU load more than others. Green indicates that the CPU load is less than 100%.
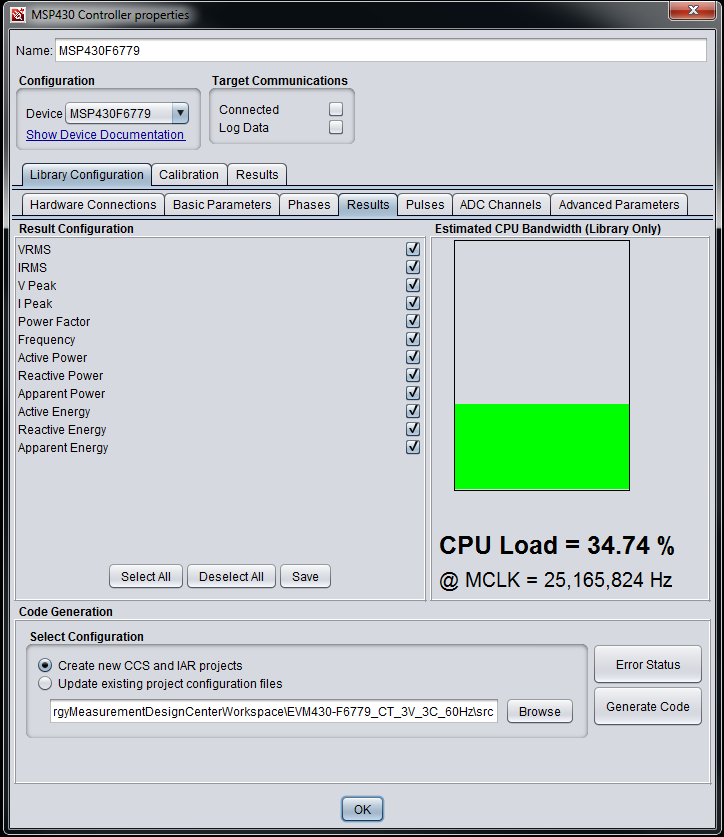
Fig. 117 Estimated CPU Bandwidth below 100%
Red indicates the CPU load exceeds 100%. See the CPU load percentage for the specific amount.
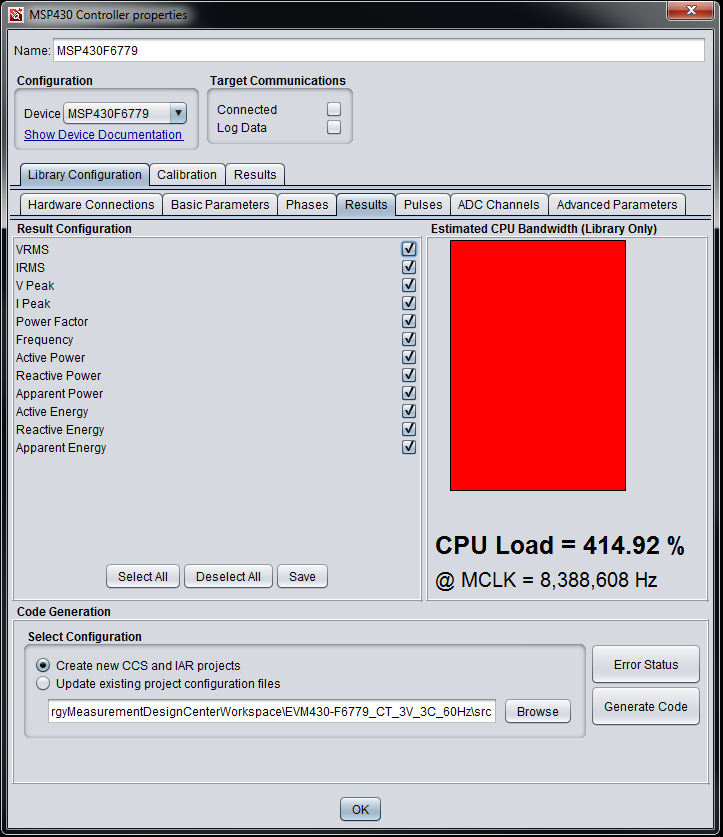
Fig. 118 Estimated CPU Bandwidth above 100%
NOTE MCLK is assumed to be the same frequency as SMCLK.
Parameters that impact the estimated CPU load (and strategies to reduce it) include:
Device selection
Controller (select higher performance device)
Basic Parameters tab
SMCLK Frequency (increase frequency)
Sampling Frequency (lower frequency)
Number of Voltage and Current Sensors (reduce number of phases)
Results tab
Result Configuration (reduce result selections)
Depending on the device and your system configuration, some of these strategies above may not be possible.
NOTE This estimation is based on the cycle count for the selected result APIs and does not include the CPU bandwidth consumed by the application code. Source code will not be generated for CPU loads higher than 100%.
Pulses
If your application does not measure active and reactive energy, this tab can be skipped. These GPIOs can drive LEDs and header pins to output pulses. These pulses are used for measuring accuracy during calibration and indicating active and reactive energy consumption for individual phases and total (aggregate).
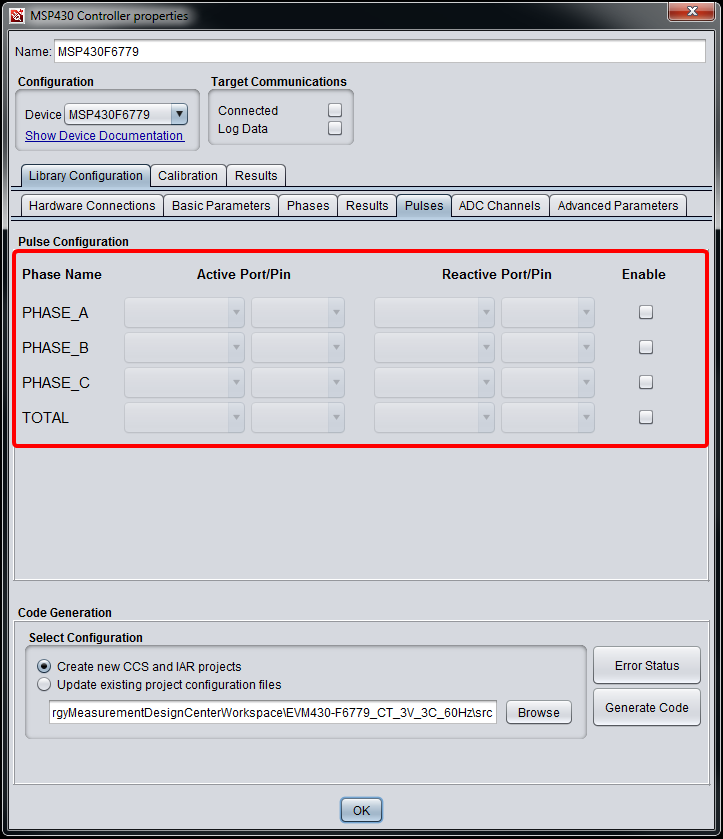
Fig. 119 Pulse Configuration
Enable column
Enable pulses for each phase by clicking the checkbox under the “Enable” column. The pulses can be disabled by deselecting the checkbox even after pins and ports have been selected for that phase.
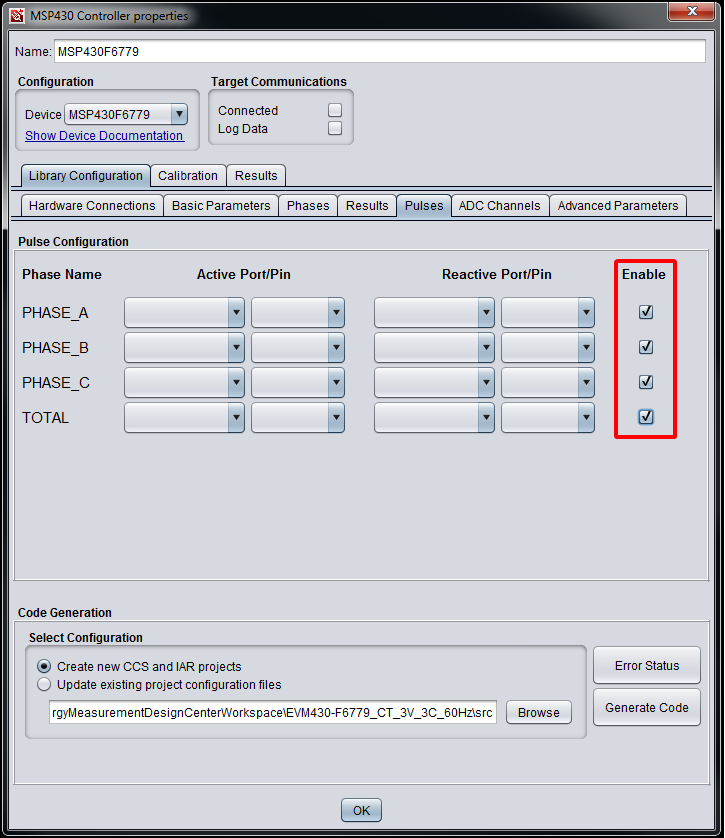
Fig. 120 Enable Pulses per Phase
Active and Reactive Port/Pin columns
The ports are selected using the left drop-down menus, and the pins are selected using the right drop-down menus in each column.
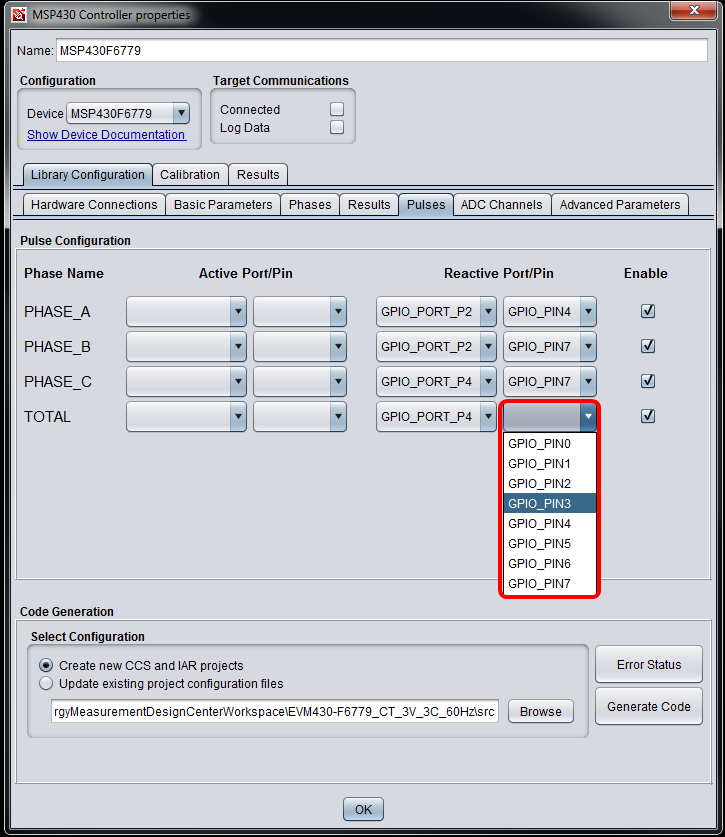
Fig. 121 Select Ports/Pins for Reactive Energy Pulses
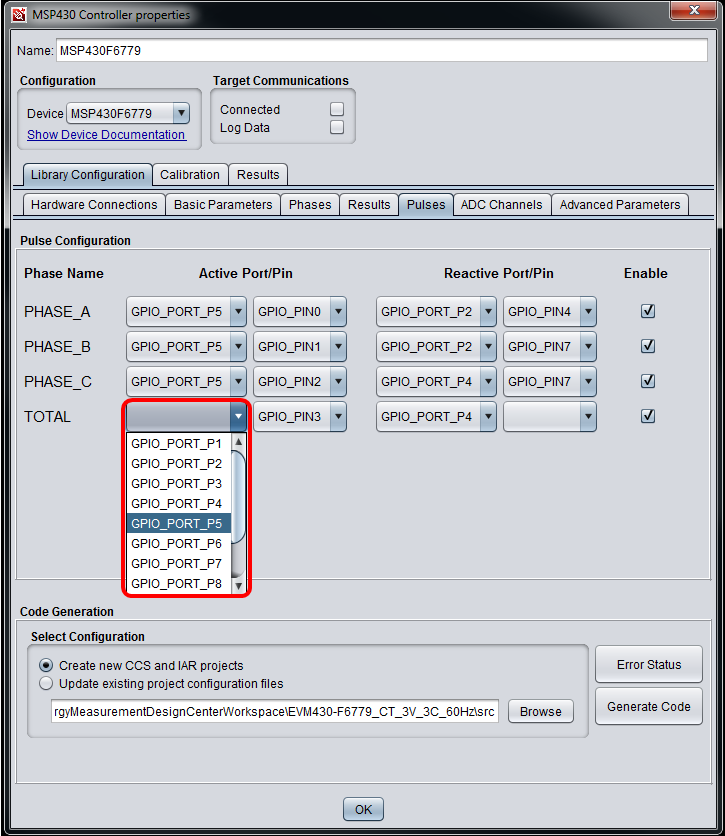
Fig. 122 Select Ports/Pins for Active Energy Pulses
NOTE Duplicate port pins will get detected later, but the user must confirm that the selected GPIOs are supported by the selected device (and its package).
Phase Name column
The phase names are automatically populated with those (including Total if enabled) selected in the “Phases” tab.
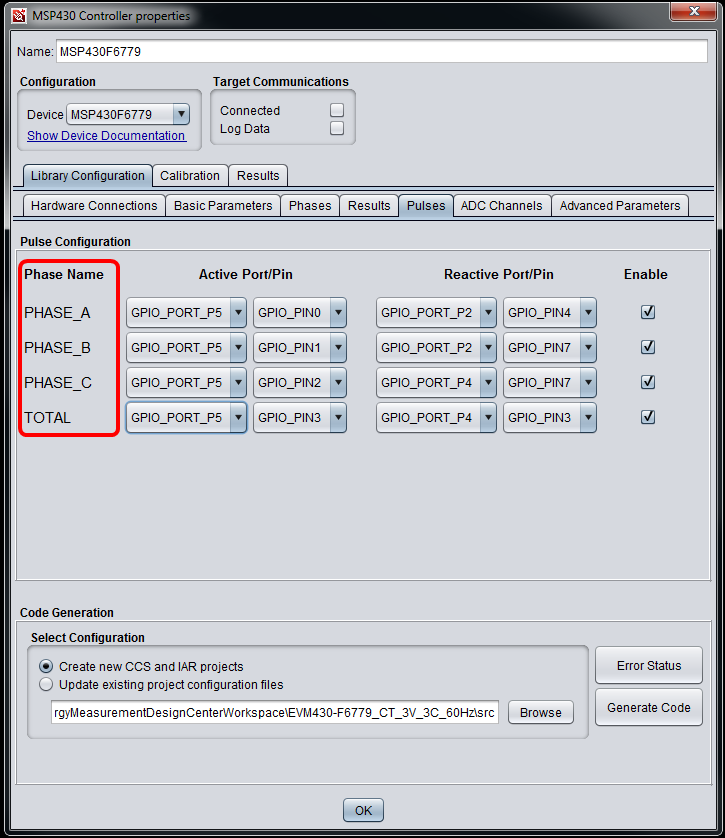
Fig. 123 Phase Names (read-only)
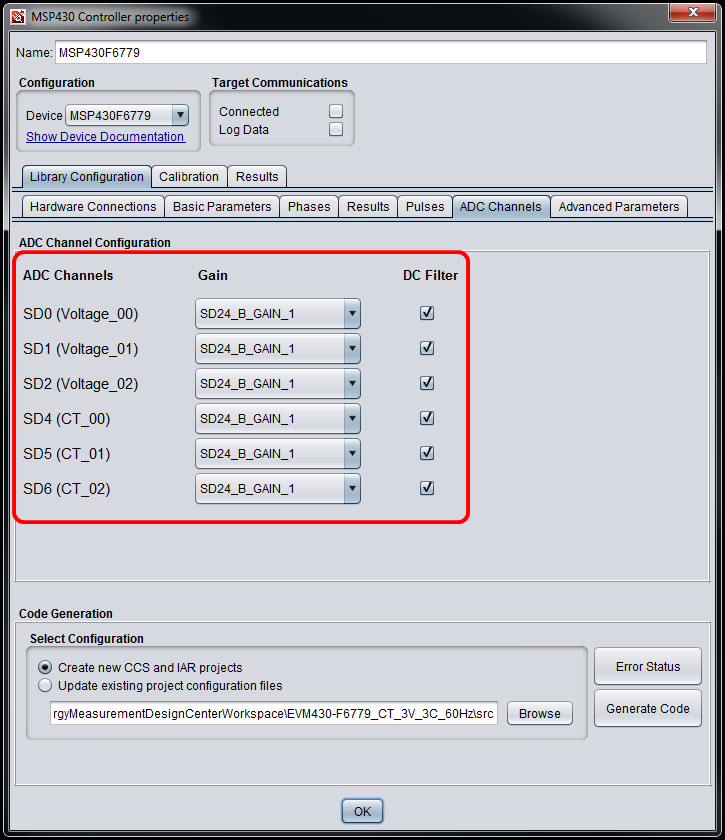
ADC Channels
This tab allows the user to decrease the default ADC gain per channel if the gain is higher than one.
ADC Channels column
The ADC channels and connected sensors are shown in the ADC Channels column and are automatically populated based on the connections in the “Hardware Connections” tab.
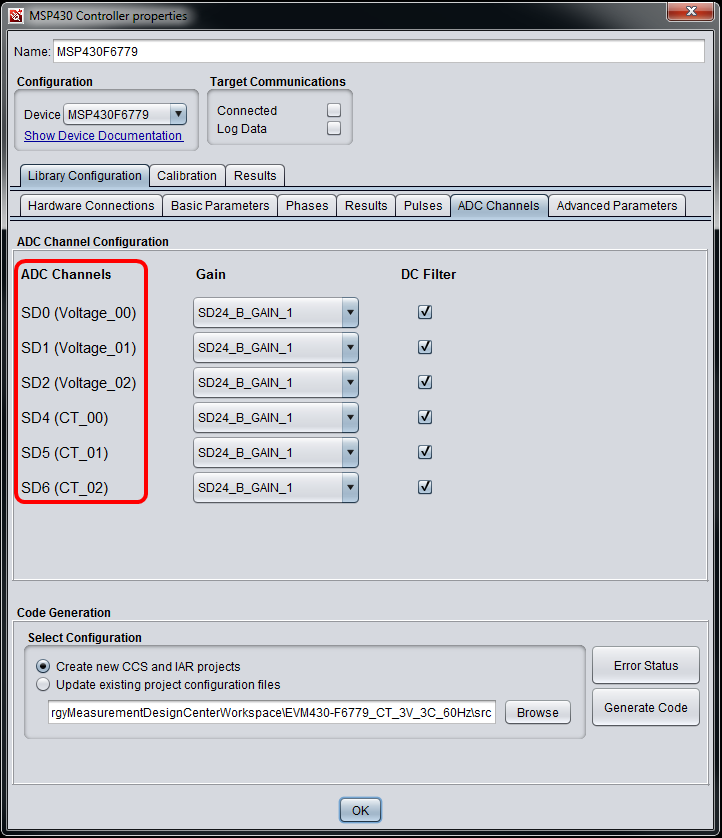
Fig. 124 ADC Channels Column (read-only)
Gain column
The maximum output voltages from each sensor (automatically calculated in the Sensor Properties window) and the typical FSR values (specified in the datasheet for the selected controller) are used to automatically select the default ADC channel gains in this column.
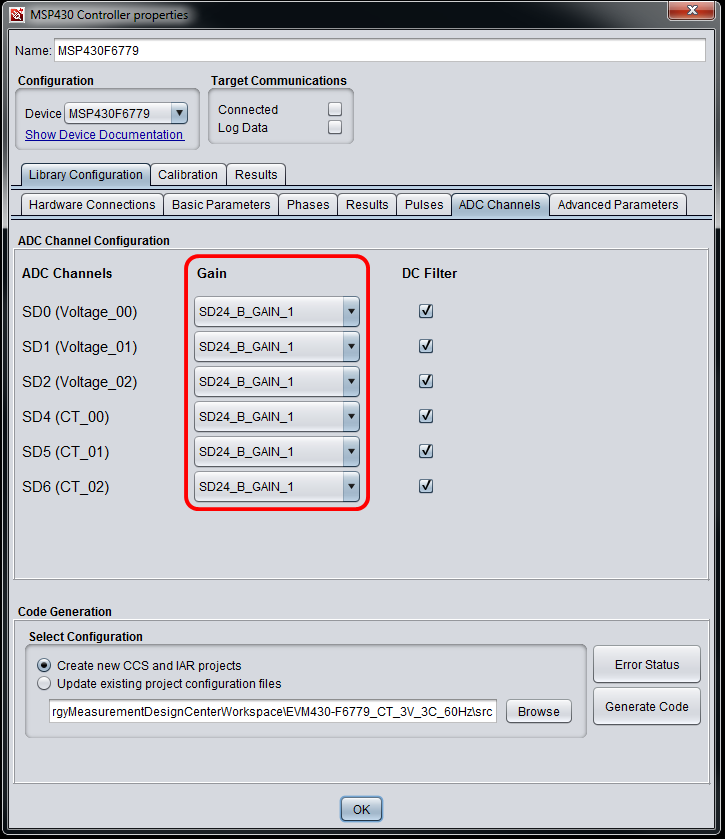
Fig. 125 ADC Gain Column
If the gain is higher than one, the drop-down menus allow users to easily decrease the gain. Lower gains help reject more noise, but some current sensors such as Shunts have very low output voltages that require higher gains to amplify the signal (and unfortunately some noise).
NOTE Some devices support higher gains than others. Refer to the datasheet for more details.
DC Filter column
The DC filters are enabled by default and can be turned off by deselecting the checkbox for each channel. These filters remove any DC offset voltage at the ADC channel inputs.
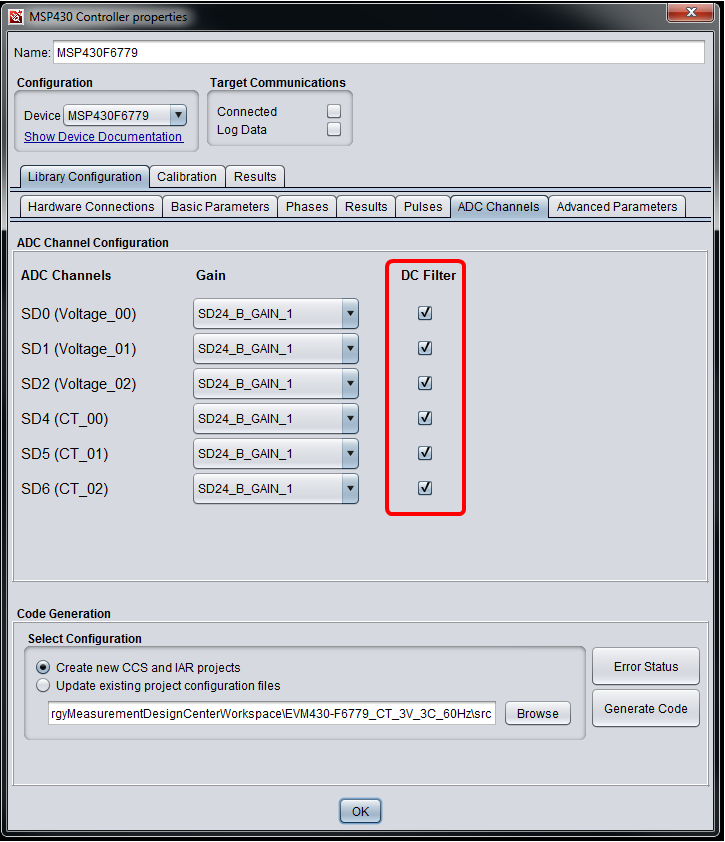
Fig. 126 DC Filter Column
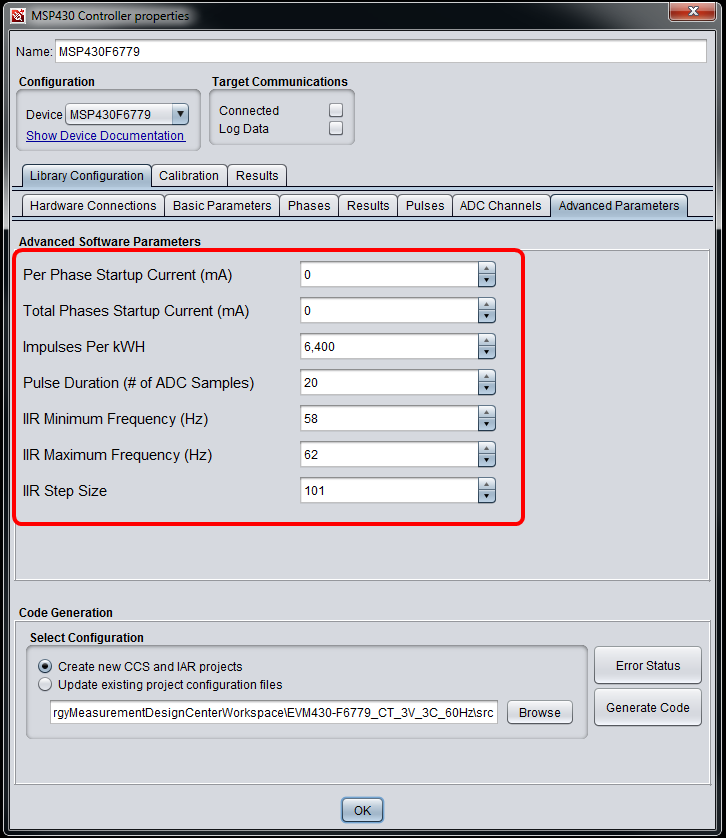
Advanced Parameters
This tab allows user to configure the following advanced library parameters by entering values in the text box or using the up and down arrows:
Per Phase Startup Current
Total Phases Startup Current
Impulses Per kWH
Pulse Duration
IIR Minimum Frequency
IIR Maximum Frequency
IIR Step Size
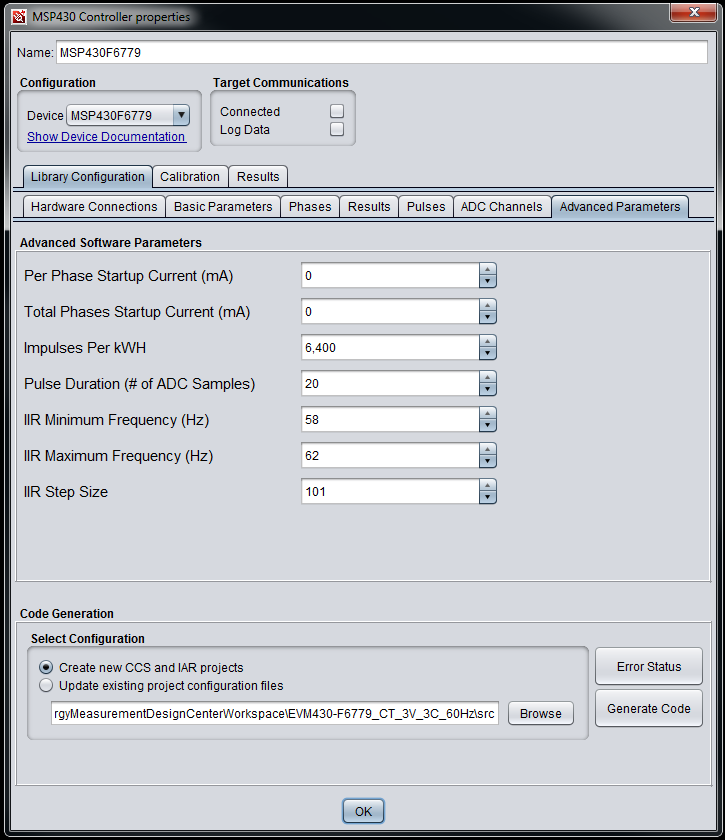
Fig. 127 Advanced Parameter Tab
Per Phase Startup Current
This parameter helps define when energy starts or continues accumulating. This energy threshold is based on both the startup current and the maximum input voltage. The default value equals 0 mA and ensures that energy accumulates at very low currents.
Total Phases Startup Current
This parameter is very similar to the Per Phase Startup Current but configures the total energy threshold instead. The default value equals 0 mA and ensures that energy accumulates at very low currents.
Impulses Per kWH
This parameter defines how many pulses are output after 1 kilowatt hour (kWH) of energy has been measured. Inverting this parameter reveals the kWH per pulse. The default value equals 6400 pulses per kWH, but can be changed.
NOTE If your test equipment accepts energy measurement pulses, configure it with the same number of impulses per kWH. Otherwise, the number of pulses per kWH won’t match affecting the accuracy measurements during calibration and testing.
Pulse Duration
This parameter determines how many ADC samples are used for the pulse duration. The ADC interrupt service routine (ISR) is used to output the pulses rather than using a timer.
The maximum pulse duration can be calculated by using the following parameters: - Maximum Active Power (e.g. 23000 Watt) - Impulses Per kWH (e.g. 6400 impulses per kWH) - Sampling Rate (e.g. 4096 Hz or samples per second)
First, find the maximum possible number of impulses per second based on the maximum active power expected after 1 hour. Take the number of impulses per kWH and divide this value by 3600 seconds to get the number of impulses per kilowatt seconds (kWs). Divide this value by 1000 Watts (W) to get the number of impulses per watt second (Ws). Multiply this value by the maximum active power to get the maximum number of impulses per second. Divide the sampling frequency by this value to get the maximum pulse duration.
For example, if you use the values in the parenthesis above, the maximum pulse duration equals around 100 ADC samples. The default pulse duration equals 20 ADC samples and is five times less than the maximum pulse duration.
IIR Minimum Frequency
This parameter defines the minimum AC mains frequency supported by the IIR filter that calculates reactive power and energy. The default value equals 98% of the AC mains frequency entered in the “Basic Parameters” tab. Note that the minimum frequency must be less than the IIR maximum frequency and greater than or equal to 40 Hz.
IIR Maximum Frequency
This parameter defines the maximum AC mains frequency supported by the IIR filter that calculates reactive power and energy. The default value equals 102% of the AC mains frequency entered in the “Basic Parameters” tab. Note that the maximum frequency must be greater the IIR minimum frequency and less than or equal to 70 Hz.
IIR Step Size
This parameter defines number of steps between the IIR minimum and maximum frequencies. The IIR filter is used to calculate reactive power. The resolution of the IIR constant look-up table is ((IIR Maximum Freq - IIR Minimum Freq )/ (IIR Step-1)). Each step size requires 4 bytes in Flash memory. This value must be greater than 1 and less than or equal to 250. The default values is odd (101) to ensure the AC Mains Frequency is included in the look-up table, which provides the best accuracy for stable high voltage systems. The look-up table will also include the minimum and maximum frequencies.
Software Overview
This section describes the code that is generated by the EMDC GUI for supported MSP430 devices. Before the code is generated, it is automatically configured based on how the controller and senor properties have been configured in the EMDC GUI. After the code is generated, it can be modified the MSP430 MCU can be programmed.
This section does not describe the software library. For more information about that, please refer to the software library API guide.
Application Code
The application code initializes the system and library and then starts the communication and measurement processes. The foreground process repeats approximately every second (or two seconds if no zero crossings are detected on the voltage channels). The background process depends on the ADC sampling rate and repeats based on the number of active ADC channels.
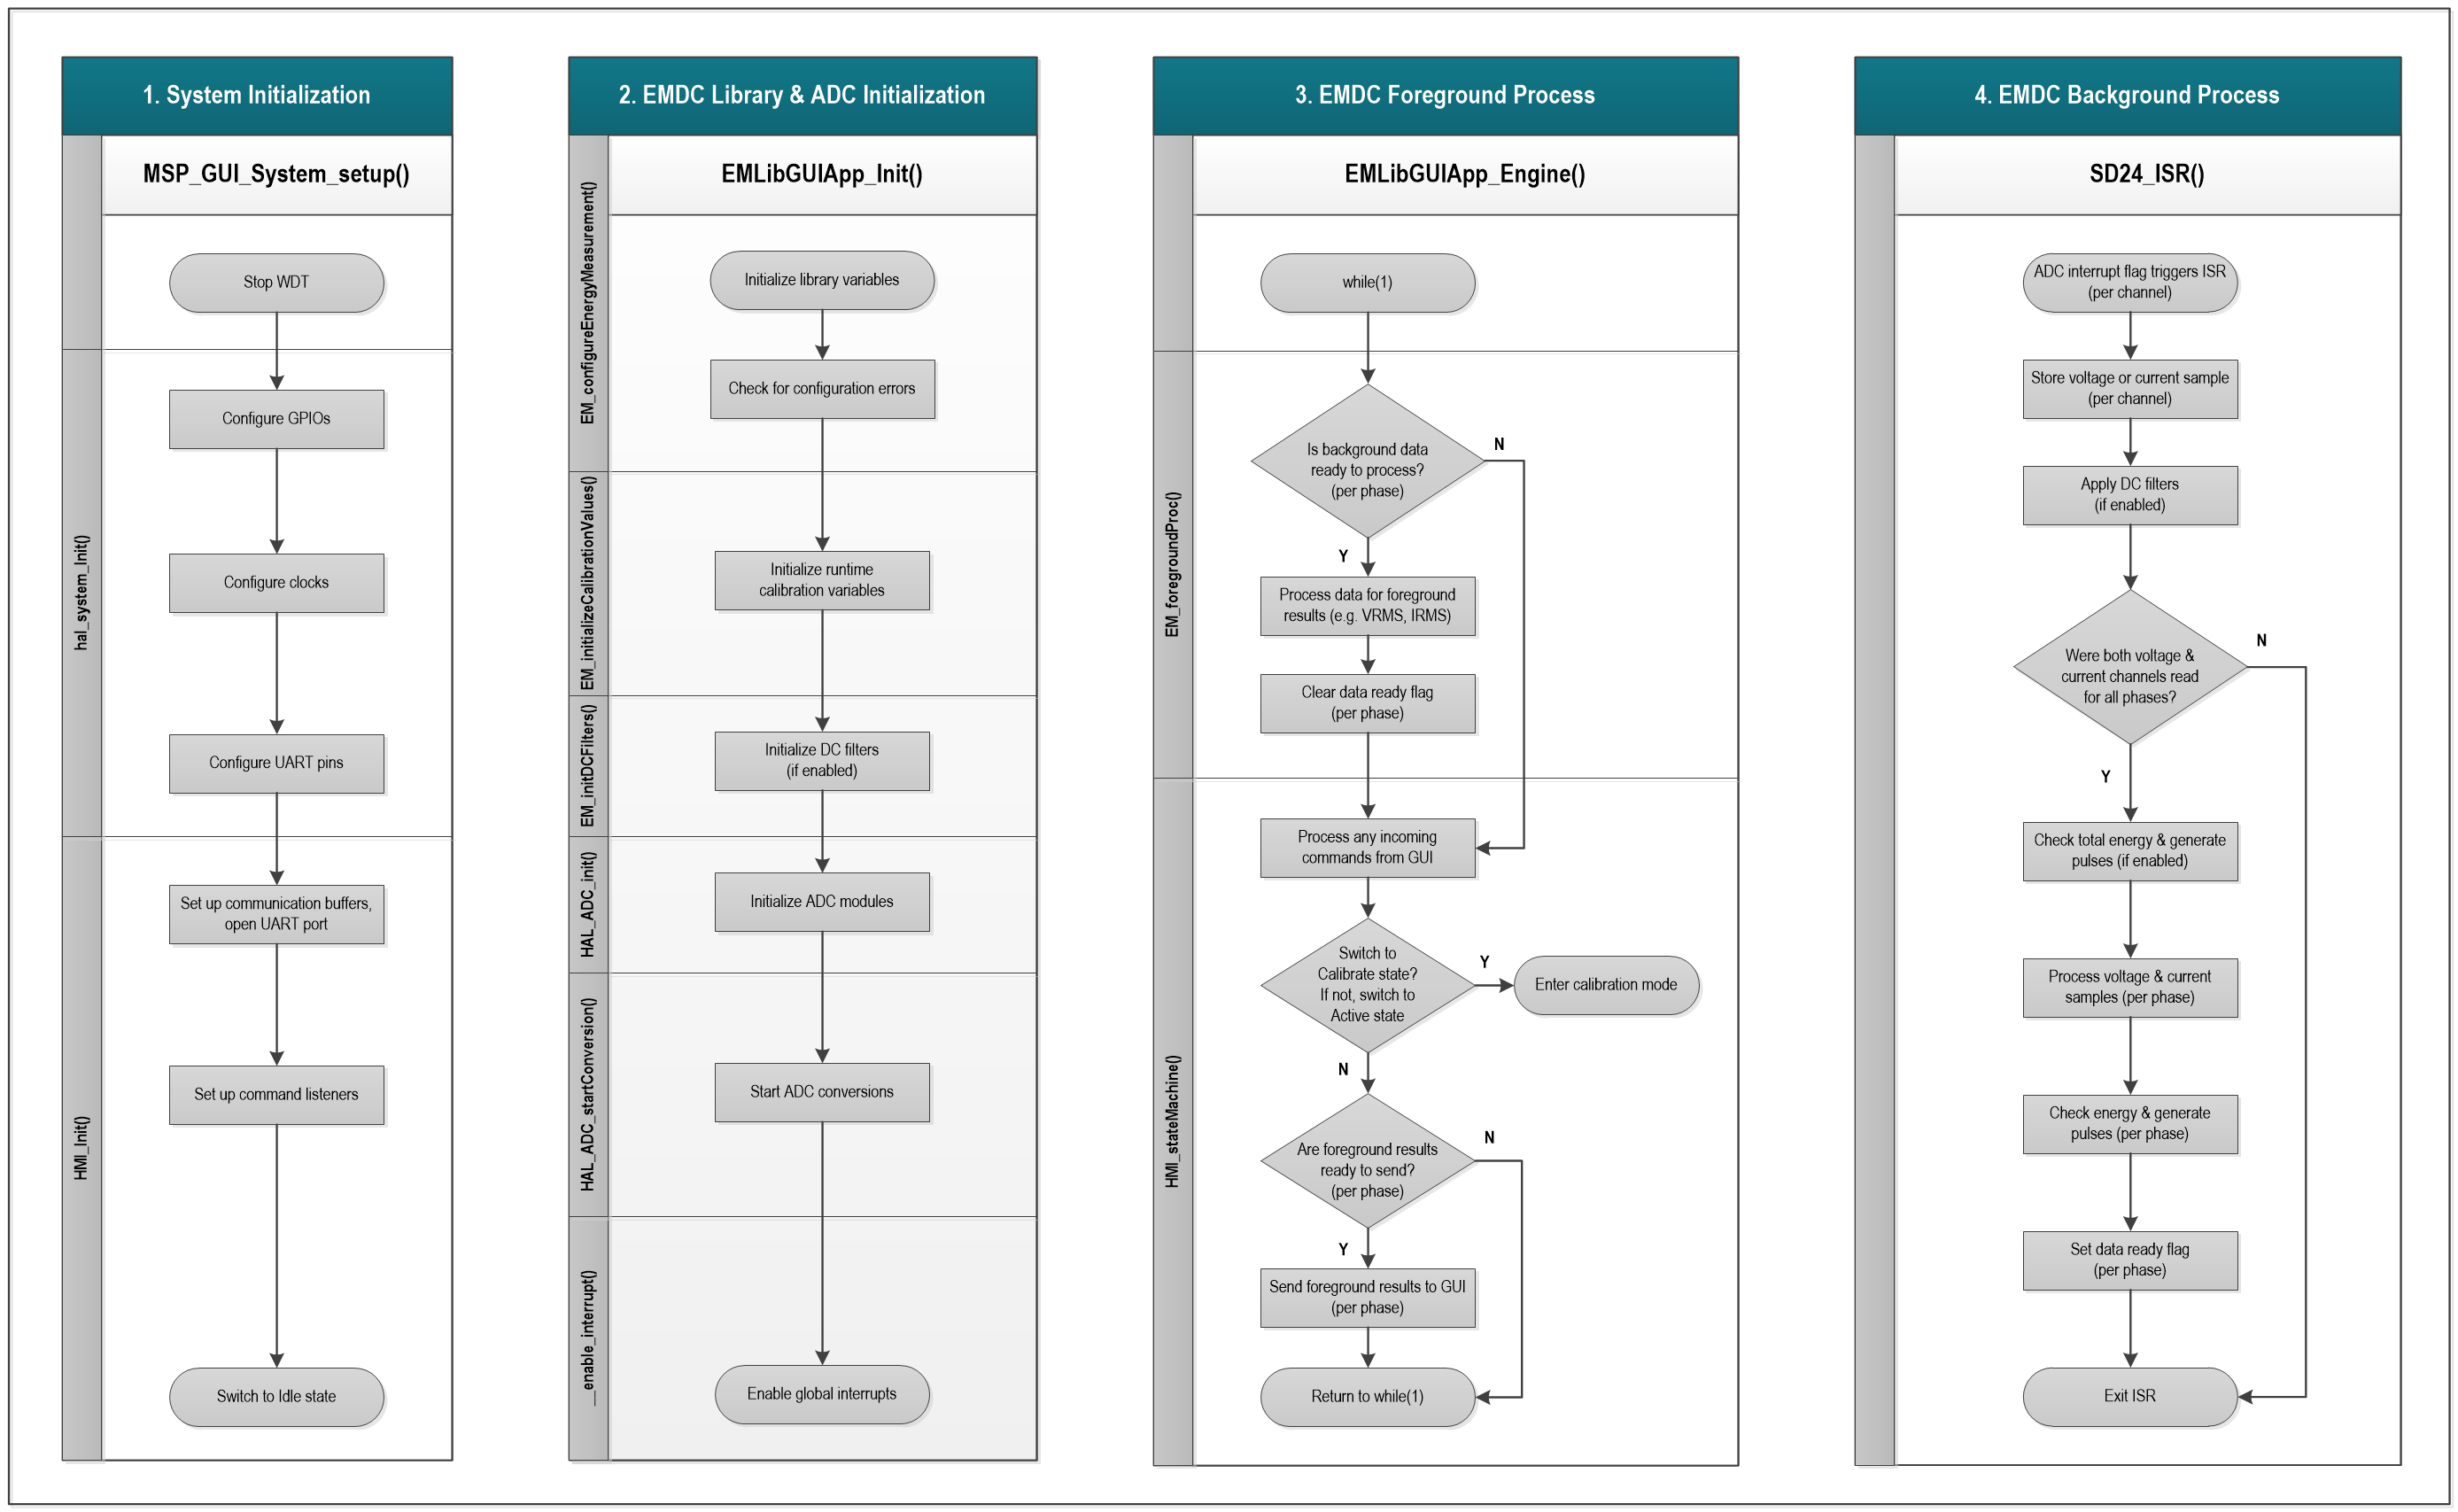
Fig. 128 EMDC Application Code Flowchart