|
AM64x MCU+ SDK
08.02.00
|


|
|
AM64x MCU+ SDK
08.02.00
|
|
It is highly recommended to go through ICSS-EMAC Design page before proceeding with this page.
This page is meant to help the developer in
See CCS Launch, Load and Run page for details on how to load and run binaries on EVM using CCS. Also, see Setup UART Terminal section for information on how to open a UART terminal inside CCS.
Link Status is available as an array linkStatus in ICSS_EMAC_Object. The status is updated in the Link ISR function (ICSS_EMAC_linkISR). It can be read by putting "((ICSS_EMAC_Object *)(icssEmacHandle->object))->linkStatus" in the "Expressions" window of CCS (It can be opened in CCS from View->Expressions).
It is possible that the link interrupt is configured incorrectly or MDIO is not triggering the interrupts. In which case one needs to put a breakpoint in the ISR ICSS_EMAC_linkISR and disconnect or connect the cable on any one port. The breakpoint should get hit, if it does not then there is some issue with the interrupt configuration.
In case different PHYs (compared to those on EVM) are used that, the PHY status registers may be read incorrectly and that might lead to some issues. Please consult the porting guide and reference manual for the specific PHY to figure out where the issue could be.
The receive path has been explained in Rx Data Path section. Rx issues can manifest themselves in several ways, the following table covers most of them (not exhaustively).
| Issue | Probable Cause |
|---|---|
| Host not receiving Multicast/Broadcast frames |
|
| Unicast Packets (for Host) being dropped |
|
| Multicast/Broadcast frames not being forwarded |
|
| Unicast frames (not for Host) not being forwarded |
|
| Packets are getting dropped |
|
The first step is to identify the exact problem. To do that please perform these steps in order.
portControlAddr configured in ICSS_EMAC_FwStaticMmap. See Accessing Memory for details how to check this memory. 0x1 value for this byte means Rx is disabled , and 0x0 means Rx is enabled. Check this as a very first step. It is not a common error but it is possible that user is invoking the IOCTL for disabling by mistake.ICSS_EMAC_rxInterruptHandler and send a single packet using any PC based tool. The ISR should get hit. Please check if the interrupt numbers for being used for ARM are correct and as expected based on the firmware.ICSS_EMAC_osRxTaskFnc used for creating RxTask task. Step through to verify that the priority is set correctly and packets are being copied properly. If interrupt is being asserted correctly but packet length is zero it indicates some data corruption in the receive queues or firmware behaving incorrectly, this scenario should not occur."((ICSS_EMAC_Object *)(icssEmacHandle->object))->stormPrev" for both ports in the "Expressions" window of CCS. Additionally one should check the statistics to see if stormPrevCounter, stormPrevCounterMC or stormPrevCounter in ICSS_EMAC_PruStatistics is getting incremented (See Checking Statistics).interfaceMacAddrOffset configured in ICSS_EMAC_FwStaticMmap and verify if the MAC value is what you are expecting it to be. See Accessing Memory for details how to check this memory.RxTask.Tx is much more reliable and there are far fewer issues related to it when compared to Rx. The transmit path has been explained in Tx Data Path section.
Transmit issues can be classified into two types:
As a first step please check the statistics (as shown in Checking Statistics) on firmware as well as Host to see if any packets have been sent out. Try to trace where the issue is by comparing transmit statistics for Host and firmware.
The probable causes for transmit not working are listed below. This can also be used as a checklist for debugging.
ICSS_EMAC_linkISR which in turn triggers call to another API ICSS_EMAC_updatePhyStatus to update the link status in firmware. If this is not done correctly then it is possible that firmware will read the event as link down even though physically the link is up. Please check the link status to make sure that this is not the case. The Tx API checks for link and will not transmit if the link is down so this issue is more relevant to cut-through/store-forward. Please see Checking Link Status for details on how to check link status.ICSS_EMAC_updatePhyStatus function, if the speed is read incorrectly then it is possible that firmware will not send out packets or may send out garbage. In such a scenario firmware statistics will count the packets as successful transmit but Tx might not actually happen. The quickest way to debug this issue is to read the ICSS memory directly in CCS memory window. Interface speed is written directly in memory at the offset mentioned phySpeedOffset configured in ICSS_EMAC_FwStaticMmap. Please check the value and compare with the actual interface speed. See Accessing Memory for details how to check this memory.Statistics form the core of debugging so this section is very important. A brief introduction to statistics has been provided in Statistics section. This part explains how to use it for the purpose of debugging.
As previously explained, statistics can be divided into two groups
Host statistics are a subset of firmware based statistics except some specialized statistics like rxUnknownProtocol and linkBreak. This property can be used to find out how many packets are being received in the firmware and how many are reaching Host.
Following are two ways of reading these statistics:
ioctlCommand, ICSS_EMAC_IOCTL_STAT_CTRL_GET as ioctlParams.command and a pointer to ICSS_EMAC_PruStatistics as ioctlParams.ioctlVal to access the PRU statistics."((ICSS_EMAC_Object *)(icssEmacHandle->object))->hostStat" , while PRU statistics are available through "(ICSS_EMAC_PruStatistics *)((((*(((ICSS_EMAC_Object *)(icssEmacHandle->object)))).fwStaticMMap).statisticsOffset + (*((*((*(((ICSS_EMAC_Object *)(icssEmacHandle->object)))).pruicssHandle)).hwAttrs)).pru0DramBase))" in the "Expressions" window of CCS.This section explains how to access ICSS memory. Various firmware offsets are configured using ICSS_EMAC_FwStaticMmap, ICSS_EMAC_FwDynamicMmap, ICSS_EMAC_FwVlanFilterParams and ICSS_EMAC_FwMulticastFilterParams structures, which are a part of ICSS_EMAC_Params needed for ICSS_EMAC_open API call.
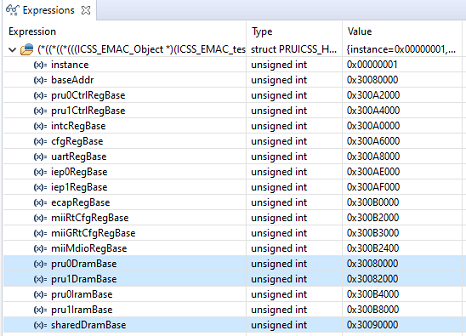
The Shared RAM address and DRAM base addresses for Port 1 and Port 2 can be obtained by adding "(*((*((*(((ICSS_EMAC_Object *)(icssEmacHandle->object)))).pruicssHandle)).hwAttrs))" in the "Expressions" window of CCS.
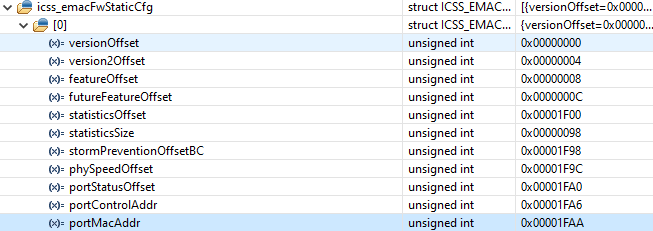
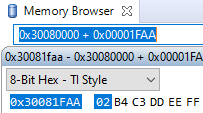
For example on AM64x, if portMacAddr location needs to be accessed for Port 0, then following steps give the value of the location using the "Memory Browser" of CCS.
| 
| 
|
For more details, see Using SDK with Real-time Object View (ROV).
 1.8.20