EnergyTrace User Guide
EnergyTrace ™ technology is a power analyzer tool for CCS that measures the application’s current consumption. The tool can be used stand-alone as a power profiling tool, or in EnergyTrace++ mode within a debug session for code analysis to help optimize the application for ultra-low-power consumption.
EnergyTrace stand-alone Instructions
The following discusses the necessary steps to use EnergyTrace in stand-alone-mode on CC26X2R1 LaunchPad. In stand-alone mode, the debugger is not active and the displayed current consumption is what to expect for the final application. As opposite to EnergyTrace++ where the debug interface on the device is active and the current consumption from the debugger will be added to the displayed current.
- Flash the target device with the application to be analyzed.
- Make sure no debug session is active and click the EnergyTrace Button as seen in Figure 52.
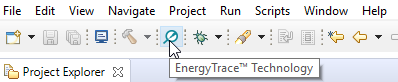
Figure 52. Start EnergyTrace
- A dialog with instructions on how to use EnergyTrace Stand-alone Measurement
Mode will pop-up. Click
Proceedto continue. - The first time EnergyTrace is being used within a CCS Workspace some settings
needs to be set. In the EnergyTrace Window, click on the
Advanced Menuicon and selectPreferences, as Figure 53. shows.
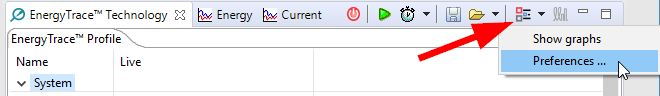
Figure 53. EnergyTrace Preferences menu
- Under
Target Connection, setConnectiontoXDS110andVoltageto 3300.0 mV.ET-HDR Range Selectorshall be set toLow current, narrower range higher accuracy. If you want to save the captured data to a .cvs-file for further analysis, selectRaw data to CSV file. You can also select the battery cell type the application will be using to get an estimated life time of the application. ClickOkto save the preferences.
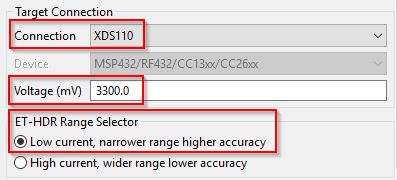
Figure 54. EnergyTrace Settings
- Select how long you want to capture data by clicking the
Select Measurement
Duration
button as in Figure 55.

Figure 55. Select Measurement Duration
- To start capturing data, click the green play button.
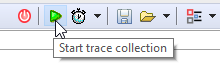
Figure 56. Start trace collection
- When EnergyTrace is finished capturing data, review the application’s power profile and have a closer look in the Current graph. Figure 57. shows a zoomed-in current graph of BLE advertising.

Figure 57. EnergyTrace Current Graph
EnergyTrace++ Instructions
To run EnergyTrace++, which allows more detailed data regarding power consumption, the Target Configuration file must be configured to allow for a different debugging interface. Specifically, to use EnergyTrace++, the debugger must be set to 4-pin cJTAG mode. The following discusses the necessary steps to modify the Target Configuration file and view EnergyTrace++ data on CC26X2R1 LaunchPad.
Warning
In EnergyTrace++ mode, the displayed current consists of the application current consumption AND the device debugger current consumption. Use EnergyTrace stand-alone mode to display only the application current consumption.
EnergyTrace++ Update Target Configuration Instructions
- In the CCS, using the Project Explorer, navigate to the
targetConfigsfolder. - Double click on the
*.ccxmlfile to open a configuration menu as seen in Figure 58.

Figure 58. Open .ccxml file
- On the bottom of the window, navigate to the
Advancedtab as seen in Figure 59.

Figure 59. Navigate to Advanced Settings Tab
- In the
All Connectionswindows pane, click on the highest level from the list tree as seen in Figure 60. - In the
Connection Propertieswindow pane, modify theJTAG/SWD/cJTAG Modeparameter tocJTAG (1149.7) 4-pin standard modefrom the dropdown menu as seen in Figure 60.

Figure 60. Configure 4-pin cJTAG Mode
- After selecting this option, click
Savein the previousAll Connectionswindow pane. - Close the
.ccxmlfile.
Using EnergyTrace++ Instructions
This section assumes the user has already configured their Target Configuration
settings to point use cJTAG (1149.7) 4-pin standard mode as described in
the EnergyTrace++ Update Target Configuration Instructions section above.
- After the Build has successfully completed,
Debugthe project. - Open the EnergyTrace Tool by clicking the button seen below in Figure 61.

Figure 61. Enable EnergyTrace Tool
- On the far right of the
EnergyTrace Technologywindow, click theSwitch to EnergyTrace++button as seen in Figure 62.

Figure 62. Switch to EnergyTrace++ Mode
- You should see an additional
Statestab popup. - Run the Debug session, click the green arrow button (F8).
- You should now be able to observe the enhanced EnergyTrace++ details in the
EnergyTrace TechnologyandStatestabs as seen in Figure 63. and Figure 64.

Figure 63. Sample EnergyTrace++ Tab

Figure 64. Sample EnergyTrace++ “States” Tab
Troubleshooting
If EnergyTrace is not able to properly setup remote controls for the device, try closing CCS, resetting your Evaluation Board and starting again.