3.8. Graphics and Display
3.8.1. Introduction
TI SOCs like AM355x, AM437x and AM57xx are enabled with 3D cores, capable of accelerating 3D operations with dedicated hardware. The dedicated hardware is based on SGX series of devices from Imagination Technologies. The graphics cores only accelerate graphics operations, and do not perform video decode operations. For video acceleration, refer to respective Technical Reference Manuals for the SOCs.
Below table lists the various TI families supported by this SDK, and the SGX core information
| TI SOC Name | SGX Core | SGX Core Revision | Max SGX Core Frequency (MHz) |
|---|---|---|---|
| AM335x | SGX530 | 1.2.5 | 200 |
| AM437x | SGX530 | 1.2.5 | 200 |
| AM57xx | SGX544 | 1.1.6 | 532 |
Table: TI System on Chips, and SGX cores
Since the 3D accelerator (SGX core) is outside the ARM core, the Graphics drivers run on ARM core, and contain OS specific driver code to memory map the SGX core and program the engine from the OS running on the ARM core. The current version of SGX DDK provides OpenGLES2.0 and EGL libraries which are used by the graphics stacks in Processor SDK, such as QT5 and Wayland/Weston, Mesa-EGL based apps are currently not supported.
This Processor SDK Graphics and Display page will cover the following topics:
- Software architecture of Graphics
- Instructions on how to run graphics demos
- Instructions on how to run PVR tools
- Instructions on how to run DSS application
- Migration Guide
- AM3 Beagle Bone Black Board Configuration
- SGX Debugging Tips
- SoC Performance Monitoring Tools
3.8.2. Software Architecture
The picture below shows the software architecture of Graphics in Processor SDK.

3.8.3. Graphics Demos Available via Matrix
The following 3D Graphics demos are available via Matrix. The table below provides a list of these demos, with a brief description.
| Demo Name | Details |
| ChameleonMan | This demo shows a matrix skinned character in combination with bump mapping. |
| CoverFlow | This is a demonstration of a coverflow style effect |
| ExampleUI | This demo shows how to efficiently render sprites and interface elements. |
| Navigation | This is a demonstration of how to implement rendering algorithms for Navigation software. |
| Kmscube | This demo shows how to render and display multi-colored spinning cube |
Note that some of the 3D Graphics demos are from Imagination’s PowerVR SDK.
3.8.4. Graphics Demos from Command Line
The graphics driver and userspace libraries and binaries are distributed along with the SDK.
Graphic demos can also run from command line. In order to do so, exit Weston by pressing Ctrl-Alt-Backspace from the keyboard which connects to the EVM. Then, if the LCD screen stays in “Please wait...”, press Ctrl-Alt-F1 to go to the command line on LCD console. After that, the command line can be used from serial console, SSH console, or LCD console.
Please make sure the board is connected to at least one display before running these demos.
3.8.4.1. Finding Connector ID
Note: Most of the applications used in the Demos would require the user to pass a connector id. A connector id is a number that is assigned to each of the display devices connected to the system. To get the list of the display devices connected and the corresponding connector id one can use the modetest application (shipped with the file system) as mentioned below:
target # modetest
Look for the display device for which the connector ID is required - such as HDMI, LCD etc.
Connectors:
id      encoder status          type    size (mm)       modes   encoders
4       3       connected       HDMI-A  480x270         20      3
  modes:
        name refresh (Hz) hdisp hss hse htot vdisp vss vse vtot)
  1920x1080 60 1920 2008 2052 2200 1080 1084 1089 1125 flags: phsync, pvsync; type: preferred, driver
...
16      15      connected       unknown 0x0             1       15
  modes:
        name refresh (Hz) hdisp hss hse htot vdisp vss vse vtot)
  800x480 60 800 1010 1040 1056 480 502 515 525 flags: nhsync, nvsync; type: preferred, driver
Usually, LCD is assigned 16 (800x480), and HDMI is assigned 4 (multiple resolutions).
3.8.4.2. Finding Plane ID
To find the Plane ID, run the modetest command:
target # modetest
Look for the section called Planes. (Sample truncated output of the Planes section is given below)
Planes:
id      crtc    fb      CRTC x,y        x,y     gamma size
19      0       0       0,0             0,0     0
 formats: RG16 RX12 XR12 RA12 AR12 XR15 AR15 RG24 RX24 XR24 RA24 AR24 NV12 YUYV UYVY
 props:
 ...
20      0       0       0,0             0,0     0
 formats: RG16 RX12 XR12 RA12 AR12 XR15 AR15 RG24 RX24 XR24 RA24 AR24 NV12 YUYV UYVY
 props:
 ...
3.8.4.3. kmscube
Run kmscube on default display:
target # kmscube
Run kmscube on secondary display:
target # kmscube -c <connector-id>
target # kmscube -c 16 #For example, the connector id for secondary display is 16.
Run kmscube on all connected displays (LCD & HDMI):
target # kmscube -a
3.8.4.4. Wayland/Weston
The supported Wayland/Weston version brings in the multiple display support in extended desktop mode and the ability to drag-and-drop windows from one display to the other.
To launch weston, do the following:
On target console:
target # unset WAYLAND_DISPLAY
On default display:
target # weston --tty=1 --connector=<default connector-id>
On secondary display:
target # weston --tty=1 --connector=<secondary connector-id>
On all connected displays (LCD and HDMI):
target # weston --tty=1
The user can change the screensaver timeout using a command line option
--idle-time=<number of seconds>
For example, to set timeout of 10 minutes and weston configured to display on all connectors, use the below command:
weston --tty=1 --idle-time=600
To disable the screen timeout and to configure weston configured to display on all connectors, use the below command:
weston --tty=1 --idle-time=0
If you face any issues with the above procedure, please refer GLSDK_FAQs#Unable_to_run_Weston_on_the_GLSDK_release for troubling shooting tips.
The filesystem comes with a preconfigured weston.ini file which will be located in
/etc/weston.ini
Running weston clients
# /usr/bin/weston-flower
# /usr/bin/weston-clickdot
# /usr/bin/weston-cliptest
# /usr/bin/weston-dnd
# /usr/bin/weston-editor
# /usr/bin/weston-eventdemo
# /usr/bin/weston-image /usr/share/weston/terminal.png
# /usr/bin/weston-resizor
# /usr/bin/weston-simple-egl
# /usr/bin/weston-simple-shm
# /usr/bin/weston-simple-touch
# /usr/bin/weston-smoke
# /usr/bin/weston-info
# /usr/bin/weston-terminal
Running multimedia with Wayland sink
The GStreamer video sink for Wayland is the waylandsink. To use this video-sink for video playback:
target # gst-launch-1.0 playbin uri=file://<path-to-file-name> video-sink=waylandsink
Exiting weston
Terminate all Weston clients before exiting Weston. If you have invoked Weston from the serial console, exit Weston by pressing Ctrl-C.
It is also possible to invoke Weston from the native console, exit Weston by using pressing Ctrl-Alt-Backspace.
3.8.4.5. Using IVI shell feature
The SDK also has support for configuring weston ivi-shell. The default shell that is configured in the SDK is the desktop-shell.
To change the shell to ivi-shell, the user will have to add the following lines into the /etc/weston.ini.
To switch back to the desktop-shell can be done by commenting these lines in the /etc/weston.ini (comments begin with a ‘#’ at the start of line).
[core]
shell=ivi-shell.so

[ivi-shell]
ivi-module=ivi-controller.so
ivi-input-module=ivi-input-controller.so
After the above configuration is completed, we can restart weston by running the following commands
target# /etc/init.d/weston stop
target# /etc/init.d/weston start
NOTE: When weston starts with ivi-shell, the default background is black, this is different from the desktop-shell that brings up a window with background.
With ivi-shell configured for weston, wayland client applications use ivi-application protocol to be managed by a central HMI window management. The wayland-ivi-extension provides ivi-controller.so to manage properties of surfaces/layers/screens and it also provides the ivi-input-controller.so to manage the input focus on a surface.
Applications must support the ivi-application protocol to be managed by the HMI central controller with an unique numeric ID.
Some important references to wayland-ivi-extension can be found at the following links:
- https://at.projects.genivi.org/wiki/display/WIE/01.+Quick+start
- https://at.projects.genivi.org/wiki/display/PROJ/Wayland+IVI+Extension+Design
Running weston’s sample client applications with IVI shell
All the sample client applications in the weston package like weston-simple-egl, weston-simple-shm, weston-flower etc also have support for ivi-shell. The SDK includes the application called layer-add-surfaces which is part of the wayland-ivi-extension. This application allows the user to invoke the various functionalities of the ivi-shell and control the applications.
The following is an example sequence of commands and the corresponding effect on the target.
After launching the weston with the ivi-shell, please run the below sequence of commands:
target# weston-simple-shm &
At this point nothing is displayed on the screen, some additional commands are required.
target# layer-add-surfaces 0 1000 2 &
This command creates a layer with ID 1000 and to add maximum 2 surfaces to this layer on the screen 0 (which is usually the LCD).
At this point, the user can see weston-simple-shm running on LCD. This also prints the numericID (surfaceID) to which client’s surface is mapped as shown below:
CreateWithDimension: layer ID (1000), Width (1280), Height (800)
SetVisibility      : layer ID (1000), ILM_TRUE
layer: 1000 created
surface                : 10369 created
SetDestinationRectangle: surface ID (10369), Width (250), Height (250)
SetSourceRectangle     : surface ID (10369), Width (250), Height (250)
SetVisibility          : surface ID (10369), ILM_TRUE
layerAddSurface        : surface ID (10369) is added to layer ID (1000)
Here 10369 is the number to which weston-simple-shm application’s surface is mapped.
User can launch one more client application which allows layer_add_surfaces to add second surface to the layer 1000 as shown below.
target# weston-flower &
User can control the properties of the above surfaces using LayerManagerControl as shown below to set the position, resize, rotation, opacity and visibility respectively.
target# LayerManagerControl set surface 10369 position 100 100
target# LayerManagerControl set surface 10369 destination region 150 150 300 300
target# LayerManagerControl set surface 10369 orientation <0/1/2/3>  (for steps of rotation in 90 degree angles)
target# LayerManagerControl set surface 10369 opacity 0.5
target# LayerManagerControl set surface 10369 visibility 1
target# LayerManagerControl help
The help option prints all possible control operations with the LayerManagerControl binary, please refer to the available options.
Running QT applications with IVI shell
To run the QT application withs ivi shell, set the QT_WAYLAND_SHELL_INTEGRATION environment variable to ivi-shell.
- QT_WAYLAND_SHELL_INTEGRATION=ivi-shell
IMG PowerVR Demos
The Processor SDK filesystem comes packaged with example OpenGLES applications. The examples can be invoked using the below commands.
target # /usr/bin/SGX/demos/Raw/OGLES2Coverflow
target # /usr/bin/SGX/demos/Raw/OGLES2ChameleonMan
target # /usr/bin/SGX/demos/Raw/OGLES2ExampleUI
target # /usr/bin/SGX/demos/Raw/OGLES2Navigation
After you see the output on the display interface, hit q to terminate the application.
3.8.5. Using the PowerVR Tools
The suite of PowerVR Tools is designed to enable rapid graphics application development. It targets a range of areas including asset exporting and optimization, PC emulation, prototyping environments, on-line and off-line performance analysis tools and many more. Please refer to https://community.imgtec.com/developers/powervr/graphics-sdk/ for additional details on the tools and detailed documentation.
The target file system includes a subset of PowerVR tools such as PVRScope and PVRTrace recorder libraries from Imagination PowerVR SDK to profile and trace SGX activities. In addition, it also includes PVRPerfServerDeveloper tool.
3.8.5.1. PVRTune
The PVRTune utility is a real-time GPU performance analysis tool. It captures hardware timing data and counters which facilitate the identification of performance bottlenecks. PVRPerfServerDeveloper should be used along with the PVRTune running on the PC to gather data on the SGX loading and activity threads. You can invoke the tool with the below command:
target # /opt/img-powervr-sdk/PVRHub/PVRPerfServer/PVRPerfServerDeveloper
3.8.5.2. PVRTrace
The PVRTrace is an OpenGL ES API recording and analysis utility. PVRTrace GUI provides off-line tools to inspect captured data, identify redundant calls, highlight costly shaders and many more. The default filesystem contains helper scripts to obtain the PVRTrace of the graphics application. This trace can then be played back on the PC using the PVRTrace Utility.
To start tracing, use the below commands as reference:
target # cp /opt/img-powervr-sdk/PVRHub/Scripts/start_tracing.sh ~/.
target # ./start_tracing.sh <log-filename> <application-to-be-traced>
Example:
target # ./start_tracing.sh westonapp weston-simple-egl
The above command will do the following:
- Setup the required environment for the tracing
- Create a directory under the current working directory called pvrtrace
- Launch the application specified by the user
- Start tracing the PVR Interactions and record the same to the log-filename
To end the tracing, user can invoke the Ctrl-C and the trace file path will be displayed.
The trace file can then be transferred to a PC and we can visualize the application using the host side PVRTrace utility. Please refer to the link at the beginning of this section for more details.
3.8.6. Running DSS application
DSS applications are omapdrm based. These will demonstrate the clone mode, extended mode, overlay window, z-order and alpha blending features. To demonstrate clone and extended mode, HDMI display must be connected to board. Application requires the supported mode information of connected displays and plane ids. One can get these information by running the modetest application in the filesystem.
target # modetest
Running drmclone application
This displays same test pattern on both LCD and HDMI (clone). Overlay window also displayed on LCD. To test clone mode, execute the following command:
target # drmclone -l <lcd_w>x<lcd_h> -p <plane_w>x<plane_h>:<x>+<y> -h <hdmi_w>x<hdmi_h>
e.g.: target # drmclone -l 1280x800 -p 320x240:0+0 -h 640x480
We can change position of overlay window by changing x+y values. eg. 240+120 will show @ center
Running drmextended application
This displays different test pattern on LCD and HDMI. Overlay window also displayed on LCD. To test extended mode, execute the following command:
target # drmextended -l <lcd_w>x<lcd_h> -p <plane_w>x<plane_h>:<x>+<y> -h <hdmi_w>x<hdmi_h>
e.g.: target # drmextended -l 1280x800 -p 320x240:0+0 -h 640x480
Running drmzalpha application
Z-order:
It determines, which overlay window appears on top of the other.
Alpha Blend:
It determines transparency level of image as a result of both global alpha & pre multiplied alpha value.
- Pre multipled alpha value: 0 or 1
- 0 - source is not premultiply with alpha1 - source is premultiply with alpha
To test drmzalpha, execute the following command:
target # drmzalpha -s <crtc_w>x<crtc_h> -w <plane1_id>:<z_val>:<glo_alpha>:<pre_mul_alpha> -w <plane2_id>:<z_val>:<glo_alpha>:<pre_mul_alpha>
e.g.: target # drmzalpha -s 1280x800 -w 19:1:255:1 -w 20:2:255:1
3.8.7. QT Graphics Framework
Qt is a powerful C++ toolkit for writing cross-platform graphics applications, enabling a single code base to run predictably and perform well on Windows and embedded platforms,
Please refer https://www.qt.io/ for additional details on Qt.
The PSDK target file system includes the pre-built Qt libraries under /usr/lib and a rich set of QT demo applications under /usr/share/qt5/examples. A small subset of QT demo applications such as Calculator and Animatedtiles can also be invoked through Matrix.
QT QPA
The QT5 within PSDK is prebuilt with Wayland enabled and therefore wayland-egl is the default QPA. Hence all QT applications should be run on top of Weston. To run QT application without Weston, the user can use “- platform” option to specify the desired QPA as “linuxfb” or “eglfs”.
3.8.8. Migration from prior releases
3.8.8.1. from Processor SDK 1.x to 2.x for AM3, AM4
The SGX driver has been enhanced to support DRM based Full Window Display in processor SDK 2.0 and the FBdev based Full Window modes are no longer supported. The System startup and most of the Graphics applications are backward-compatible except with the following changes.
Window System Libraries
The FBdev based Full Screen window systems are no longer supported:
- libpvrPVR2D_FRONTWSEGL.so (for direct writes to FrameBuffer - FRONT mode of operation - directly writes to FrameBuffer without waiting for vsync - fastest mode of operation)
- libpvrPVR2D_FLIPWSEGL.so (for VSync synchronised writes to Framebuffer - slower, but avoids tearing)
- libpvrPVR2D_BLITWSEGL.so (for direct writes to back-buffer, which later gets written to *FrameBuffer with sync)
Instead the DRM based Full Screen window system are provided:
- libpvrDRMWSEGL_FRONT.so (for direct writes to DRM FrameBuffer - FRONT mode of operation - directly writes to FrameBuffer without waiting for vsync - fastest mode of operation)
- libpvrDRMWSEGL.so (for VSync synchronised writes to DRM Framebuffer - slower, but avoids tearing)
The window system is specified by the PVR configuration parameter WindowSystem at the PVR configuration file /etc/powervr.ini. By default, that parameter is set to libpvrDRMWSEGL_FRONT.so for nullDRM Front mode. To configure the PVR SGX to operate in nullDRM FLIP mode, edit the PVR configuration file to set the parameter WindowSystem to libpvrDRMWSEGL.so. The change will take effect when any graphic application is launched next time.
Obsolete Test Programs
The following test programs are no longer applicable and removed from the SDK file system
- /usr/bin/sgx_blit_test
- /usr/bin/sgx_flip_test
- /usr/bin/sgx_render_flip_test
- /usr/bin/sgx_render_test
3.8.8.2. from Processor SDK 2.0.0 to 2.0.x for AM4
The SGX driver has been enhanced to support DRM/WAYLAND based Multi-Window Display in processor SDK 2.0.1. The System startup and most of the Graphics applications are backward-compatible except with the following changes.
Window System Libraries
The DRM based Full Screen window systems are no longer supported:
- libpvrDRMWSEGL_FRONT.so (for direct writes to DRM FrameBuffer - FRONT mode of operation - directly writes to FrameBuffer without waiting for vsync - fastest mode of operation)
- libpvrDRMWSEGL.so (for VSync synchronised writes to DRM Framebuffer - slower, but avoids tearing)
Instead the DRM/WAYLAND based multi-window system are provided:
- libpvrws_KMS.so
- libpvrws_WAYLAND.so
The window system will be dynamically loaded by DDK based on the application use case, so that the PVR configuration parameter WindowSystem at the PVR configuration file /etc/powervr.ini is no longer used.
3.8.8.3. from Processor SDK 2.0.1 to 2.0.x for AM3/4/5
The SGX driver has been enhanced to support DRM-based Full Screen(NullDRM) and Multi-Window(Wayland) Display in processor SDK 2.0.2. The System startup and most of the Graphics applications are backward-compatible except with the following changes.
Window System Libraries
The DRM based Full Screen window system is supported:
- libpvrDRMWSEGL.so (for VSync synchronised writes to DRM Framebuffer - slower, but avoids tearing)
The DRM/WAYLAND based multi-window systems are also provided:
- libpvrGBMWSEGL.so
- libpvrws_WAYLAND.so
The window system will be dynamically loaded by DDK based on the application use case, so that the PVR configuration parameter WindowSystem at the PVR configuration file /etc/powervr.ini is no longer required.
3.8.8.4. from Processor SDK 3.1 to 3.x for AM3/4/5
The QT QPA eglfs_kms, which supports multiple screens, has been enabled and used as the default eglfs platform plugin in processor SDK 3.2. To fallback to the standard single-screen eglfs plugin, issue the following instruction at the command line or add the same at the QT environment configuration file qt_env.sh at /etc/profile.d
- export QT_QPA_EGLFS_INTEGRATION=none
3.8.9. AM3 Beagle Bone Black Board Configuration
AM335x has a HW bug, chapter 3.1.1 in the errata: “The blue and red color assignments to the LCD data pins are reversed when operating in RGB888 (24bpp) mode compared to RGB565 (16bpp) mode.” Therefore, the applications need to always use either 24 or 16 bpp modes, depending on the display HW connected to the board. The default pixel format XRGB8888 of the graphics application back ends and drivers within PSDK is not supported at the AM3 Beagle Bone Black Board where it is in 16bpp mode. To enable appropriate graphics display, make the following changes at various graphics related configuration files:
- /etc/powervr.ini: add DefaultPixelFormat=RGB565
- /etc/weston.ini: add gbm-format=rgb565 at section [core]
- /etc/profile.d/qt_env.sh: add export QT_QPA_EGLFS_INTEGRATION=none
Another restriction of AM335x-based platform is that the width of display resolution must be multiple of 32. For example, 1360x768 will not work. The simple workaround is to specify the display resolution as one of the kernel boot parameters for non-Weston application and at /etc/weston.ini for Weston server. For example,
- the following commands need to be executed at boot prompt
=> setenv optargs video=HDMI-A-1:1024x768
=> saveenv
- add the HDMI-A configuration to /etc/weston.ini in a new “output” section, as shown below:
[output]
name=HDMI-A-1
mode=1024x768
3.8.10. SOC Performance monitoring tools on AM5 Devices
Introduction
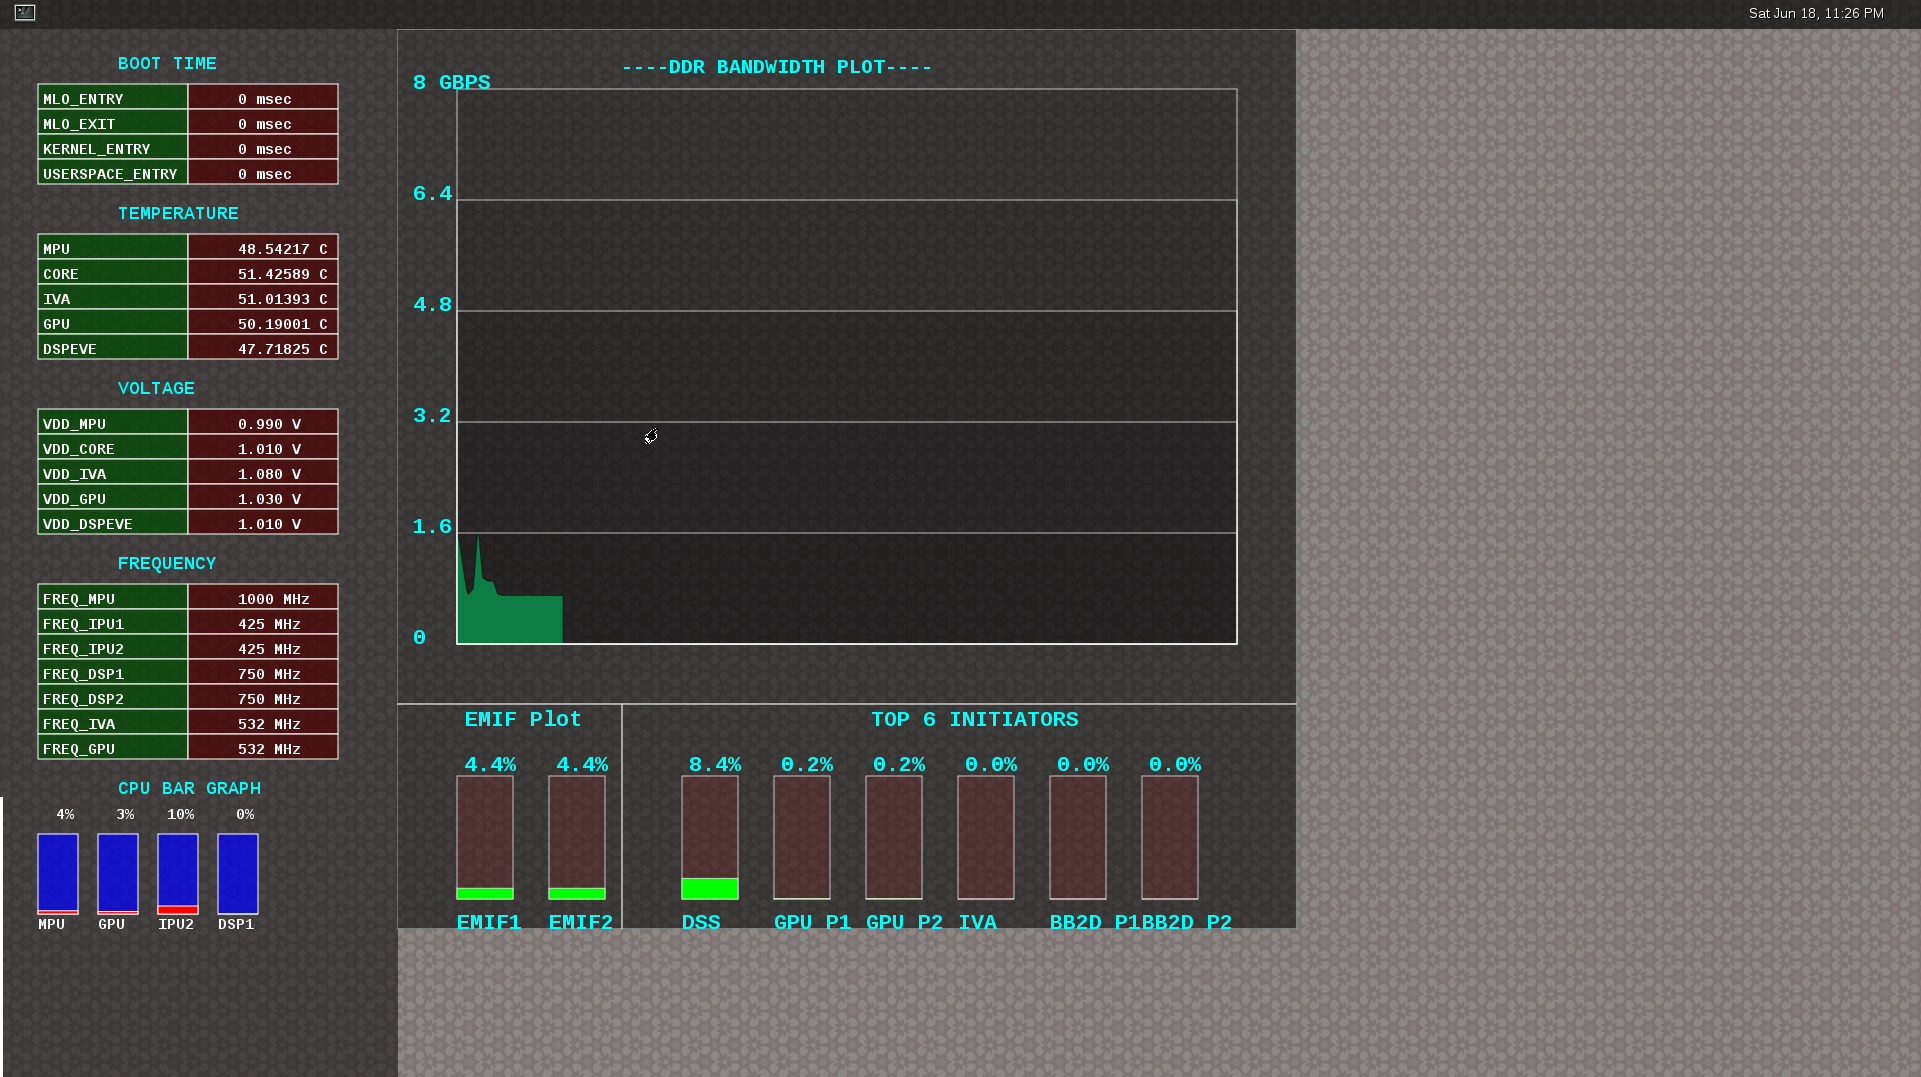
The SOC Performance monitoring tools are a set of tools that are included in the default filesystem that allow the user to visualize various SOC parameters real-time on the screen. Currently, there are two tools and a suite of scripts and utilities to use them.
- soc-performance-monitor
- soc-ddr-bw-visualize
Both these applications are Wayland applications and need to be invoked after running Weston.
These tools bring in the capability to visualize the following:
- DDR BW Utilization #. Overall DDR BW Usage #. Split of the traffic between the two EMIF’s #. A real time “top” like functionality that depicts the list of “Top 6” initiators generating the traffic.
- Voltage of the various rails
- Frequency of the various cores
- Temperature (read from on die temperature sensors)
- CPU Load information of the various processor cores including the GPU and DSP.
- Boot time results (requires rebuild of u-boot and kernel), refer instructions below.
- Power plot (Will be available soon. Note that this requires board modification on the EVM)
Getting started
- Prepare the card with PLSDK 3.0.0 or later.
- Boot up
- Start weston
target # /etc/init.d/weston start
- Copy the required scripts into a temporary folder (this is to allow you to experiment with the settings later)
target # mkdir temp
target # cd temp
target # cp /etc/glsdkstatcoll/* .
target # cp /etc/visualization_scripts/* .
- You should see the following file in the directory after the above operation.
target # ls -al
drwxr-xr-x    2 root     root          4096 Mar 22 18:01 .
drwxr-xr-x    3 root     root          4096 Mar 22 18:01 ..
-rw-r--r--    1 root     root           114 Mar 22 18:01 config.ini
-rw-r--r--    1 root     root           265 Mar 22 18:01 dummy_boot_time_results.sh
-rw-r--r--    1 root     root           419 Mar 22 18:01 dummy_cpu_load.sh
-rw-r--r--    1 root     root           899 Mar 22 18:01 getFrequency.sh
-rw-r--r--    1 root     root          2293 Mar 22 18:01 getTemp.sh
-rw-r--r--    1 root     root           371 Mar 22 18:01 getVoltage.sh
-rw-r--r--    1 root     root           254 Mar 22 18:01 initiators.cfg
-rw-r--r--    1 root     root           143 Mar 22 18:01 list-boot-times.sh
-rw-r--r--    1 root     root           367 Mar 22 18:01 send_boot_times_to_monitor.sh
-rw-r--r--    1 root     root           496 Mar 22 18:01 soc_performance_monitor.cfg
-rw-r--r--    1 root     root           133 Mar 22 18:01 start_visualization_test.sh
- Running the soc-performance-monitor, this tool has two pre-requisites.
- The name of the fifo configured in the file soc_performance_monitor.cfg needs to be created
- The file soc_performance_monitor.cfg should be present in the current directory. This should be done in the above steps.
- Creating the fifo (mentioned in the soc_performance_monitor.cfg)
target # mkfifo /tmp/socfifo
- Run the tool for various performance metrics
target # soc-performance-monitor &
- Run the tool for DDR BW Visualization
target # mkfifo /tmp/statcollfifo
target # soc-ddr-bw-visualizer &
The following sections will talk about the how to populate the data into tools and further controls that are possible.
Quick guide to available plugins
Plugins are the entities (scripts/native binaries) that can be used to send commands to the SOC Performance Monitoring tools.
The main intent of this is to separate the visualization engine from the data collection part and allow full configuration of the application.
When the application (soc-performance-monitor) is invoked, it starts up with the default data which is set to zero. To populate the real values, the user can use the scripts provided in the prebuilt filesystem.
Temperature data
The temperature data is read from the on-die temperature registers and sent to the visualization tool. The file system comes with a script that does this functionality.
target # sh getTemp.sh
Invoking the above command will populate the temperature table with the current temperature.
Voltage data
The voltage data is read from the omapconf utility and then parsing out the required information to be later sent to the visualization tool. The file system comes with a script that does this functionality.
target # sh getVoltage.sh
Invoking the above command will populate the Temperature table with the configured voltage for the various rails.
Frequency data
The frequency data is read from the omapconf utility and then parsing out the required information to be later sent to the visualization tool. The file system comes with a script that does this functionality.
target # sh getFrequency.sh
Invoking the above command will populate the Frequency table with the configured frequency for the various cores.
CPU Load information
The CPU load information need individual plugin modules for each of the cores. This is envisioned to be different for different systems. The default filesystem contains the plugins required for reading the MPU(A15) and the GPU(SGX544 MP2). Other plugins for measuring the loads for the IPU1, IPU2, DSP1 and DSP2 will be available at a later time.
Measuring the MPU load
The filesystem is populated with a binary which is called “mpuload” that reads the /proc/stat interface and derives the load. The user can run the utility in the background with the
target # mpuload FIFO

Example usage:

target # mpuload /tmp/socfifo 1000 &
After running this binary the MPU load in the Bar Graph of the CPU load will be updated dynamically at an interval of 1 second.
Measuring the GPU load
The filesystem is populated with a binary called as “pvrscope” that reads the SGX registers via a library called libPVRScopeDeveloper.a This utility invokes the APIs provided by IMG as part of the Imagination PowerVR SDK and then populates the required FIFO.
Usage instructions:
target # pvrscope <option> <time_seconds>

options:
          -f    write into the FIFO (/tmp/socfifo)
          -c    output to console

time:
          1-n   specified in seconds
          0     run forever
After running this utility, the GPU load in the BAR Graph of the CPU load area will be updated at an interval of 1 second.
Measuring the DSP load
The filesystem is populated with a binary which is called “dsptop” that collects DSP usage info and then populates the required FIFO.
The user can run the utility in the background with the
target # dsptop –r <update_freq> –f fifo –o /tmp/socfifo –d <update_freq> -n <# of updates>

Example usage:

target # dsptop –r 1 –f fifo –o /tmp/socfifo –d 1 –n 100  &
After running this binary the DSP load in the Bar Graph of the CPU load will be updated at an interval specified by “-r, -d”, for example “-r 1 –d 1” means at an interval of 1 second.
Boot time measurement
This feature will be provided at future release.
Order of execution
The performance visualization tools have to be executed in the following order.
- Launch weston
- Create required FIFOs
- Configure the .cfg file to suit the required settings
- Run the soc-performance-monitor and/or soc-ddr-bw-visualizer
- Run the plugins to populate data
Config file format
The config file has the following format. There are 3 different kinds of sections that can be defined, please refer to the particular section for more details.
The generic format is:
[SECTION_NAME]
VALUE_1
VALUE_2
..
..
VALUE_N
SPECIAL VALUE
<blank line>
Types of sections
- GLOBAL
- TABLE
- BAR GRAPH
GLOBAL section:
The SECTION_NAME is specified as GLOBAL followed by a sequence of key value pairs.
[GLOBAL]
KEY_1=VALUE_1
KEY_2=VALUE_2
..
..
KEY_n=VALUE_n
<blank>
Global configurations
The list of recognized global values are:
- REFRESH_TIME_USECS
- FIFO
- MAX_HEIGHT
- MAX_WIDTH
- X_POS
- Y_POS
REFRESH_TIME_USECS:
- This will dictate the interval at which the utility is going to run.
- The value is specified in micro seconds
- This value decides a major trade-off, lower rate will increase the CPU load and GPU load.
- The ideal value is about 100000 usecs
FIFO:
- The value of this field is the named pipe or fifo that can be used to communicate with the application.
- User would need to create a fifo (application will prompt if it doesn’t exist)
MAX_HEIGHT, MAX_WIDTH:
- The width and height of the application.
- This can be adjusted based on the number of tables and bar graph entities.
X_POS, Y_POS:
- Decide the starting offset of the application.
- Note that there are commands to move the application (Refer commands section).
TABLE section:
The section name can be one of the following:
- BOOT_TIME
- TEMPERATURE
- VOLTAGE
- FREQUENCY
[TABLE_NAME]
 VALUE_1
 VALUE_2
 ..
 ..
 VALUE_N
TITLE="TABLE TITLE",UNIT="unit to be displayed"
<blank line>
NOTE: The TITLE=list is a list of comma separated values and TITLE and UNIT are the only supported values.
BAR GRAPH section:
[GRAPH_NAME]
 VALUE_1
 VALUE_2
 ..
 ..
 VALUE_N
 TITLE OF THE GRAPH
 <blank line>
Commands:
The FIFO can be used to communicate with the soc-performance-monitor application and pass data from the command line or from other applications. There are a few commands that have been implemented to aid in modifying the running application via the FIFO.
The commands in general have the following format:
"INSTRUCTION: DATA_1 ... DATA_N"
and they can be sent to the soc-performance-monitor by simply doing an echo:
echo "INSTRUCTION: DATA_1 ... DATA_N" > FIFO
The currently supported list of supported commands are:
- TABLE
- CPULOAD
NOTE: To execute a sequence of commands in a sequence, it is advised that a delay of REFRESH_TIME_USECS be inserted between two commands.
TABLE command
The format of the TABLE command is:
"TABLE: ROW_NAME value unit"
When this command is issued, the tool will find a table entry with the ROW_NAME in Column 0 and then update the Column 1 of the table with “value unit”.
If the ROW_NAME is not found, then this command will have no effect. Please note that this brings in a restriction that all the tables rows will need to have a unique name. In order to ensure this, the soc_performance_monitor.cfg file will have to be reviewed to ensure unique names.
Example: To update the FREQUENCY table for MPU, the user can send the following command:
echo "TABLE: FREQ_MPU 1500 MHz" > /tmp/socfifo
CPULOAD command
The format of the CPULOAD command is:
"CPULOAD: CORE_NAME value" > FIFO

 CORE_NAME has to be one of the names specified in the soc_performance_monitor.cfg.
 value is in the range 0 to 100
Usually, the CPULOAD command is invoked through an application monitors the load of a specific core.
In each system, the mechanism to retrieve the CPULOAD of a particular core can vary and it is for this reason that several plugins have been provided and serve as an example for further extension.
Example: To update the CPULOAD table for GPU, the user can send the following command:
echo "CPULOAD: GPU 87" > /tmp/socfifo
Executing in debug mode
To launch the application in debug mode for very verbose data on the internal working of the tool, launch the tool with the following option:
# soc-performance-monitor 1
Build instructions
The full source of the tool is available and the required recipes have been updated as part of the recipes and upstreamed to meta-arago.
Essentially, if the user builds the Yocto filesystem as documented in the SDG, the tool will get recompiled as part of it.
Configuration of the soc-ddr-bw-visualizer
Refer to #Using_the_statistics_collector_.28bandwidth_application.29
- The total time that the tool runs is configured using config.ini.
- To allow finer granularity of control to choose the initiators of interest, the user will have to modify the initiators.cfg.
The tool will have to relaunched for the new settings to take effect.
3.8.11. SGX Debug Info
Introduction
The TI OMAP/AM/DM SGX Graphics Driver is closely tied to the environment it is running under, and the configuration it is built with. This article mentions debugging methods specific to Linux.
Baselining the current SGX driver environment
The current SGX driver environment on the target can be observed using the below script.
https://gforge.ti.com/gf/download/docmanfileversion/203/3715/gfx_check.sh
This script performs the below actions:
#!/bin/sh
echo "WSEGL settings"
cat /etc/powervr.ini
echo "------"
echo "ARM CPU information"
cat /proc/cpuinfo
echo "------"
echo "SGX driver information"
cat /proc/pvr/version
echo "------"
echo "Framebuffer settings"
fbset -i
echo "------"
echo "Rotation settings"
cat /sys/class/graphics/fb0/rotate
echo "------"
echo "Kernel Module information"
lsmod
echo "------"
echo "Boot settings"
cat /proc/cmdline
echo "------"
echo "Linux Kernel version"
uname -a
Run-time checks/configuration of the SGX driver
One can confirm whether the SGX drivers have been properly installed by checking the following
- One should have seen the message on serial console- “Initializing the graphics driver ...” just before getting the linux command prompt.
- lsmod shows pvrsrvkm module inserted successfully without any error messages on console.
The SGX driver can be configured at run-time on the target using a configuration file.
The optional configuration file is installed by the Processor SDK installer at,
/etc/powervr.ini
Configuration items are specified using the below syntax
KeyWord=ParamValue
Important configuration parameters are mentioned below.
WindowSystem
* WindowSystem - This configuration item controls the low level window system that the EGL implementation should hook it up. This item takes the below values

* libpvrDRMWSEGL.so (DRM-based WS for VSync synchronised writes to Framebuffer - slower, but avoids tearing)

* libpvrGBMWSEGL.so (GBM-based WS where it is up to application to perform KMS operations)
DisableHWTextureUpload
* DisableHWTextureUpload - This configuration item enables/disables the use of SGX Transfer queue hardware.
* If set to 1, uses software upload (copying from driver to SGX) of textures, rather than transfer queue (using the SGX hardware).
* Useful to rule out problems in TQ.
DefaultPixelFormat
* DefaultPixelFormat - This configuration item sets the default display pixel format.
- For eg if one wants to configure the default pixel format, then edit /etc/powervr.ini to have following line
- DefaultPixelFormat=ARGB8888
- For AM3 Beagle Bone Black EVM
- DefaultPixelFormat=RGB565
SGX Driver Failure Modes (Installation)
Unable to install the kernel modules (pvrsrvkm.ko)
1. The Linux kernel has to be built with “modules” support (make ti-sgx-ddk-km and make ti-sgx-ddk-km_install)
2. The kernel modules of the Graphics driver have to be built, after the linux kernel is built in the above manner. ie, the kernel modules need to match the kernel version that will actually run on the target.
3. If the services kernel module (pvrsrvkm.ko) does not load, it is likely because of mismatches between user mode binaries and kernel modules. If the kernel modules are built correctly as specified, post the issue on the E2E forum with the output of the gfx_check.sh script linked in earlier section.
SGX Driver Failure Modes (Run time)
Vertical Tearing/ Artifacts/ Clipping issues/ Missing objects
This could potentially be due to an incorrect usage in the OpenGL application, or point to an issue in the driver. Note that the deferred rendering mode of the SGX HW, will cause different behaviour compared to the immediate renderers found on desktops.
Please contact TI through the Linux E2E forums (https://e2e.ti.com/)
Demos are not running at required speed, How to check SGX clock rate?
If the demos are running slower than expected, check and ensure that the clock frequency set for the SGX driver is correct. This can be done by the following code in the KM kernel drivers -
File - eurasia_km/services4/system/omap/sysutils_linux.c Function - EnableSGXClocks()
You can print the SGX clock rate in debug build as below -
IMG_UINT32 rate = clk_get_rate(psSysSpecData->psSGX_FCK);
PVR_TRACE(("Sgx clock is %dMHz", HZ_TO_MHZ(rate)));
Depending on the TI platform used, this will vary from 200 to 532 MHz. Ensure that SGX is running at the right clock.
If this is right & still demos are not running with expected performance, it is needed to optimize the application, and its usage of OpenGL API.
Qt demos do not work when powerVR is enabled
1. Confirm that the GLES2 demos provided in the Graphics SDK are running properly with default SDK configuration of the window system.
- Confirm that kernel module (pvrsrvkm.ko) is successfully loaded.
3. Confirm with fbset command to check alpha to be non zero. If not set to appropriate value using fbset. QT supports 16, 32 bpp but expects alpha to be non zero for 32 bpp.
4. If above steps are correct, post to E2E forum with the output of the gfx_check.sh script linked in earlier section. Also attach the console log, with the below option enabled in the environment
"QT_DEBUG_PLUGINS=1"
Posting to E2E forum
For suggestions or recommendations or bug reports, post details of your application as below to the E2E forums (https://e2e.ti.com/), with below information:
- Output of gfx environment baseline script available below, run on the target:
https://gforge.ti.com/gf/download/docmanfileversion/203/3715/gfx_check.sh
- Details of UI application, as shown in below sheet.
https://gforge.ti.com/gf/download/docmanfileversion/220/3798/UI_graphics_reqs_sheet_v1.xls
These two outputs will help in debugging common issues.