7.3. PROFIBUS DP Slave demo setup on AM335x
7.3.1. Introduction
This article describes how to set up the AM335x PROFIBUS DP Slave with PROFIBUS master software running on a PC.
7.3.2. Master Configuration
We use ProfiTrace (Version 2.6.1 or Later) from Procentec as Profibus master. This software can be run on Windows machine and the ‘ProfiCore Ultra’ hardware should be connected between the PC and the EVM running Profibus slave application. The ProfiTrace configuration should be done as follows-
Copy PRU_OCDA.gsd file provided in the SDK package [(ISDK_HOME)\examples\profibus_slave\GSD] into master GSD library (ProfiCaptain- Settings->Add/Copy GSD to catalog)
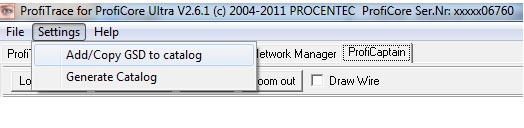
Fig 1 - Adding GSD file to ProfiTrace and generating the catalog
Use ‘Generate Catalog’ option to regenerate the catalog when the GSD file is modified (ProfiCaptain- Settings-> Generate catalog).
ProfiCore Initialization: Once the Proficore Ultra is connected to EVM, initialize the proficore using ‘Init ProfiCore Ultra’ (ProfiTrace-> Init ProfiCore Ultra). If profiTrace shows ‘Unable to detect Baud Rate’, proceed by clicking ‘OK’.
Load/Save Project: Configure the ProfiCaptian Project by drag-dropping the “AM335x Evaluation Module (EVM)” slave into the ProfiCore slave Network.Verify that the module parameters are correctly configured using ‘Setup Modules and Parameters’. Save this project in ProfiCaptain Project File (*.ppf) format (File->Save Project). This project files can be used in future for the easy reloading (File->Load Project)
Operate Master: By default, the master will not be active on the bus. When the master goes to ‘Operate’ state, it will become active by transmitting tokens in the bus.
7.3.3. Slave Configuration
EVM Configuration:
Set up the board in which Profibus Slave application is running as shown below:
ICE V2 Setup
Note
NOTE 1 - Set Jumpers between pins 2 & 3 on J18 and J19 to select ICSS mode NOTE 2 - Set jumper on J7, J8 ( pin 1 and 2) and J10. Remove Jumper on J6 as shown in Fig 2
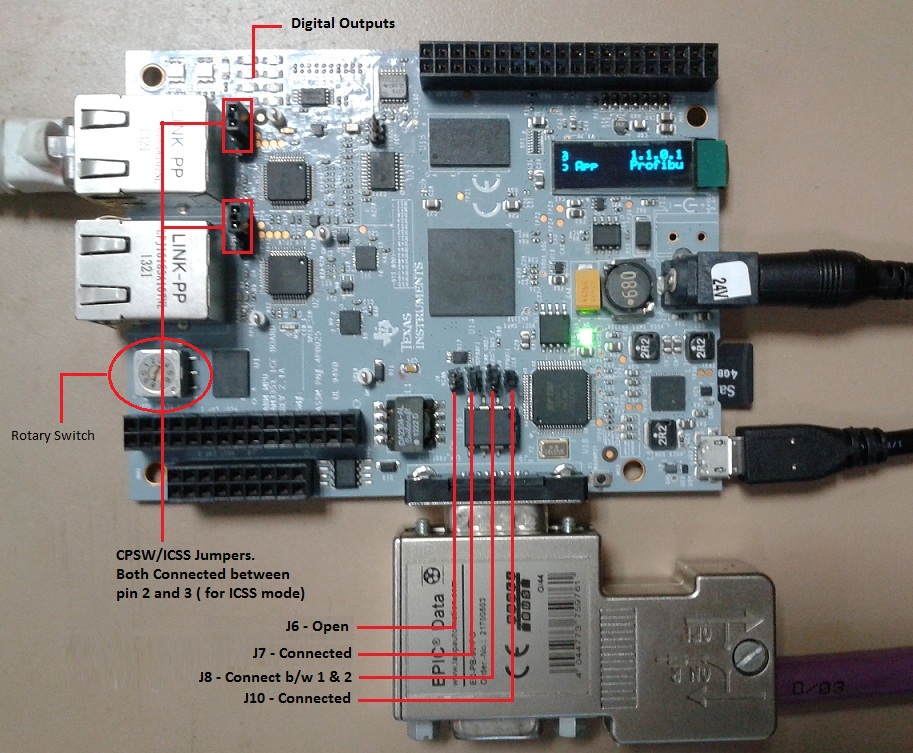
Fig 2 - ICEv2 Setup for running Profibus Slave
ICE Setup:
Note
Set Jumper on J6 (pin 1 and 2), J7,J5 and remove Jumper J4 as shown in Fig 3.
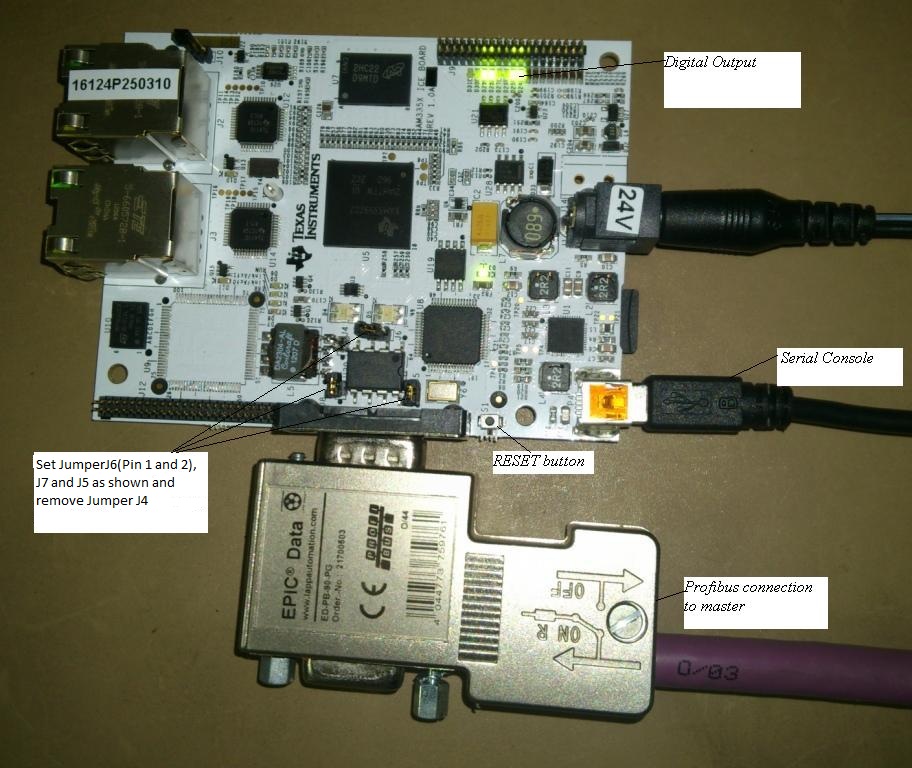
Fig 3 - ICE Setup for running Profibus Slave
IDK Setup:
Note
Connect the Proficore Ultra Serial interface to J13 of IDK as shown in Fig 4
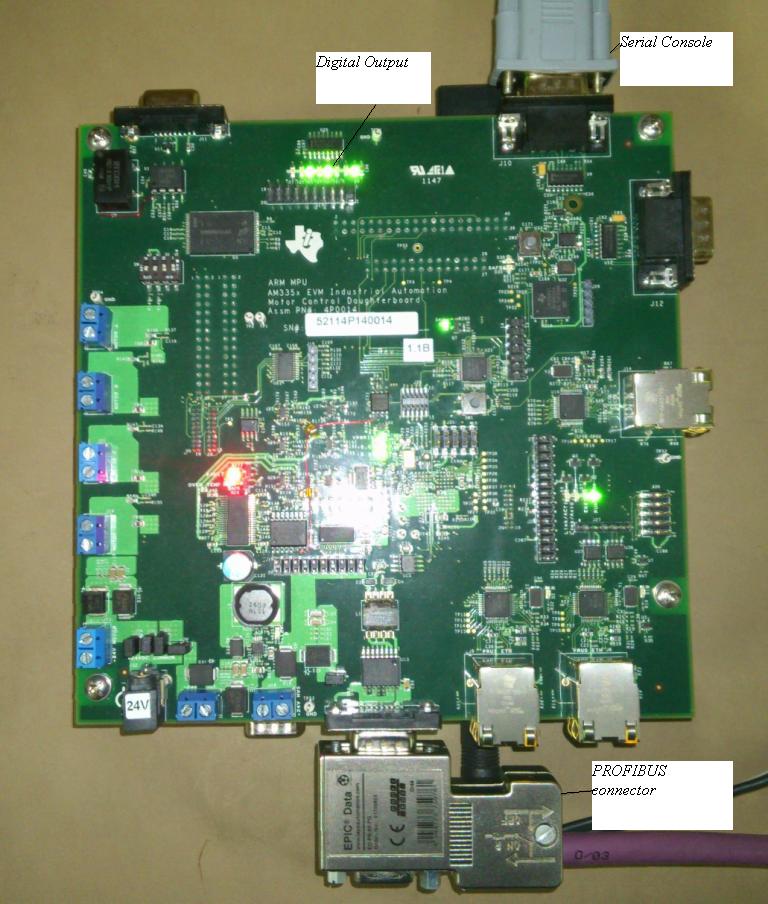
Fig 4 - IDK Setup for running Profibus Slave
7.3.4. Running/Configuring the Profibus Slave application
After powering on the board, the bootloader will load the APP from SDMMC/SPI flash into DDR/Internal RAM
The boot logs can be seen on serial console (Connect the JTAG in case of ICE boards and use DB9 serial cable to ‘J10’ in case of IDK)
Configuring the Station Address:
The procedure for configuring the station address depends on the EVM type in which the application is running.
ICEv2:
The application will detect the board type. In case of ICEv2, the station address are read based on the ‘Rotary Switch Position’ (Refer Fig 2). The rotary switch can be positioned to 0 to 9 and the application will be running with a station address which is read based on the rotary switch position as shown in Fig 6
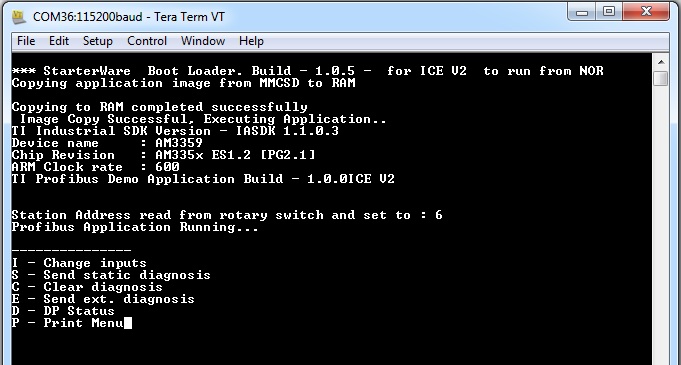
Fig 6 - UART console view for application running on ICE2
7.3.5. Communication between ProfiTrace and the Profibus Slave using the UART console Menu
Once the application started running with a configured station address, the master can detect the slaves in the network. Operate the master and the active slaves which are online will be detected and displayed with a green icon in the ProfiTrace Console as shown in Fig 7 and 8
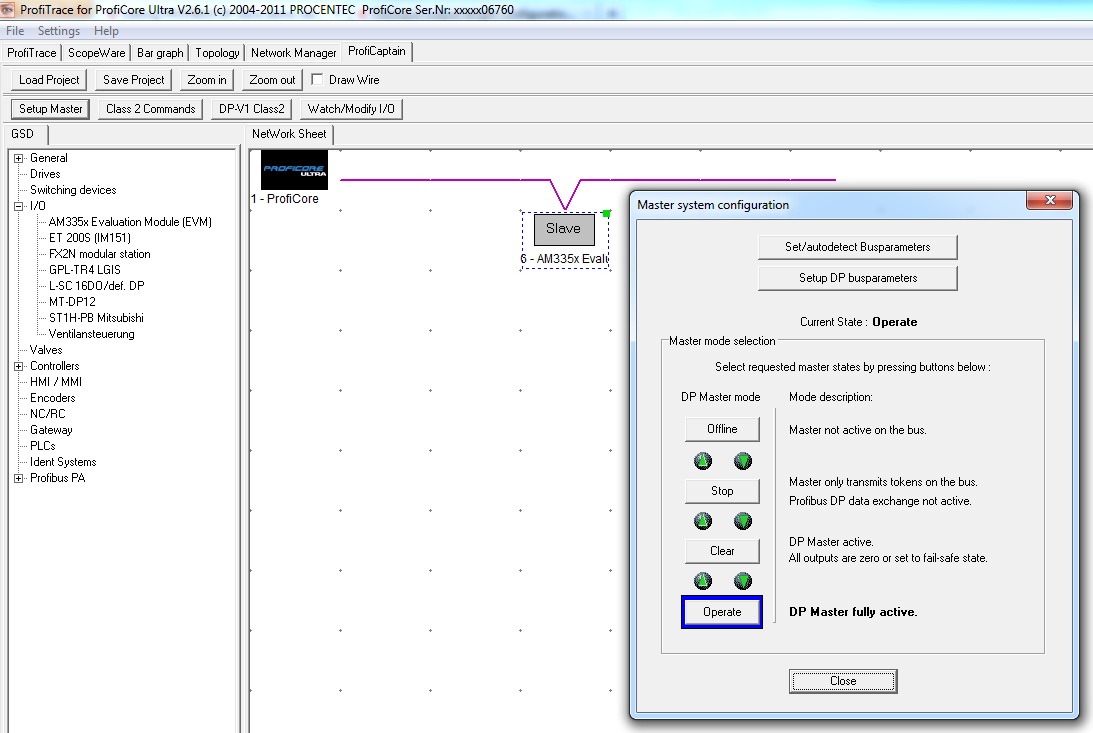
Fig 7 - Profibus Master in Operate state and detects the slave device.
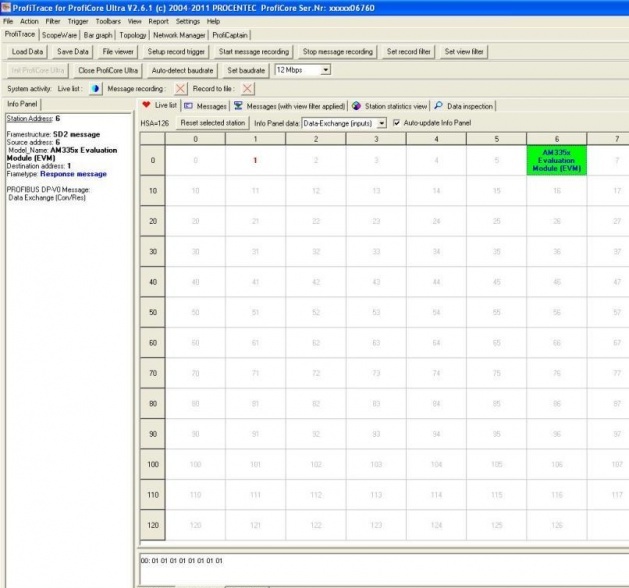
Fig 8 - Active slave devices displayed in ProfiTrace console
UART Console Menu:
UART console menu supports different options for the communication between master and slave. They are as follows-
Change Inputs:
Inputs can be changed from the slave side by pressing ‘I’ on UART console. The input changes will be communicated to the master. In the ‘Inputs and Outputs window’, input changes are reflected.
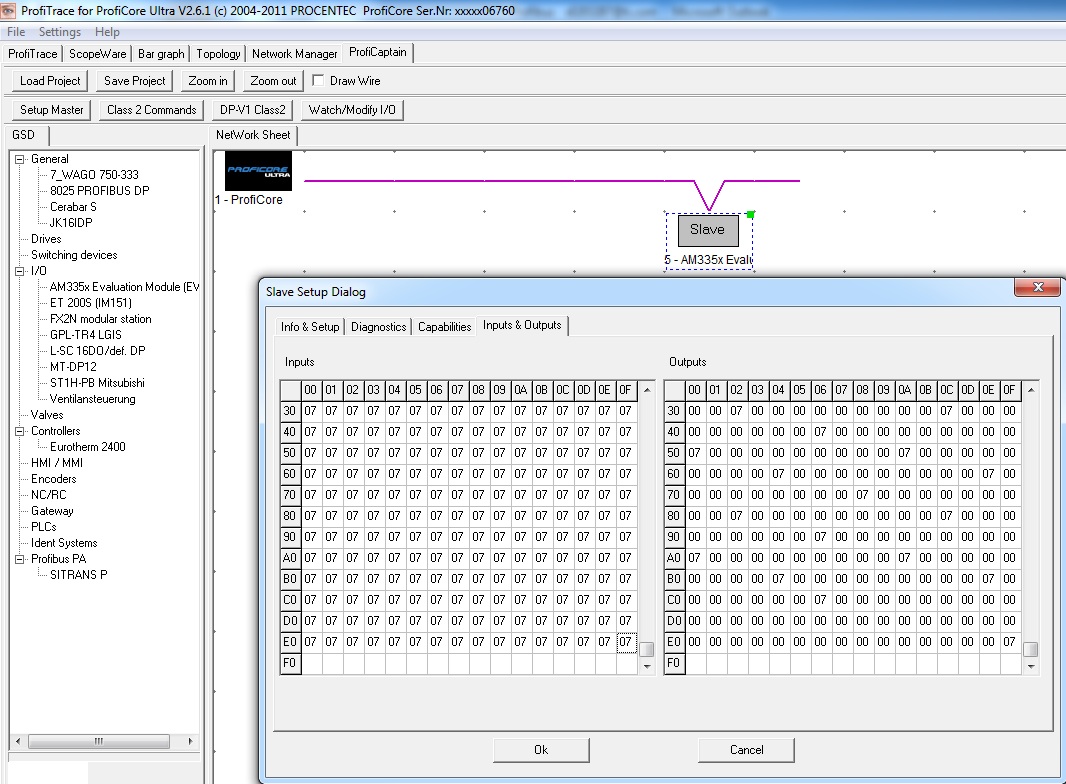
Fig 9 - Input changes are communicated to master
The input change from the slave side can be monitored via profibus DP data exachange through ProfiTrace message window (ProfiTrace-> Start Message Recording->Messages with view filter applied). Check the option ‘Stick to bottom’ to see the latest messages as shown in Fig 10
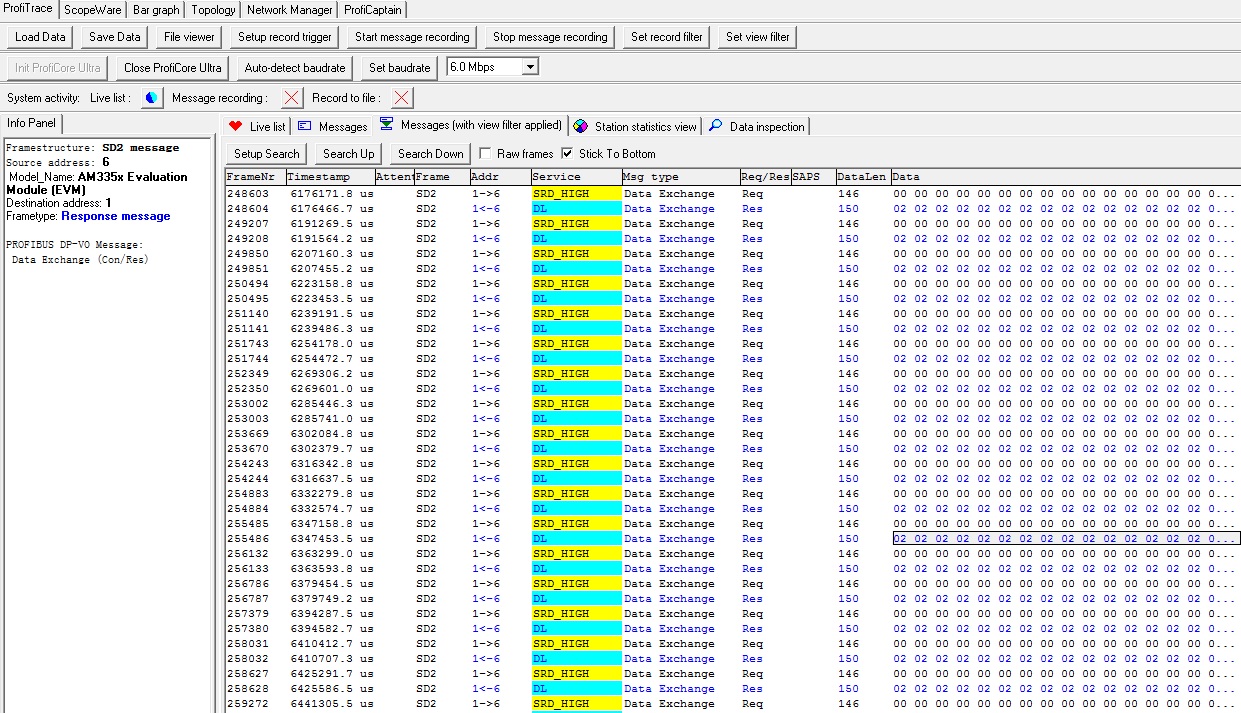
Fig 10 - Profibus DP data exchange
Send Static Diagnosis:
Profibus slave application will send the static diagnostic data to the master via using the UART console option ‘S’. We can see the diagnostic data in the message window as shown in Fig 11.
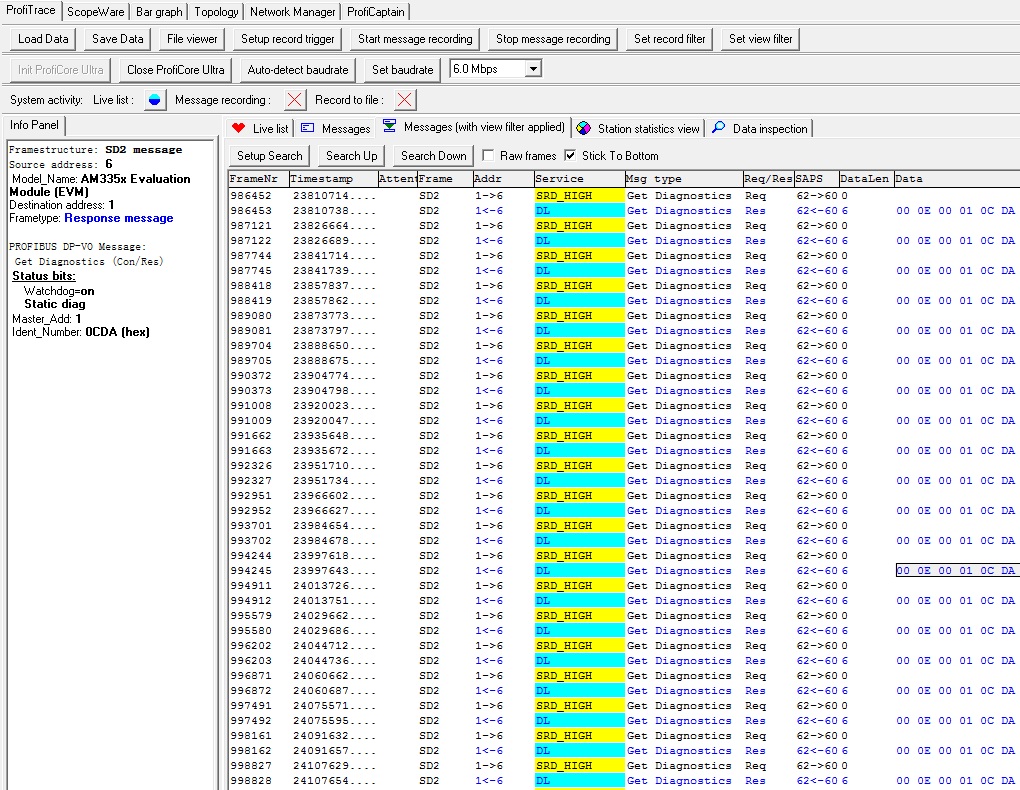
Fig 11 - Send Static Diagnostics - Data exchange view
Also we can see the ‘Static Diagnostics’ bit set in the ‘Diagnostic and Status Information’ (Launch Slave setup dialog by double clicking the slave station -> Info and setup Tab) as shown in Fig 12
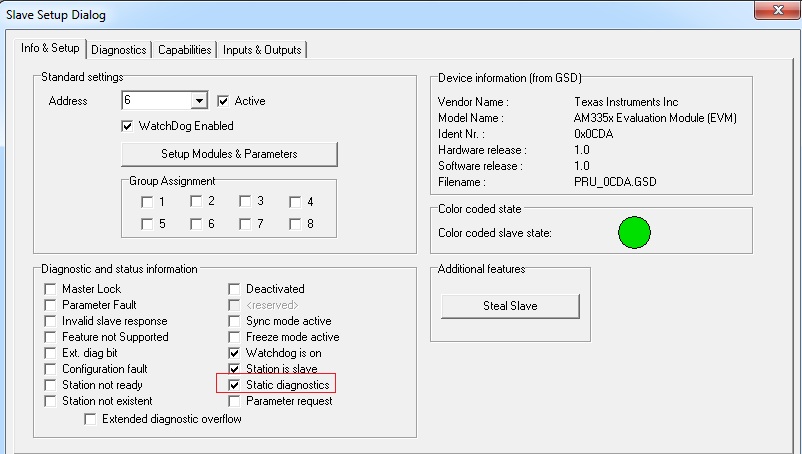
Fig 12 - Send Static diagnostics - Diagnostics information
Send Extended Diagnosis:
The slave application will send the Extended static diagnostic data to the master via using the UART console option ‘E’. The extended diagnostic message can be found in the message window (Stop message recording to see the data)
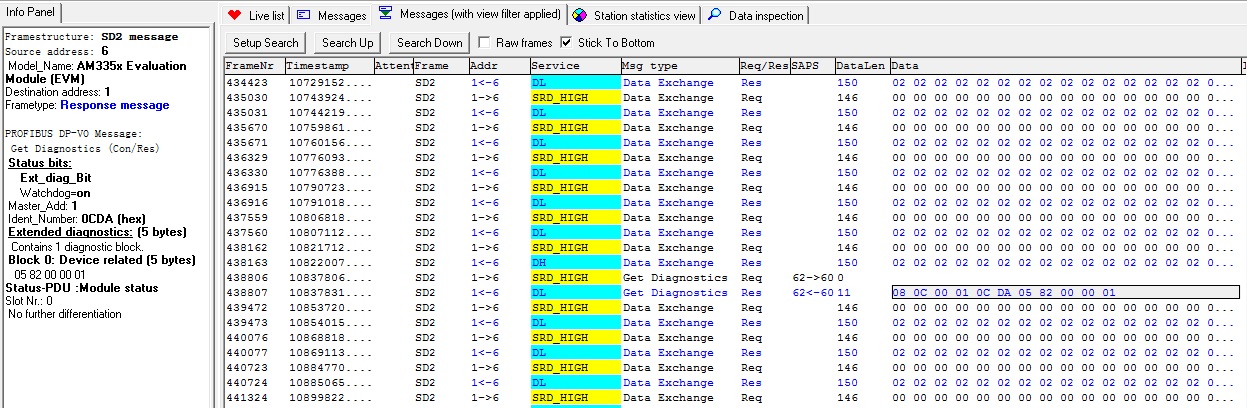
Fig 13 - Send Extended diagnostic data - Data exchange view
It contains more data than the normal diagnostics data. The extended diagnostics data can be decoded in the Diagnostics window. (Launch Slave setup dialog by double clicking the slave station -> Diagnostics Tab) as shown in Fig 14
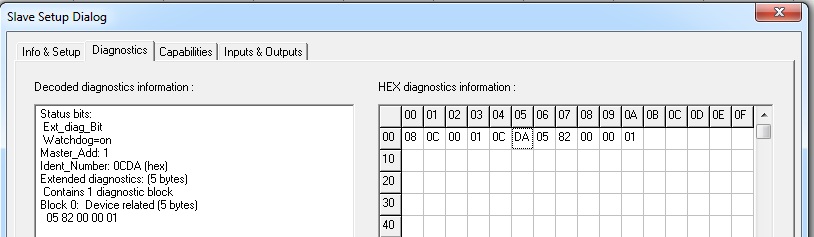
Fig 14 - Extended Diagnostic data - Diagnostics window
Clear Diagnosis:
The slave application will stop sending the Diagnostic data (Static as well as Extended) using the console option ‘C’. In the data exchange message window, we can see normal input data changes.
DP Status:
DP Status indicates the operational state/ Communication data excahnge status between master and slave. ‘D’ gives the DP status - 0x80 or 0x81 indicates the data exchanges, 0x0 indicates that data exchange is stopped. The DP status value can be decoded as shown in Fig 15
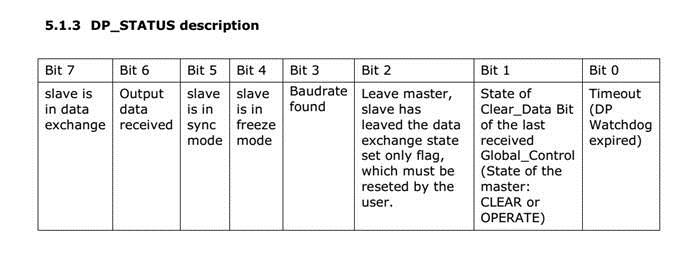
Fig 15 - DP Status Bits
Controlling the Outputs from the Master:
Profibus Master can control the output bytes in the slave by writing values to it. This is done using ‘Watch/Modify I/O’ (ProfiCaptain-> Watch/Modify/IO). Master output updates are seen on serial console and output Address 3 toggles the LEDs on top of J17 (in IDK) or below J9 (in ICE) in a pattern sent by the master on Address 3.
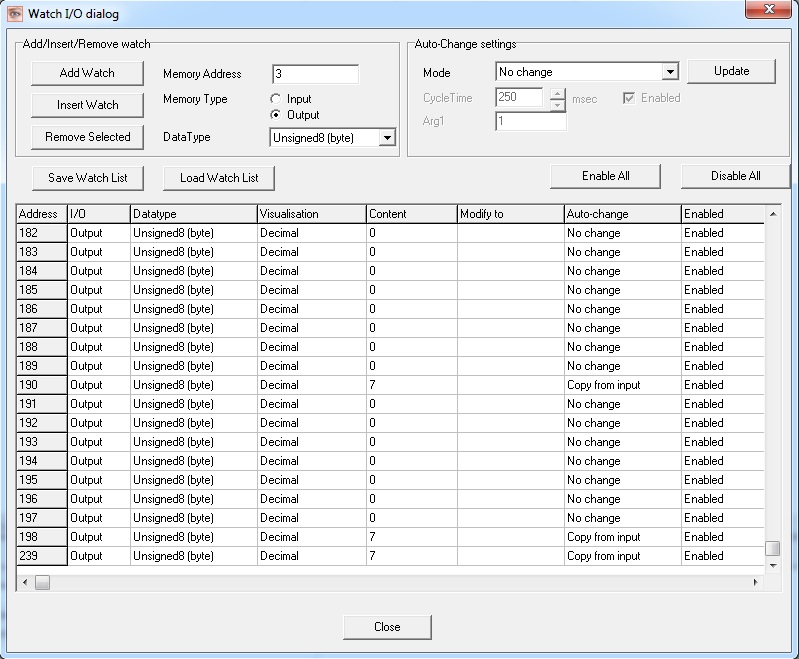
Fig 16 - Controlling the output from Profibus master
Configuring User Defined Input/Ouput length
To configure User defined length for input/output bytes, follow the procedure:
Change the INPUT_LEN and OUTPUT_LEN in main.c accordingly
Configure the ‘myCfg1’ array with character string corresponding to the number of inut/output length. As a general configuration, refer Fig 17.
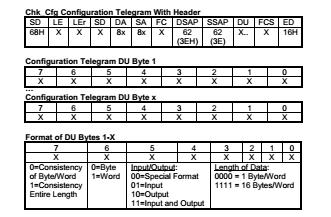
Fig 17 - Configuration bytes representation
In Fig 17, the table can be intepreted as follows:
0x5F : represents input and 32 bytes 0x6F : represents output and 32 bytes Input 150 bytes => 4*32+22 => 0x5F, 0x5F, 0x5F, 0x5F, 0x5A (11 words) Output 146 bytes => 4*32+18 => 0x6F, 0x6F, 0x6F, 0x6F, 0x68 (9 words)
Configure the GSD file matching the application
Add the updated GSD file to the master GSD library
Sample changes for configuring 150 Bytes input and 146 bytes output
- In main.c make the following changes:
- ::
#define INPUT_LEN 150 #define OUTPUT_LEN 146 const unsigned char myCfg1[] = {0x5F,0x5F,0x5F,0x5F,0x5A,0x6F,0x6F,0x6F,0x6F,0x68 };
In the GSD file, use Module = “150 Byte Out, 146 Byte In ” 0x5F,0x5F,0x5F,0x5F,0x5A,0x6F,0x6F,0x6F,0x6F,0x68 and add to ProfiTrace GSD library.
Go offline in master side, Drag a AM335x ICEv2 EVM to the ProfiCore slave network.Verify that the module parameters are correctly configured using ‘Setup Modules and Parameters’.
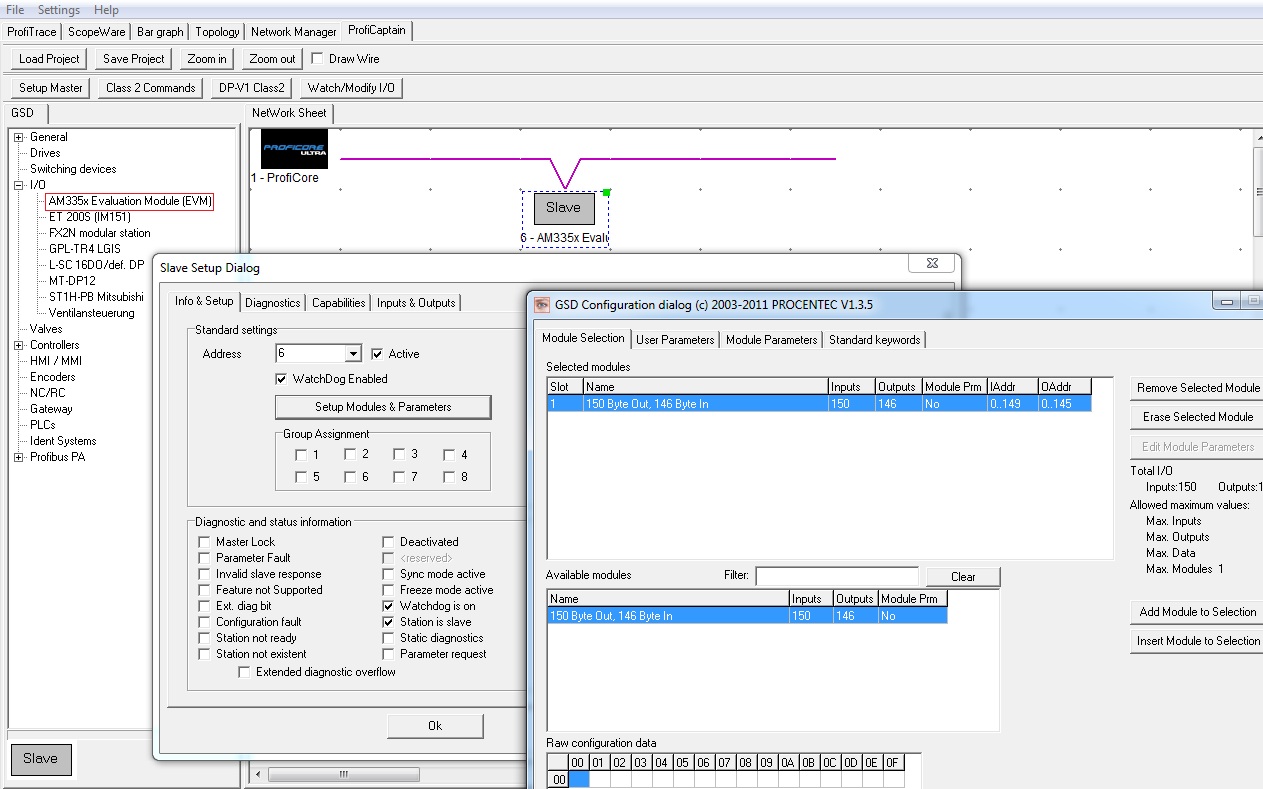
Fig 18 - Configuring the module parameters when there is a change in Input/Output data length
If the added slave is preconfigured with some wrong station address, edit the station address by double clicking the station.
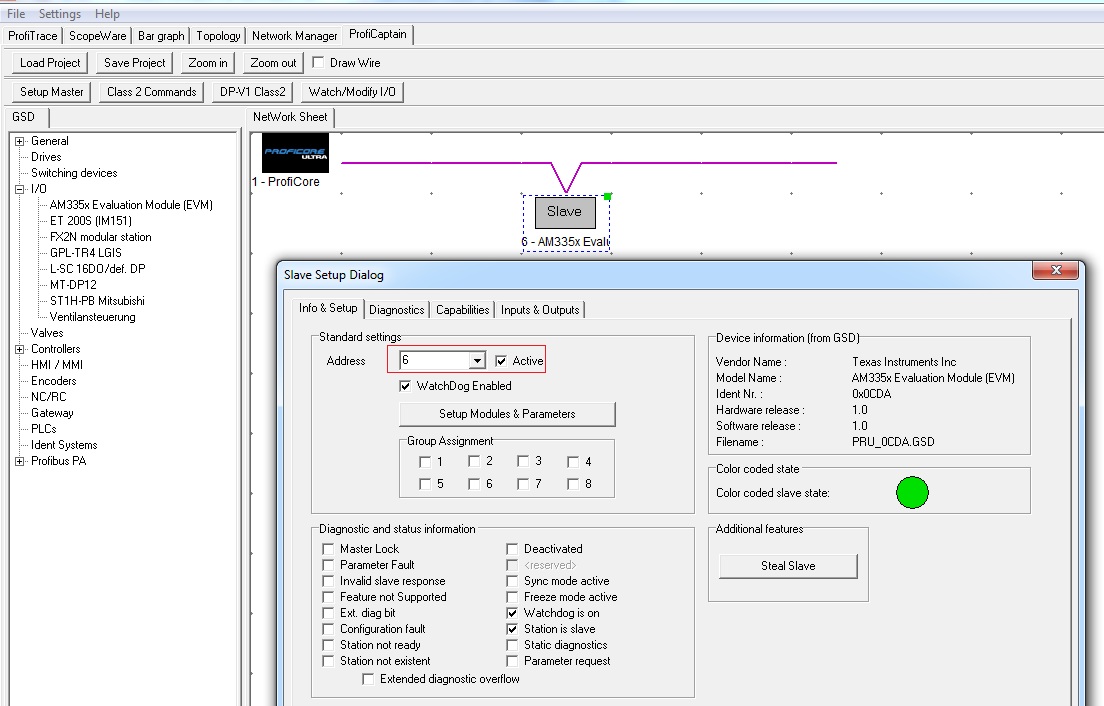
Fig 19 - Configuring the correct Station address in Master.
Verify that the input chages are communicated to the master. Also the master should be able to control the outputs. For the 150 bytes inputs,146 bytes outputs the input/output configuration looks as follows:
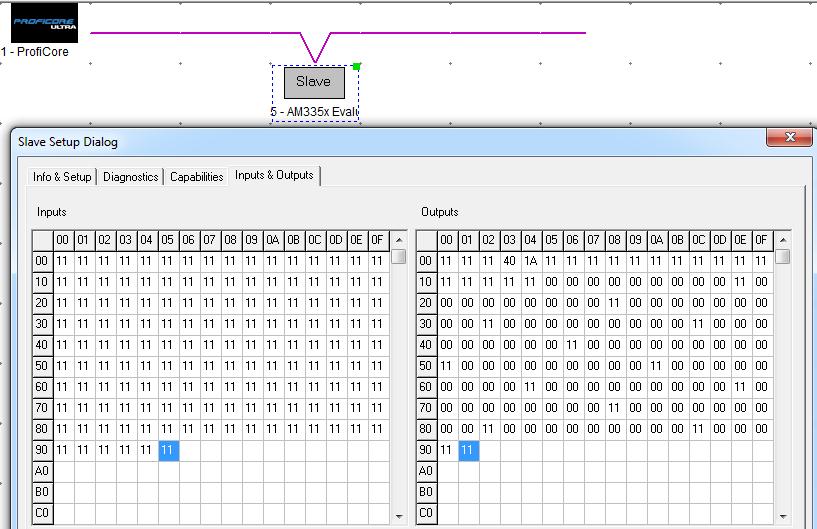
Fig 20 - Input/Output changes shown simultaneously