Waveform Plotting
Waveform Controls

Fig. 10 Waveform Controls
To control the waveform data, use the Start/Stop button on the Control Panel at the top of the Waveforms tab.
The Start button notifies the target via HID command to initiate data transfer, while the Stop button notifies the target to stop transfers. The Waveform Plots will show data at the rate that the target sends it, which can ramp up to 40 Hz with minimal UPS0 to UPS1 and UPS DNS delay.
The “Lock All” / “Unlock All” button allows the user to lock or unlock all three graphs. The lock functionality exists to freeze a graph’s viewing in time while still receiving data in the background. This can be used to inspect one section of data via the zoom or tooltip functionality. To lock or unlock a single graph, double click the graph.
The Save Waveforms button allows the user to choose an output file to save the current waveform log data in .csv format to a chosen location. This data can also be saved automatically by going to the Options item in the main menu bar, selecting Logging, and enabling “Automatically Log Data”.
The “Reset Graphs” button will reset both the graph data on the screen and the timestamps on logging GUI-wide. This functionality exists to allow the user to start a fresh graph data set. If auto-logging is enabled, this will also end the current automatic logging session and start a new one.
The “Adv. Calibration Table” checkbox allows the user the enable or disable the calibration look up table in the application. The calibration look up table is generated after the calibration process is completed. For more information on how to calibrate the system see the Calibration Section. When this checkbox is selected the application running on the target will check if there is a valid (non-zero minimums, for N ranges the (min of range i) < (min of range i+1) where 0 < i <= N) table stored in memory. If the table is valid it will enable it, otherwise the checkbox will be deselected.
Waveform Viewing
USS GUI provides three waveform graphs: Delta Time of Flight, Absolute Time of Flight, and Volume Flow Rate.
The Absolute Time of Flight graph contains two different channels, DNS and UPS.
The Delta Time of Flight and Volume Flow Rate graphs provide a single channel of information.
Zooming and Tooltips
To zoom in on a data set, left click and drag the mouse from top-left to bottom-right on the data that you want to enlarge. Zooming in on a graph will lock its viewing panel, although data will continue to be received for once the graph is unlocked.
To zoom out on a graph, drag the mouse from the bottom-right to the top left. The amount dragged will correspond to the amount unzoomed.
Individual graphs can be locked or unlocked by double clicking on them.
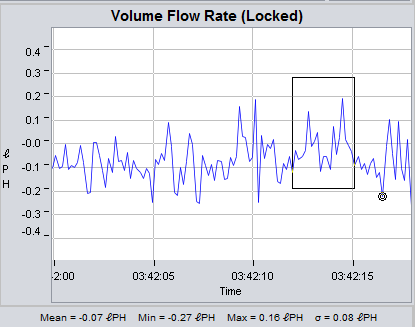
Fig. 11 Zoom Control
To find the value of a single data point, hover over the point to show a tooltip frame with the X, Y value of the point. These tooltip frames only appear for data points; they do not appear for interpolation lines.
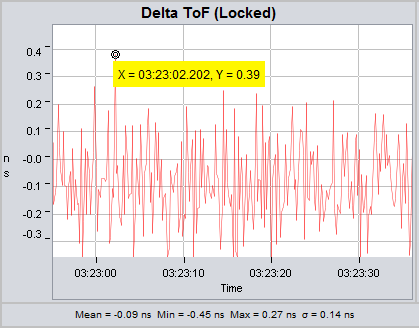
Fig. 12 Tooltips
Statistics
Statistics are enabled for the Absolute ToF, Delta ToF, and Volume Flow Rate graphs. These calculate the mean, min, max, and standard deviation of the last N samples, where N is set in Waveform Options and defaults to 100. By default, graphing of the mean line is enabled; this can also be disabled per-graph in Waveform Options.
Integration over time is provided as a statistic for the Volume Flow Rate graph. To start, stop, or clear the current integration value, use the corresponding buttons below the graph.
Waveform Options
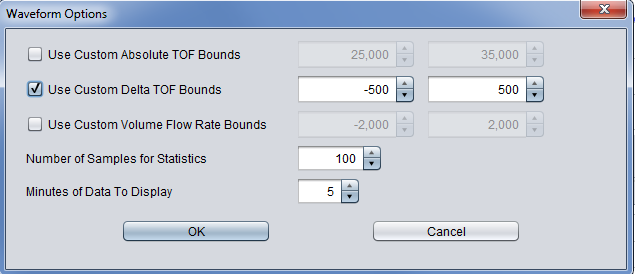
Fig. 13 Waveform Options
To choose a custom Y range for any of the three graphs, select the number of minutes of data displayed, or select the number of samples used for statistics, right-click on any graph and click “Graph Options”. This menu can also be accessed from the main menu bar under Options → Waveform Graph Options.
Here, you can enable a custom Y range for a graph by selecting the “Use Custom Bounds” checkbox next to the graph name, then choosing a custom range in the corresponding min/max spinners and clicking “OK”.
Additionally, you can select the number of samples used for statistics calculation in the Absolute TOF and Volume Flow Rate graphs, or the minutes of data displayed for all graphs. The minutes displayed can vary from .25 to 60.
The maximum amount of points that can be displayed per point vector is 144,000 (allowing for sampling at 40 Hz for an hour), or 576,000 points displayed over the four total vectors.
Please note that showing large amounts of data, or using large amounts of sampling points, can impact GUI performance, especially showing large amounts of densely sampled data. If the system is running poorly for densely sampled data with a long time period displayed, consider lowering the time displayed. This will not delete the data; the last hour of data is retained regardless of the amount of time currently displayed.
More Information
- For more information on the application, and available evaluation kits, see the download page.
- For technical support, email the USS GUI support team or visit the MSP430 E2E forum