6.3. Analysis and Optimization Tools
CCS includes several productivity tools and views to help you analyze and optimize your application. Some of these are described below.
6.3.1. Memory Allocation View
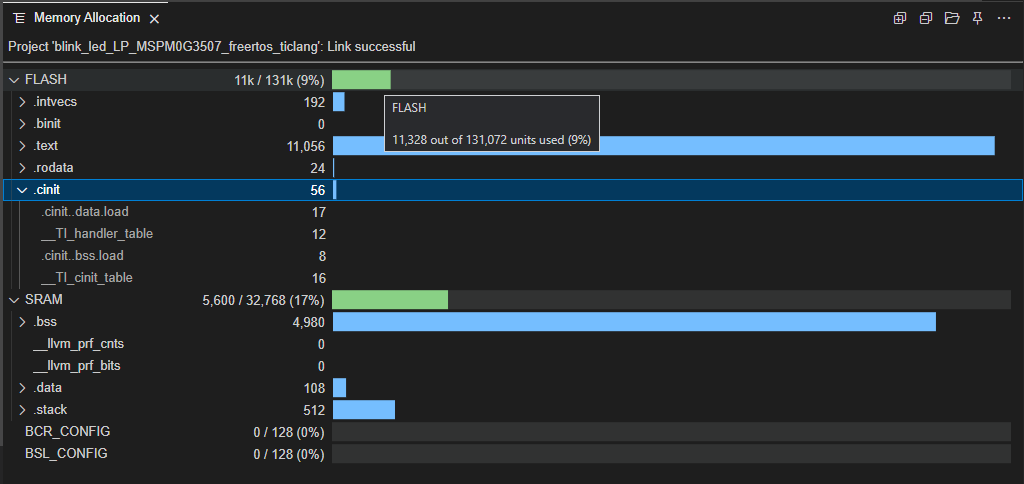
The Memory Allocation view provides a graphical representation of how much memory is consumed by your application. It is a quick and easy way to see how much Flash and RAM is being used by the application without having to dig into the details of the linker map file.
To open the view go to the View main menu and select Memory Allocation.
By default, the view shows the memory used relative to the total available memory for the CCS project that is active in the Explorer, as long as the project has been successfully built. You can expand each memory region to see how much memory each individual section or sub-section is using.
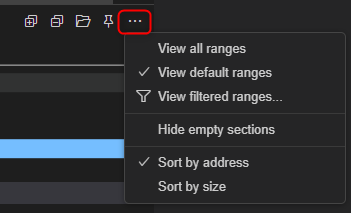
The view can be customized to filter/sort data as desired. This can be configured under the More Actions... options:
You can also view the memory allocation for any project for which you have access
to the TI link-info file (even if the project is not open in the workspace).
Use the Open TI link-info file in the Memory Allocation view to open the TI link-info file (linkInfo.xml).
The linkInfo.xml file is generated by the TI linker with the --xml_link_info linker option,
usually enabled by default for most TI example projects.
6.3.2. Stack Usage View
The Stack Usage view provides a static view of the maximum stack which will be used by the program based upon a static analysis of the call tree and stack usage of each function. This differs from the Memory Allocation view, which shows how much memory has been allocated for the stack by the linker.
The information for the Stack Usage view is generated on project build and displayed as a function call tree with stack usages for each function in a horizontal bar graph.
To open the view go to the main menu View and select Stack Usage.

The view shows Exclusive Size and Inclusive Size by Function. The Exclusive Size is the amount of stack required by that function, ignoring any functions it may call. The Inclusive Size is the amount of stack required by that function, plus the amount of stack required by all the functions called by that function, applied recursively. So, if f1 calls f2, which calls f3, which calls f4, and so on, the amount of stack required by each of those functions is added in for the Inclusive Size.
The size values shown in the view are in bytes.
The color shading indicates whether you are close to the limit of available stack space (shown as yellow) or not (shown as green). To avoid hitting the limit, you could free up some stack usage or increase the system stack size. A read ! icon next to a function name indicates an indirect call.
Hovering the mouse courser over a function or bar graph will display additional information related to the selection.