7.1. Debug Overview
This section provides a summary of the CCS Theia debug system and the debug process for a typical embedded software program.
Embedded software debugging is the process of evaluating the behaviour of an application that is placed in its target environment and subjected to different boundary conditions. The debugger and its supporting hardware elements assist in providing tight control over the execution and complete visibility over the internal aspects of the target environment, so it allows to detect errors or modify behaviours of the application.
In the CCS Theia environment, the debug is the next step after the project build which, after a successful assemble/compile/link process, allows the application executable file to be loaded to the target environment for debugging.
Debugging can also happen in a system that has code already loaded and running, typically on advanced stages of the product design or with a finished product. These two methods are fundamentally identical with only procedural differences that can be seen in the section Launching a debug session.
7.1.1. The Basic Elements
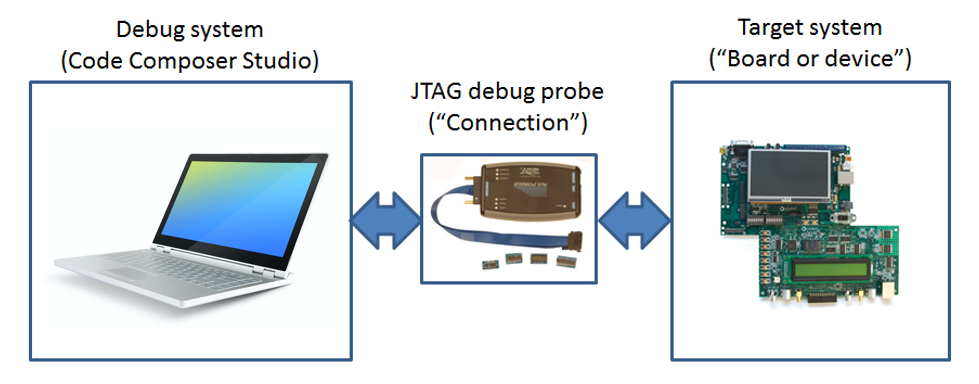
The physical debugging setup is shown above, with the two main components involved during a debug session:
- The connection is the piece of hardware between the host PC that runs CCS Theia, and the device or board where the code is supposed to be executed. Throughout this document, the connection will also be called the Debug Probe.
- The Board or Device is the hardware that contains one or more devices required for the executable to run. Throughout this document, it will be called the target.
This setup, when used with CCS Theia, allows the host PC to communicate with the target, load data and code, control the execution of the program loaded via breakpoints and step operations, as well as read data back to the host PC to be displayed in views such as Watch/Memory/Disassembly.
To properly make CCS Theia aware of the physical aspects of the debugging environment, a Target Configuration file must be created. This file is populated with the appropriate Debug Probe type (XDS, ICDI or MSP-FET) and host interface (USB or Ethernet). This file also contains the exact specification of the Device or Board being used.
Once the Target Configuration file is created and all the appropriate hardware is connected and powered up, the debugger is ready to be launched.
7.1.2. The Launching Process
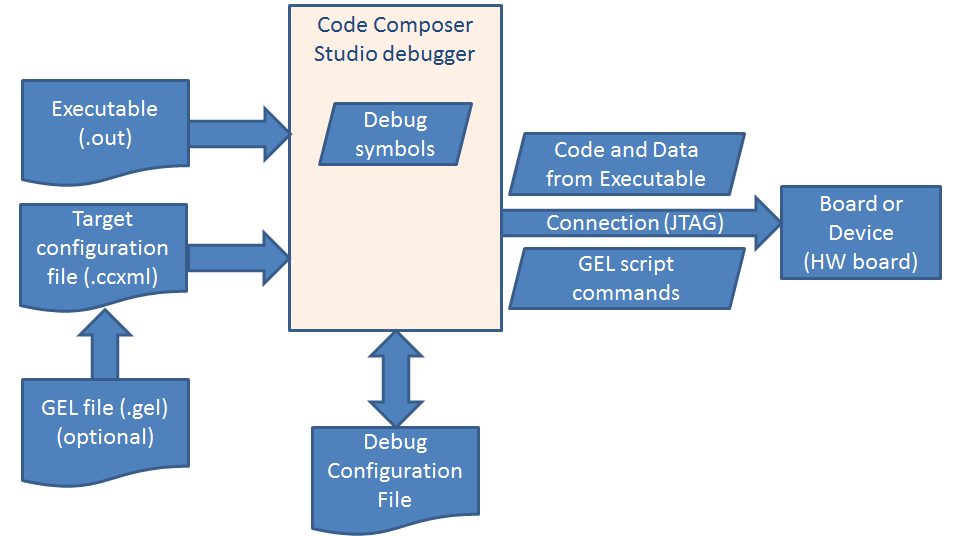
The elements of the debug subsystem are shown above and are processed in the following manner:
- At launch, CCS Theia switches to the Debug view with many panels that are useful for the debugging process.
- CCS Theia then parses the Target Configuration file, creates a debug/launch configuration, and uses the information in these two files to connect to the JTAG debugger and communicate to the device in the target.
- Once this communication is established, the CCS Theia debugger starts executing a series of hardware initialization commands from a GEL script (if one is configured in the Target Configuration file).
- If loading an executable, the CCS Theia debugger splits the information of the executable file:
- The contents of both code and data sections are sent through JTAG and stored in the appropriate memory locations of the device/board. The placement of this code follows the directives in the Linker Command File.
- The debug symbols are kept on the host PC to allow for correlating the memory addresses of the device/board with the source code of the project.
- The process is the same whether the code is being downloaded to RAM or Flash. For Flash based devices, the built-in flash programmer automatically handles the flashing process.
- The CCS Theia debugger performs one last step: it automatically sets a breakpoint in the device memory address that corresponds to the function main() and runs the device until it breaks at it.
Note
The last step is optional and depends on the debugger settings.
Once the launch process is finished, the debugger is ready. It keeps the target halted - waiting for additional interaction and inspection from the user.
- The interaction can be done by issuing commands such as Continue, Pause, Step Into, Step Over, setting breakpoints, among others
- The inspection can be done by opening the various views such as Disassembly, Memory, Register, among others
The iterative process of debugging and modifying the application can be done by simply rebuilding the project and reloading the code to the target.
7.2. Configuring the Debugger
This section covers in detail the two elements responsible for the debugger configuration in CCS: Target Configuration files and the Debug Configurations.
7.2.1. Target Configuration Files
As mentioned in the Debug Overview section, Target Configuration files are responsible for describing the physical aspects of the debugging environment.
The Target Configuration file is a plain text XML file, with a .ccxml extension, that contains all the necessary information for a debug session: the type of Debug Probe, the target board or device (or even multiple devices), and (optionally) a path to a GEL (General Extension Language) script, which is responsible for performing device and/or hardware initialization.
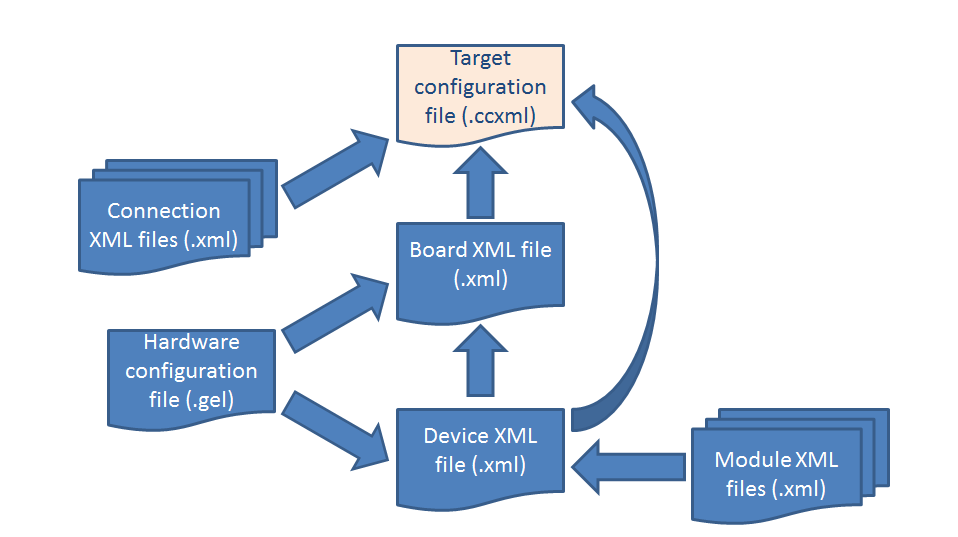
As shown above, the Target Configuration file includes one or more connection XML files (one per each core and JTAG entity, but all of them tied to the chosen Debug Probe) and either a Board XML file (which contains a Device XML file plus the GEL script for the board) or a Device XML file directly (which may or may not contain a GEL script). The Device XML file contains the internal JTAG structure of the device and can optionally include several Module XML files, which describe a device’s peripheral registers.
Warning
Target Configuration files can also be directly modified in a text editor. This is not recommended for standard users as improper editing can result in a corrupted file.
Despite the complexity, there are two simple ways to create the Target Configuration file: Automatically or Manually.
7.2.1.1. Automatic Method
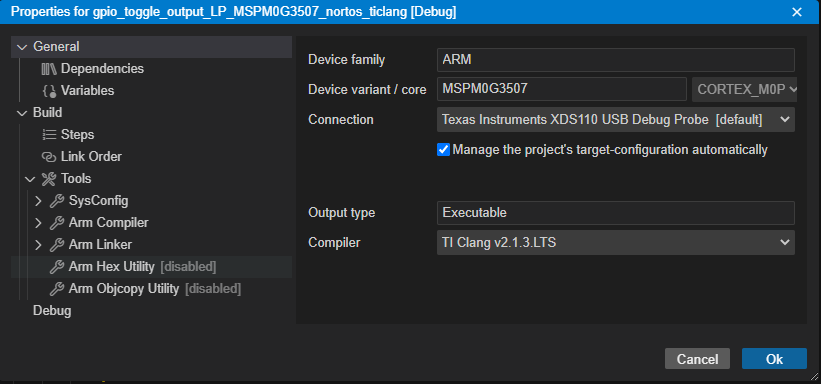
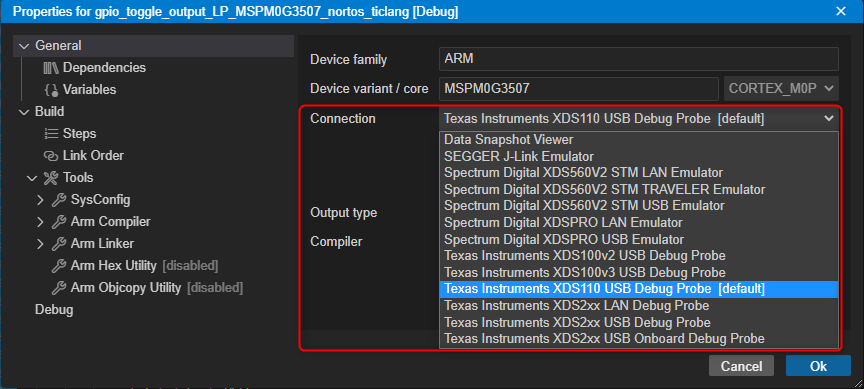
Target configuration files are typically generated and managed by the project, based on the Device variant and Connection types specified in the General Properties of the project (See the section: General Properties). While the Device variant cannot be modified, the Connection type can be modified. If the Connection type is modified to use a different Debug Probe, the Target Configuration file will be re-generated to reflect the change unless the Manage the project's target-configuration automatically option is disabled.
Existing project:
- The file is placed in a subdirectory named targetConfigs inside the project directory
- This method is very simple as it automatically assigns the correct device and set it as the active target configuration for the project
7.2.1.2. Manual Method
This method creates a Target Configuration file by manually invoking the Target Configuration Editor.
The Target Configuration Editor is a GUI inside Code Composer Studio Theia that allows creating and modifying Target Configuration files. It also allows configuring advanced aspects of the Debug Probe and the target, as well as creating configurations for complex devices (with multiple cores) and boards (with multiple devices in the same scan chain).
- The file can be placed in an arbitrary directory in the system. By default it is the subdirectory ti/CCSTargetConfigurations inside the user area. The location may be changed from CCS menu File → Preferences → General Settings → Extensions → CCS -> Target Configurations: Directory (Workspace)
- This method allows for creating configurations for more complex devices or boards.
- The Target Configuration editor can also be used to edit the file that is automatically created with the previous method.
To create the Target Configuration file manually, simply launch the Target Configuration Editor:
- From the Target Configuration view (at the bottom of the Debug view), click on the New Target Configuration button
 .
. - From the Explorer, click on the New File button and select a name with a
.ccxmlfile extension. This will create a new Target Configuration file in the root location of the current project and open it in the Target Configuration Editor.
7.2.1.3. Advanced Target Configuration Options
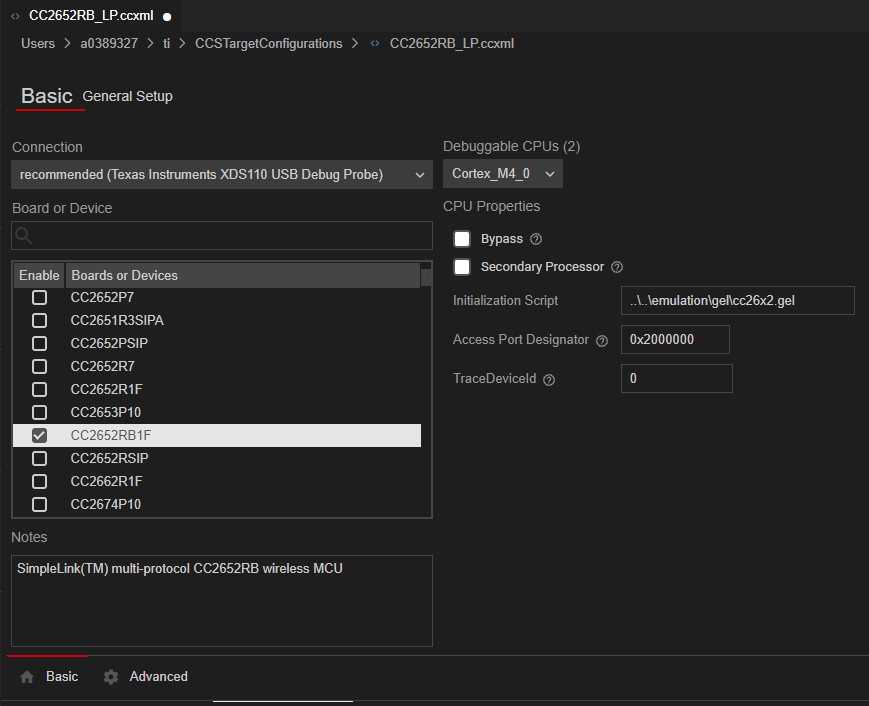
The procedure above mostly covers the Basic tab of the Target Configuration editor.
The Advanced tab allows configuring important Connection Properties of the Debug Probe (mode of operation, clock speed, special signaling, endianness, among others), the device’s internal JTAG structures (addresses, ports, cores), and the addition/removal of GEL startup files. The properties available will variy depending on the connection/device type.
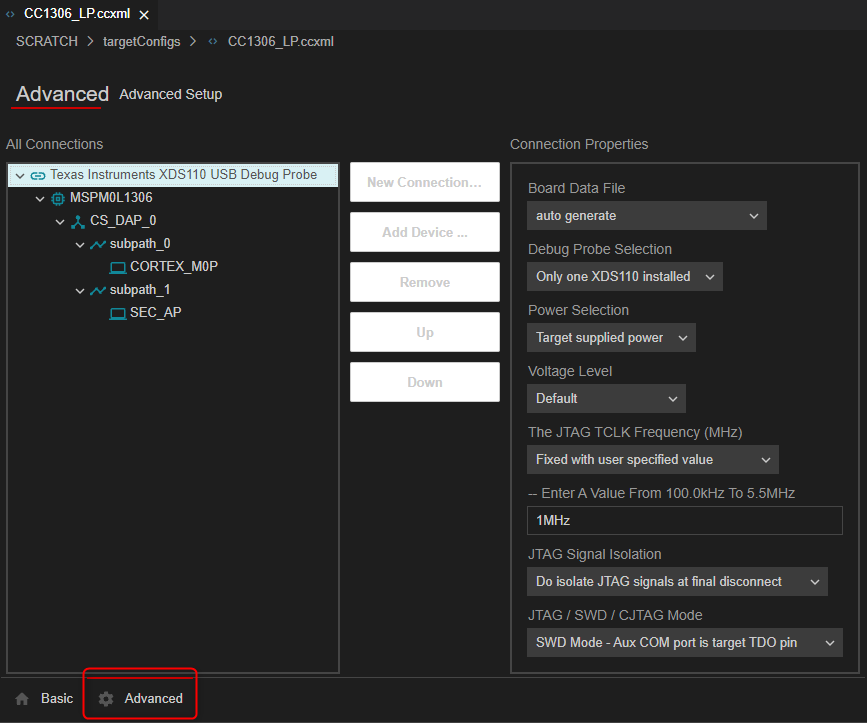
- One of the most common Debug Probe settings is the clock speed.
- GEL files are typically auto-configured to all board configurations and several devices (when applicable), therefore only need to be added/modified if a specific demand is required. If such editing is required, check the section Adding GEL Files to a Target Configuration.
- Another important setting is the JTAG Mode of operation (JTAG, cJTAG, etc.) of all XDS Debug Probes (except XDS100v1 and XDS100v2). Additional details can be found at the section Debug and trace usage modes of the XDS110 and XDS200 pages.
- This tab also allows to manually specify a Board Data File. Although not typically used, this setting is important under certain circumstances.
There are also buttons to add New Connection ... and Add Device .... This allows for creating a target configuration from scratch all from the Advanced tab or adding additional connections/devices to an existing target configuration. These options are needed if working with a custom target that has multiple devices on the same JTAG scan chain or if you wish to debug two different boards (with two connections types) in one debug session. There are other buttons to Remove a selected connection/device, move a connection/device Up or Down, and a button to Rename the selected connection/device/router/core.
7.2.1.4. Target Configuration View
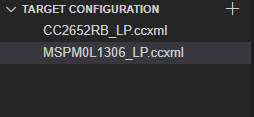
The Target Configuration view (available in the main Debug view) will display all target configuration files found in the currently sepcified Target Configurations directory. Target configuration files here can be easily managed from this view, including renaming/opening/deleting configurations and even launching a debug session for it.
The top toolbar contains a button to create a New Target Configuration .
Selecting a target configuration and bringing up the right-click context menu contains the following options:
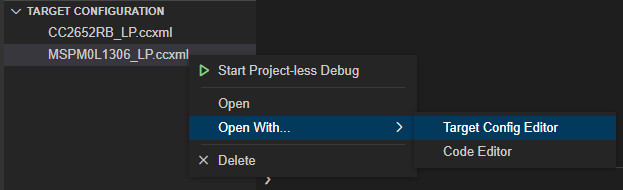
- Start Project-less Debug This will launch a debug session for the selected target configuration.
- Open This will open the selected target configuration in the Target Configuration Editor.
- Open With This will allow the user to open the selected target configuration with either the Target Configuration Editor or the Code Editor. Selecting the latter will display the file in raw XML format.
- Delete This will delete the selected target configuration.
7.2.2. Launch Configurations
A launch configuration (also known as a debug configuration) is used to configure the debugger when a debug session is launched. This information is typically auto-generated by the IDE and stored in a launch configuration JSON file (launch.json) located in the .theia folder in your workspace.

The launch.json file can be easily accessed from the Open "launch.json" button in the Debug View.
Launch configurations in CCS Theia work in a similar way as they do with VS Code. Please refer to the VS Code documentation for Launch Configurations for more details.
While majority of users will not need to manually modify the generated launch configuration, there may be some cases where this may be needed - such as specifying to only load symbols (loadSymbolsOnly) to debug a project that has the target application already flashed.
The below options are applicable for a CCS Theia launch configuration (not all options are required):
name: String value of the launch configuration name.
type: String value of the Debug type. ccs-debug is the default value and signifies a CCS debug session. No other debug type is currently supported.
request: String value of the launch request type. launch is the default value. No other launch request type is currently supported.
targetConfig: String value of the Target configuration CCXML absolute file path. If a project is provided, the CCXML file within the project will be used, if one is not found in the the project, the value of this property will be used.
initializationScript: String value of the CCS Scripting JavaScript absolute file path. It will be executed when a debug session is launched. It can be used to initialize the target, pass parameters, etc. This is useful if you wish to run a custom set of steps during debug launch.
projectInfo: Object that can contain the below information for a project (if a project debug session is launched):
- name: String value of the project name. This field is managed by CCS and should not be manually modified.
- resourceID: String value of the project ID. This field is managed by CCS and should not be manually modified.
- loadSymbolsOnly: Boolean value that determines if only symbols should be loaded. By default, value is false, so both program and symbols will be loaded. Only used for debugging this particular project.
groupInfo: Object that can contain the below information for a group in a debug session:
- name: String value of the group name.
- syncMode: Boolean value which determines if sync mode is enabled for the group. Default value is false.
- cores: Array of strings for the core names in the group. See Advanced Target Configuration Options to find the name of the core.
connections: Object that can contain some additional connection information:
name: String value of the connection name. See Advanced Target Configuration Options to find the name of the connection.
cores: Object that contains the below information of the cores in the connection. Each core object has the following properties that can be configured:
- name: String value of the debug core name. See Advanced Target Configuration Options to find the name of the core.
- program: String value of the program absolute file path, required for project-less debugging.
- loadSymbolsOnly: Boolean value that determines if only symbols should be loaded. By default, value is false, so both program and symbols will be loaded. Only used for project-less debugging.
- hidden: Boolean value that determines if the core should be hidden, used for project-less debugging. Default value is false.

7.2.3. Debug Properties
There are many settings that define the debug properties, such as Program/Memory Load Options, Auto Run and Launch Options, and Chip Flash Settings, to name a few. This section describes the more commonly used debug settings.
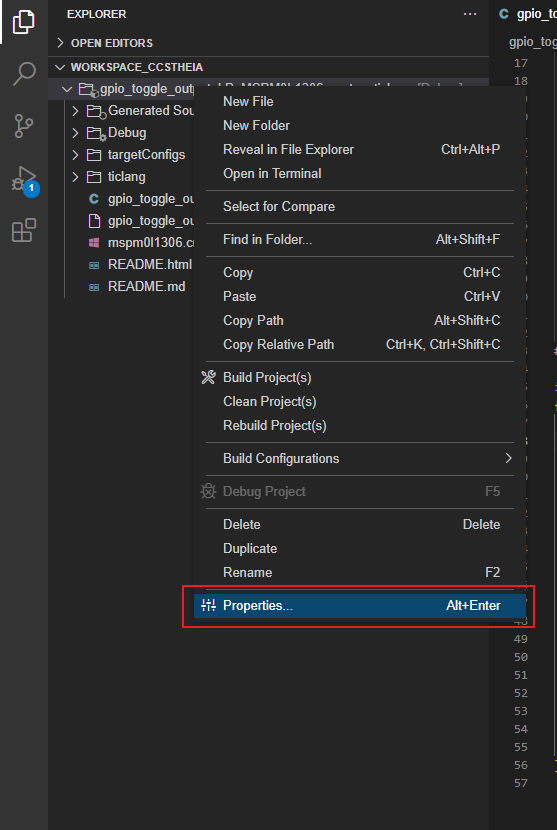
The settings can be viewed and customized through:
- In Explorer, Right-click on a project and go to Properties → Debug (In the panel on the left), or
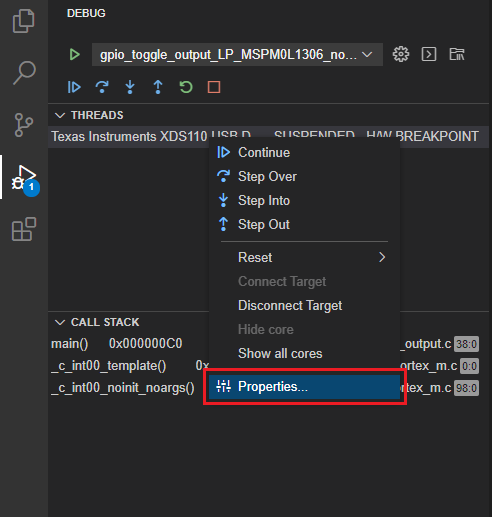
- In an active debug session, go to the Threads panel on the left side of the Debug view. Right-click on a debug context and go to Properties → Debug (In the panel on the left)
7.2.3.1. Program/Memory Load Options
This category defines settings related to program/memory loading, verification options, connection options, disabling interrupts, and resetting/restarting target during load.
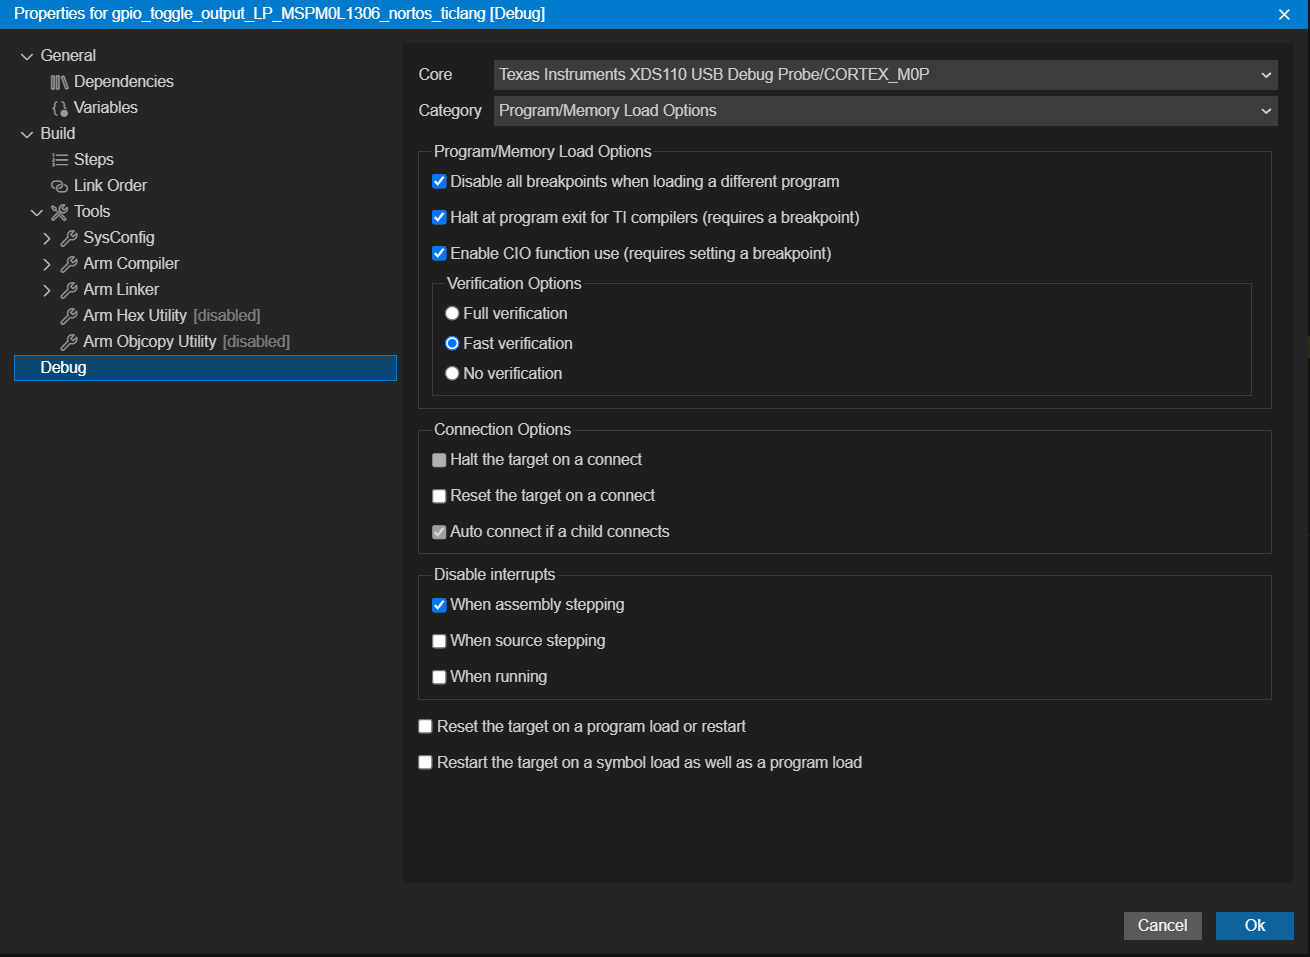
Program/Memory Load Options:
- Disable all breakpoints when loading a different program: When loading a different .out file in the same debug session, toggles between maintaining the status of breakpoints previously set or disabling them. This option is enabled by default.
- Halt at program exit for TI compilers (requires a breakpoint): (TI Compiler) When enabled, sets a breakpoint at the end of program to allow debugger to halt there. This is only functional when using a TI compiler, which has the predefined symbol
C$$EXITorC$$EXITE. For code in Flash, enabling this option would require the use of a hardware breakpoint resource. - Enable CIO function use (requires setting a breakpoint): (TI Compiler) When enabled, allows having Console I/O output in the Console View by using a breakpoint. For code in Flash, enabling this option would require the use of a hardware breakpoint resource.
Verification Options: After the code/data is loaded to the device, sets the level of verification performed on it. This is done by reading back the code/data from the device's memory and comparing it to the executable on the host. The choices are:
- Full verification: Reads back the entire program loaded to the device.
- Fast verification: Reads back only the first and last 20 words loaded to the device. This is the default option for most devices.
- No verification: No verification is performed.
Connection Options: These settings control actions performed immediately after the Debug Probe connects to the target device. The choices are:
- Halt the target on a connect: Halts the core execution.
- Reset the target on a connect: Issues a soft reset on the device.
- Auto connect if a child connects: Enables a proper connection to the cores in complex SoC devices. This option should be only used in specific cases.
Disable interrupts: These settings control whether to disable or enable interrupts when stepping and/or running code. The options are self-explanatory.
Reset the target on a program load or restart: Issues a soft reset on the target device when a program is loaded or restarted.
Restart the target on a symbol load as well as program load: Issues a restart when either symbols or a program is loaded to the target device. A Restart simply re-positions the PC register to the entry point (typically _c_int00 (TI Compiler) or the reset vector).
7.2.3.2. Auto Run and Launch Options
This category defines Realtime Options, Auto Run Options and Launch Options.
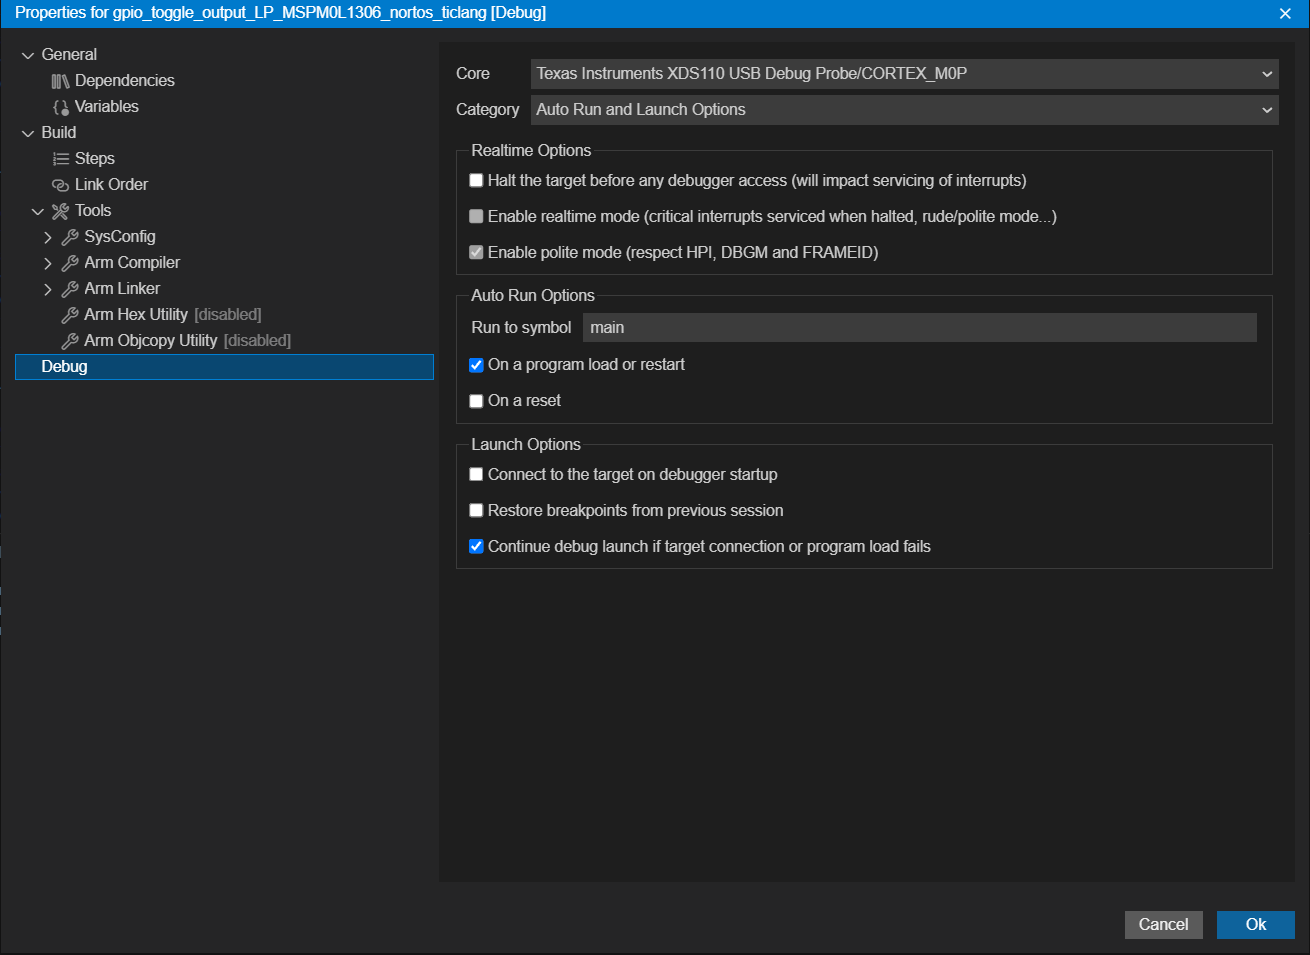
Realtime Options: These options control real-time access to the target device.
- Halt the target before any debugger access: Enables transparent access from the Debugger to the target device and its memory by performing an automatic sequence of Halt → Access → Resume. This option has the potential to disrupt the service of time critical interrupts, therefore it is disabled by default.
- Enable realtime mode: Enables complete memory and control access to the target without the need to halt it.
- Enable polite mode: Enables the polite real-time mode, which respects the current device status.
Auto Run Options: These options control which condition will cause the debugger to automatically run to and halt at the pre-defined symbol. By default, this symbol is set to run to main() On a program load or restart.
- The symbol can be set to any other C or assembly symbol desired.
- If leaving the symbol field empty and disabling all the checkboxes, the debugger will be halted at the code entry point (typically
_c_int00(TI Compiler) or the reset vector) when the executable is loaded. - If leaving the symbol field empty but leaving at least one of the checkboxes enabled, the debugger will run the target immediately after the code is loaded and left in a running state.
Launch Options: These options control the actions taken automatically when the debugger is launched.
- Connect to the target on debugger startup: When performing a Manual Launch, this step is skipped by default. This option should not be enabled with SoCs, given that most cores are held in reset during the debugger startup.
- Restore breakpoints from previous session: Restores all breakpoints and their status from a previous debug session. This option is very useful to reduce the setup time when performing sequential debugging sessions on the same target device and hardware.
- Continue debug launch if target connection or program load fails: In case of errors, the debug launch process will continue normally. The sources of errors are commonly caused by a project that fails to build or connection problems between the host and the target device.
7.2.3.3. Misc/Other Options
This category defines OS Aware Debug Options (when doing OS Aware debugging) and other miscellaneous options.
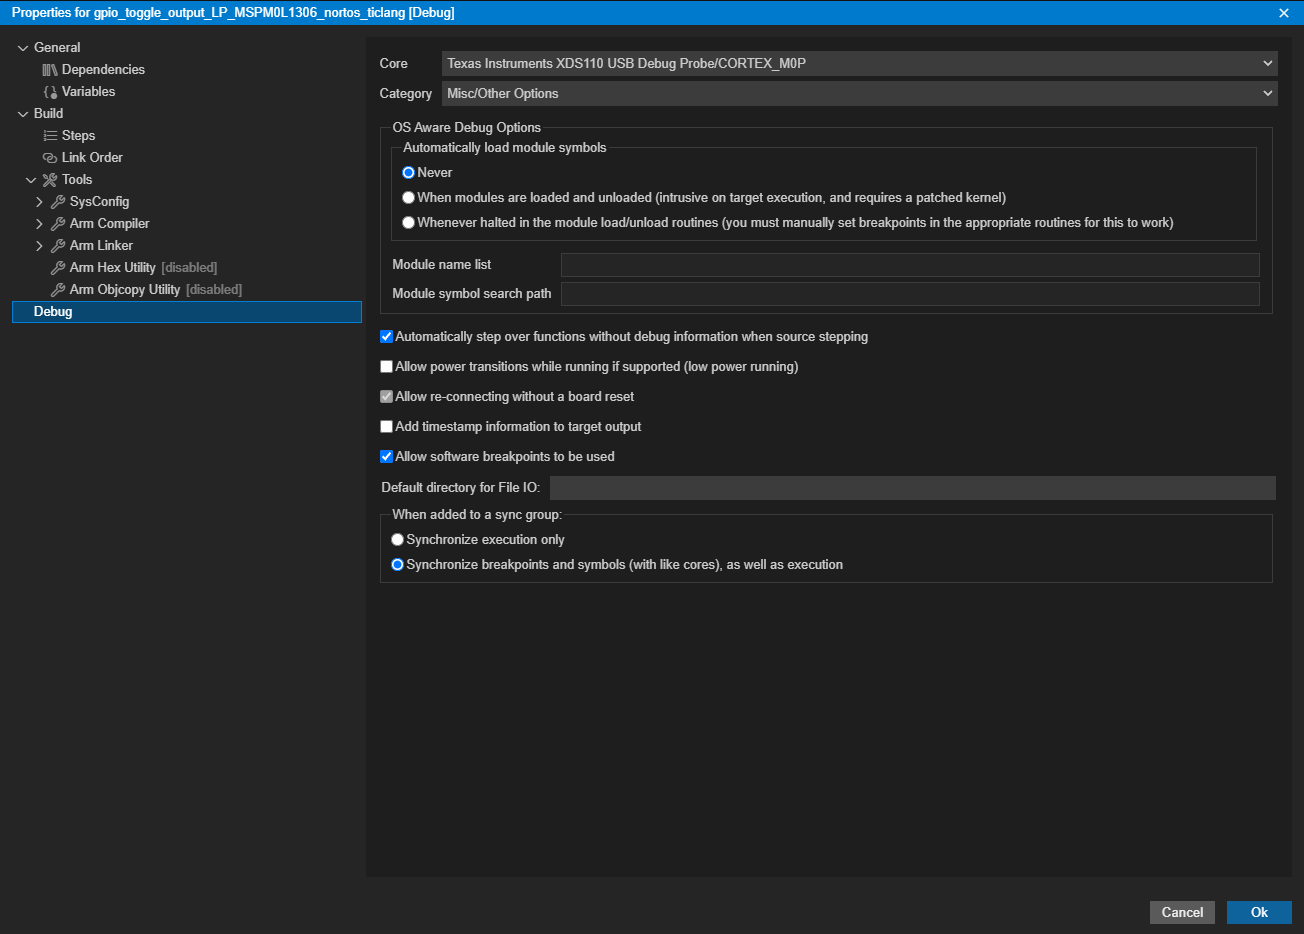
OS Aware Debug Options: These options control the Debugger awareness level when used with a High Level Operating System, such as embedded Linux or Android.
- The proper use of this option requires a device driver built into the OS to properly correlate the source code.
Automatically step over functions without debug information when source stepping: Enables a Step Over operation if the function does not have symbols and source code loaded into the debugger. If disabled, the debugger performs an Assembly Step Into for these functions.
Allow power transitions while running if supported (low power running): Maintains the JTAG Debug Probe connection when the target device goes through a power transition or reset. This is heavily dependent on the device and board capabilities.
Allow re-connecting without a board reset
Add timestamp information to target output: Adds timestamps to operations in the target that print out information in the Console View (GEL, Console I/O, etc.)
Allow software breakpoints to be used: Enables the use of Advanced Event Triggering (AET) resources to enable software breakpoints to be used when allowed by the target device. This is advantageous given that hardware breakpoints are limited in number by the target device, while software breakpoints are completely unlimited.
Default directory for file IO: Sets the default directory for any File I/O operations.
When added to a sync group: These options control the level of interaction when synchronized execution (Sync Group) is enabled. This is dependent on the target device and is effective with Symmetrical Multi Processing (SMP).
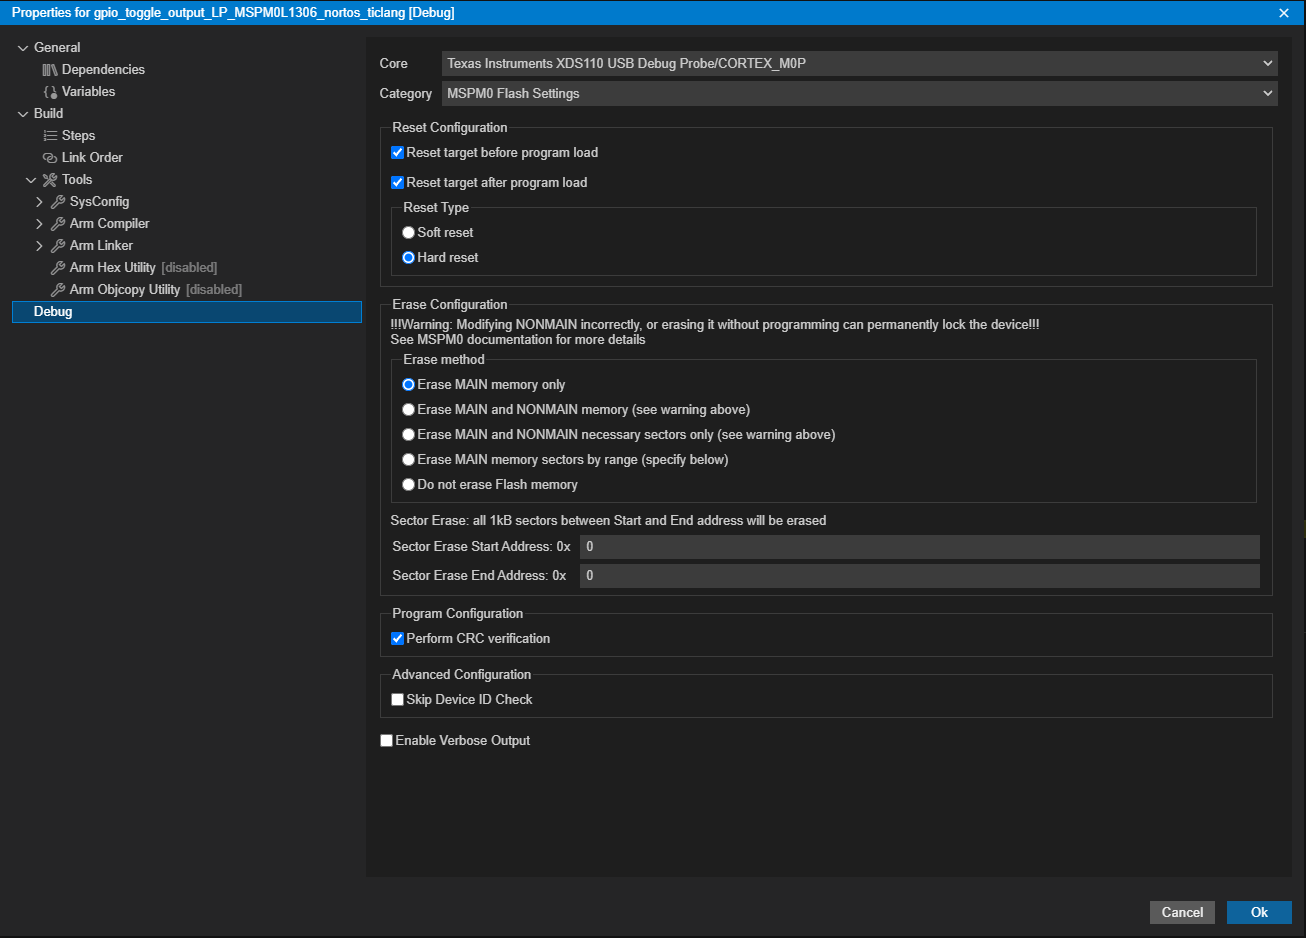
7.2.3.4. Flash Settings
This category defines several flash memory related settings and operations. The settings under this category are board-specific.
7.3. Launching a debug session
Once a configuration is created, the debugging process can be launched either automatically (Automatic Launch) or manually (Manual Launch):
7.3.1. Automatic Launch
A debug session can be launched by selecting the project in the Explorer view and do one of the following options:
- Go to menu Run → Debug Selected Project (or the F5 key).
- Right-click on selected project and select Debug Project.
- Go to menu Run → Start Debugging and select the desired project to debug.
Note
If a project has multiple target configuration files, the Active configuration of the project will be launched.
This will perform the sequence of steps shown in the section The Launching Process. In summary:
- Switch to Debug.
- Connect to the Debug Probe. Note that if Launching a debug session with multiple debug probes connected, a prompt may appear to request the user to specify which one to use.
- Automatically connect to the core/device.
- Run any GEL scripts to configure the target (if configured on the Target Configuration file).
- Load the project’s executable file (.out) to the core/device memory. The code will be automatically written to the on-chip flash memory of the MSP430, F28x and SimpleLink MCU devices.
- It is possible to configure the debugger to only load debug symbols instead of loading both symbols and target application. This can be desirable when debugging an application that is already flashed on the target. See the loadSymbolsOnly option in the Launch Configurations section.
- Run to the function
main()if configured in the debugger settings.
Note
Launching the debugger will cause CCS to build the active project if any modifications to the source code or the build options are made.
7.3.2. Manual Launch
This process launches a Project-less debug session, where there is no initial project association with the debug session. This type of debug session can be launched in several ways:
- Right-click on the desired target configuration file in the Target Configuration View and select Start Project-less Debug in the context menu.
- Right-click on the desired target configuration file in the Explorer view and select Start Project-less Debug in the context menu.
- Select the launch configuration for the target configuration file in the Debug View and then select the Start Debugging button (or Run → Start Debugging).
Note
If no target configuration file or project is highlighted, the Default configuration of the workspace will be launched.
This will perform the sequence of steps shown in the section The Launching Process. In summary:
- Switch to the Debug (if needed).
- Connect to the Debug Probe. Note that if Launching a debug session with multiple debug probes connected, a prompt may appear to request the user to specify which one to use.
The manual launching process stops at this point, but additional manual steps can be done to set up the debug environment as desired:
- Connect to the target: Connection to a core can be established by right-clicking on the desired core in the Threads view and selecting Connect Target in the context menu.
- Load Program or Symbols: Once the core finishes executing its initialization GEL script (if one is specified), the code or symbols can be manually loaded by going to menu Run → Load → Load Program or Load Symbols. Load Program loads the executable file, produced by building your project, onto the target board. Load Symbols loads the debug symbol information only. It is useful when working in a debugging environment where the debugger need not load the object code, but simply debug existing code in Flash. When loading symbols, the existing symbol table is cleared before adding new symbols.
- Set debug source search paths: For the debugger to provide source code debug visibility, it must know where to find the source files. This can be specified by going to menu Run → Edit Source Search Paths... and using the Add button in the Source Search Path dialog to specify the paths of the source files.
Launching the debugger manually can be useful in many scenarios:
- If you don’t have a CCS project or simply have an executable or binary file to be loaded to the target.
- It helps troubleshooting any JTAG connectivity issues.
- It can be a convenient when connecting to targets that have multiple cores, as some of them are held in reset when the device is powered up.
- It can be a convenient if you do not want to load code to the target, but want to simply debug code that was previously flashed. In this case the debug launch is usually followed by loading symbols.
- It can be useful to debug an ARM Cortex core by accessing its memory map directly via the Debug Access Port (DAP).
Note
For a project-less debug session, CCS Theia may sometimes not be able to locate the source files to do the source-disassembly correlation. In such cases, there are a couple of ways to tell the debugger where to look for sources. Please see the section Debugging Library Code.
7.3.3. Launching a debug session with multiple debug probes connected
There are some considerations when launching a debug session where multiple debug probes are connected to the machine. If the debug probes are all of different type (XDS110, XDS110, XDS200, MSP430FET, etc), then there is no issue. If trying to launch a debug session for a debug probe type where there are multiple of that type connected simultaneously (ex: two XDS110 debug probes connected to the machine), then the debugger may not know which debug probe to use. Some debug probes can be differentiated by serial number. If such a probe is being used, the debugger will display all the various debug probes of the same type detected along with the associated serial number, allowing the user to specify which exact debug probe to use.
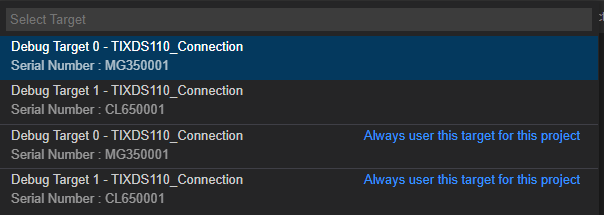
Note that the same debug probe has two options. The first one is to normally launch the debugger for that debug probe. The second option with the string Always use this target for this project is for the debugger to remember your selection the next time you launch a debug session for that project or target configuration file.
Note
The serial number can also be explicitly specified in the Advanced Target Configuration Options for the target configuration file.
7.4. Debugging the application
The process of debugging the application requires multiple features and helper views that allow complete control over the execution state of the target. Also, many data views complete the picture by exposing the status of the various subsystems of the target. This section describes some of these views and features.
7.4.1. After Launch
The behavior will vary depending on if an Automatic or Manual debug launch was performed.
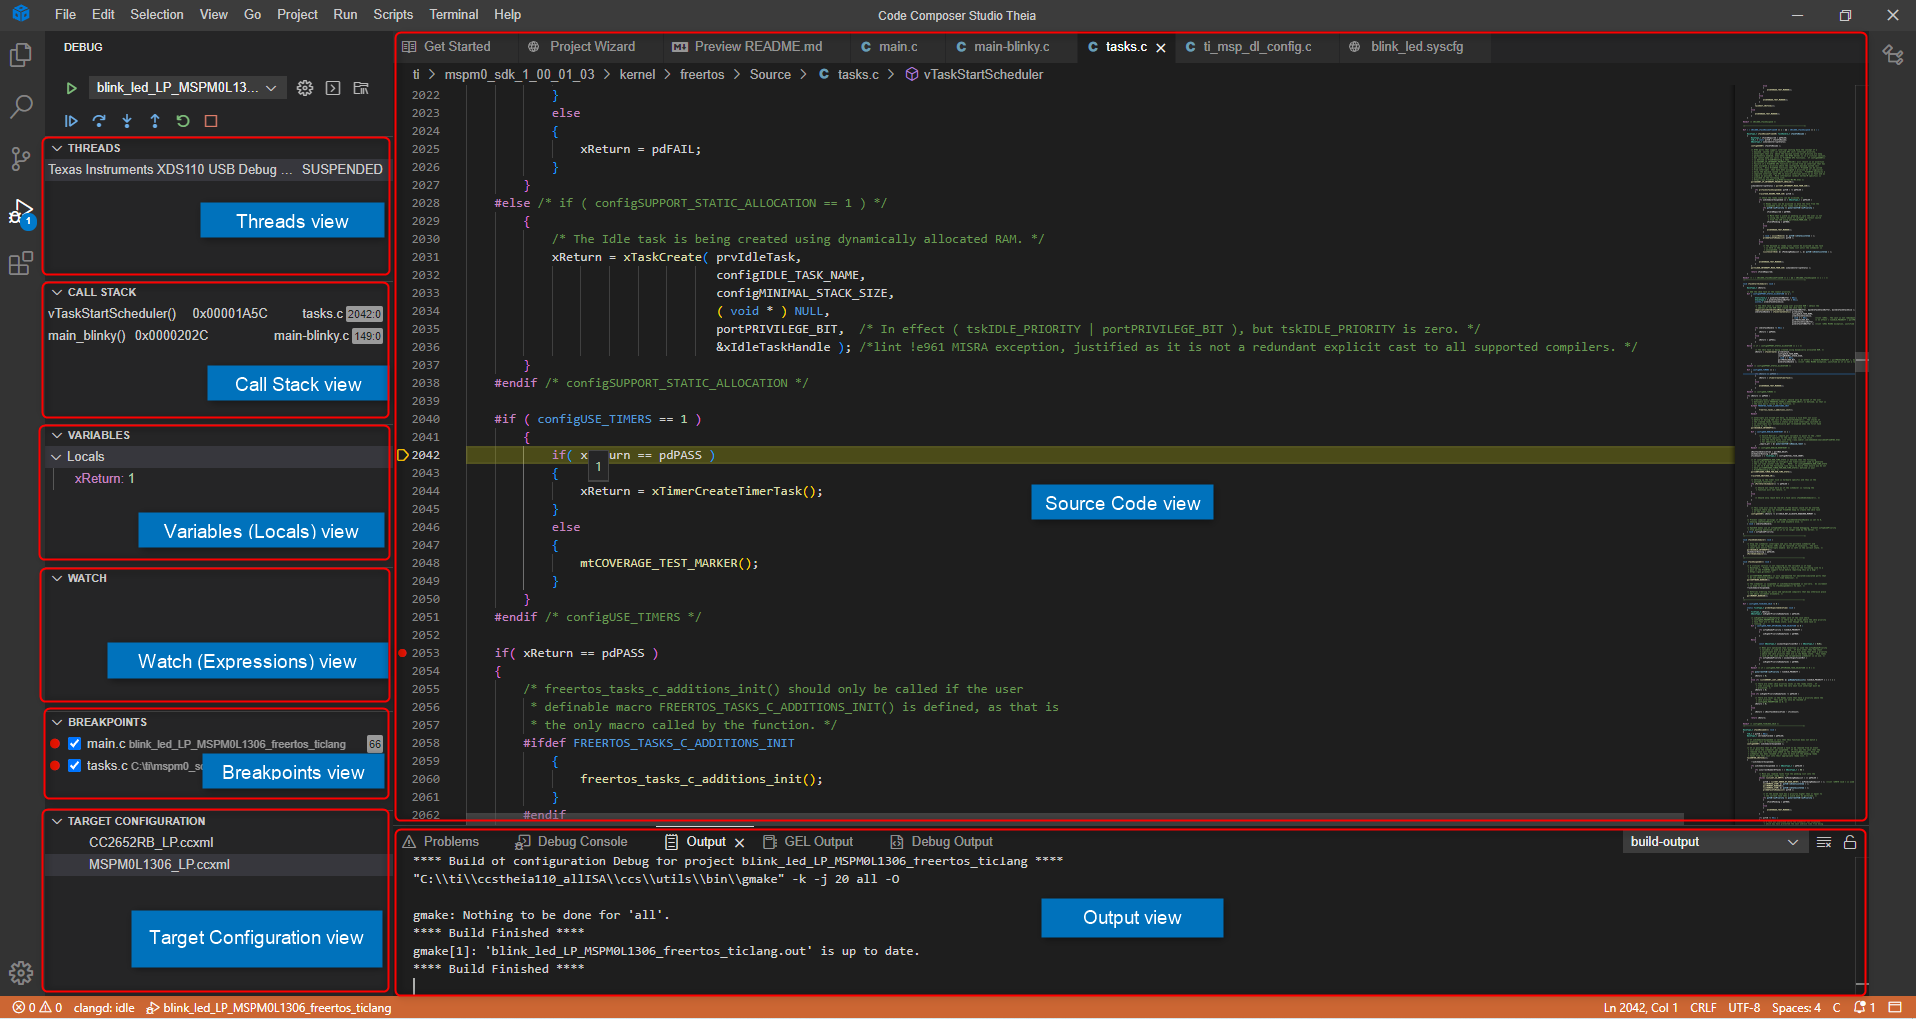
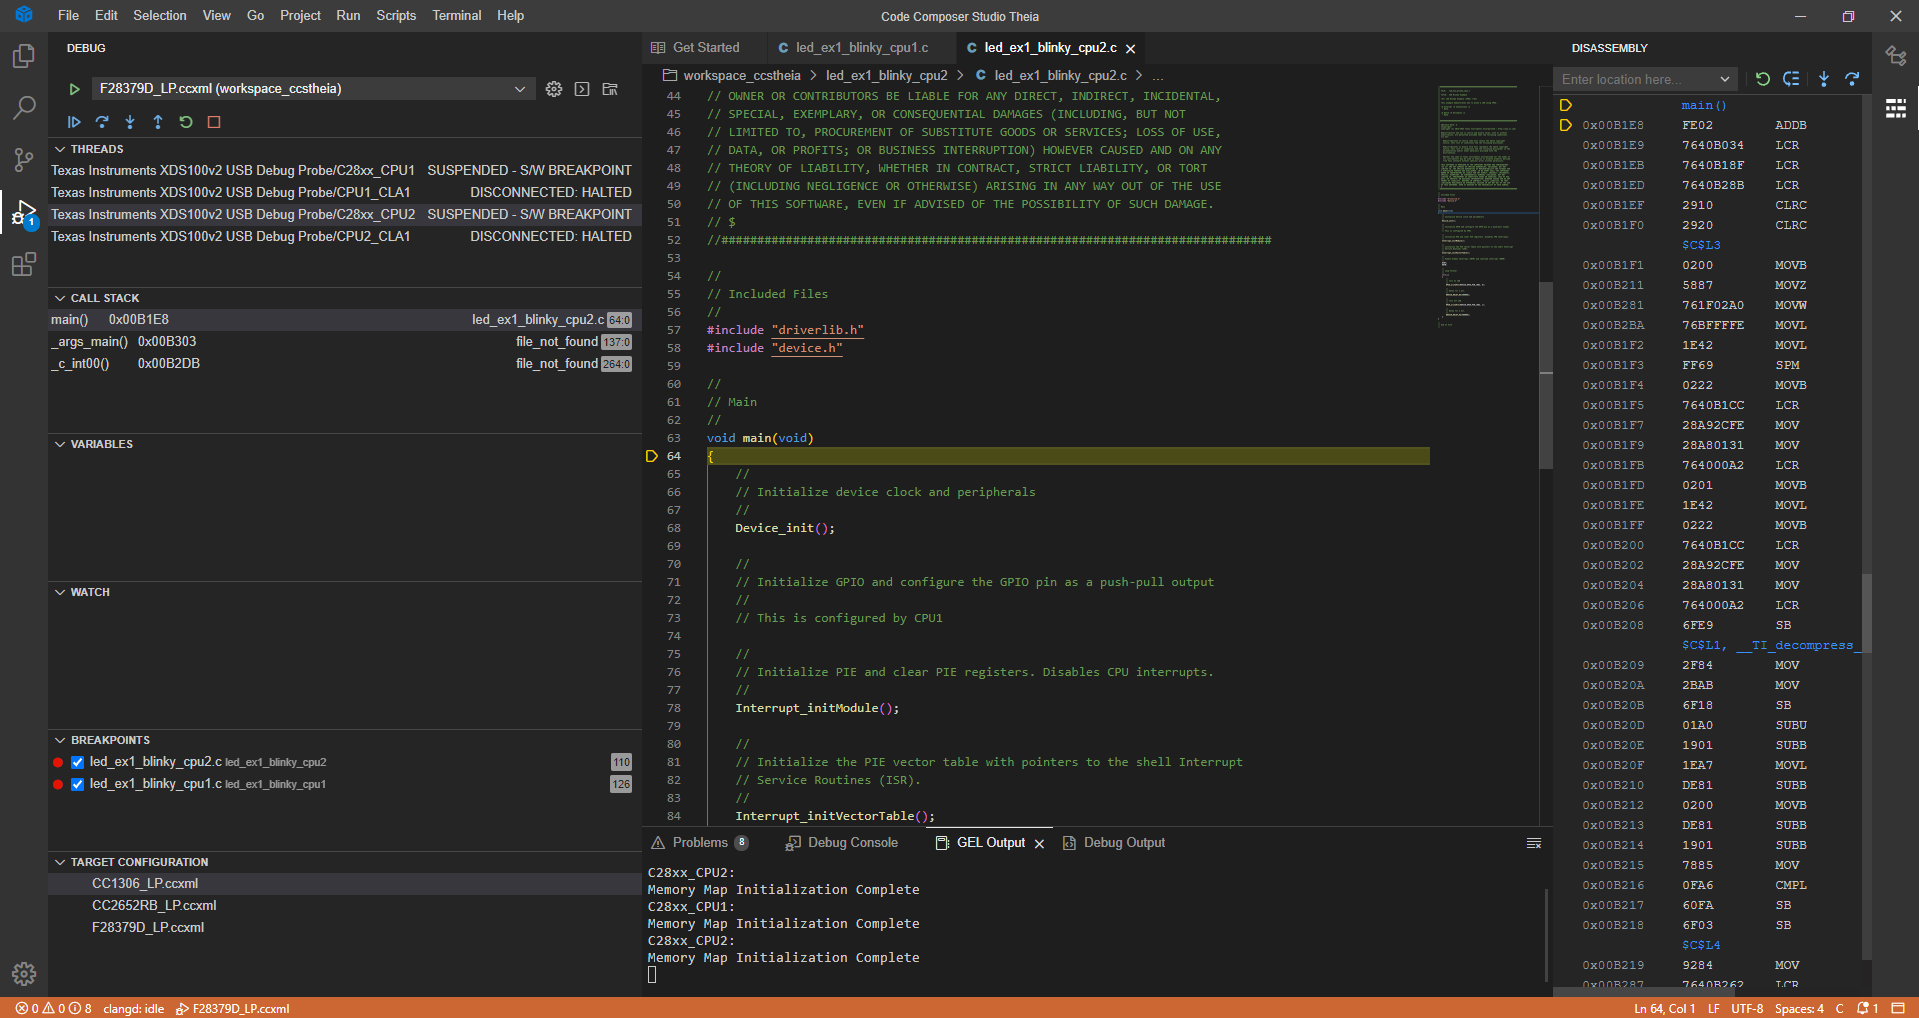
For an Automatic debug launch, CCS Theia will typically switch from the Explorer to the Debug view in the Side Bar, with the default arrangement of views shown below.
- The Threads and Call Stack views contains the target configuration and the call stack for each core.
- The source code view will typically show the program halted at the beginning of
main()(though this can vary depending on the program loaded). - Below the Call Stack view, the Variables, Watch, Breakpoint, Target Configuration views are also present.
- The Output view opens by default.
For a Manual debug launch, there is no program/symbols loaded by default, hence the Call Stack view will be empty and no source file is opened.
Example of an active debug session from an Automatic debug launch:
The next several sections highlight some of the more commonly used views specific for debugging.
7.4.2. Debug View
Basic debugging functionality is located in the top left corner of the Debug view.
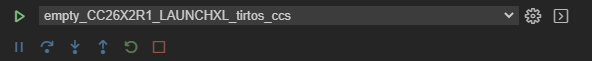
Top toolbar:
- Start Debugging: Starts a debug session of a selected launch configuration.
- Launch Configuration: Drop down list of available Launch Configurations.
- Open "launch.json": Opens the launch configuration JSON file.
- Debug Console: Opens the Debug Console view.
- Edit Source Paths... Opens the Source Lookup dialog for specifying debug source search paths. See the Manual Launch section for more details.
Bottom toolbar:
- Enable Core Group Operations: This button is used to toggle between enabling and disabling a group. This button will only be available when a group is created.
- Continue: Starts execution of the target core.
- Pause: Halts the execution of the target core. The Continue button transforms into the Pause button when it is clicked, and vice versa.
- Step Over: Executes a single source line, and jumps over subroutines or functions, running the internal code all at once.
- Step Into: Similar as above, but jumps into subroutines or functions, allowing you to run the internal code step-by-step.
- Step Out: Steps out of subroutines or functions, by executing the rest of the subroutine and returning to where it was called from.
- Restart: Issues a restart when either symbols or a program is loaded to the target device. A Restart simply re-positions the PC register to the entry point (typically
_c_int00or the reset vector). - Stop: Disconnects from all hardware (cores, devices, Debug Probes) and terminates the Debug Session.
There are several additional views embedded in the Debug view:
7.4.2.1. Threads View
The Threads view is the first view on the left side of the Debug view. It will display a list of available cores for debug and the status of each core. Depending on the CCS Thiea version, it may also prepend the connection type before the core name.
Selecting a core and bringing up the context menu will display the below options:
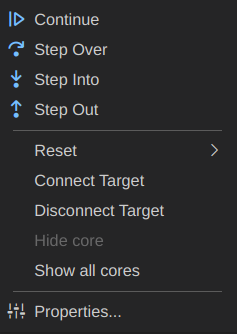
- Continue: Starts execution of the target core.
- Step Over: Executes a single source line, and jumps over subroutines or functions, running the internal code all at once.
- Step Into: Similar as above, but jumps into subroutines or functions, allowing you to run the internal code step-by-step.
- Step Out: Steps out of subroutines or functions, by executing the rest of the subroutine and returning to where it was called from.
- Reset: Opens a menu that shows the possible resets for the target; if the reset is not grayed out, then it is currently available for use.
- Connect Target: Connect to the target (if disconnected).
- Disconnect Target: Disconnect from the target (if connected).
- Enable Global Breakpoints: See the multi-core breakpoints section.
- Create Core Groups...: See the Grouping Cores section.
- Edit Core Groups...: See the Grouping Cores section.
- Show All Cores: See the Hiding Cores section.
- Hide Selected Core: See the Hiding Cores section.
- Properties: Opens the debug properties for the target.
7.4.2.2. Call Stack View
The Call Stack view shows the functions that are currently on the stack, in the order that they are being executed in:
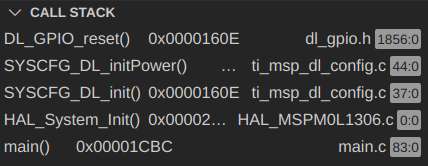
Each entry shows:
- The name of the function being called.
- The function's address in memory.
- The name of the file the function is contained in.
- The line where the function is defined in that file.
Right-clicking on the Call Stack view gives options to copy the call stack or open the Disassembly view:

7.4.2.3. Variables View
The Variables view shows local variables that belong to the function currently selected in the Call Stack view.
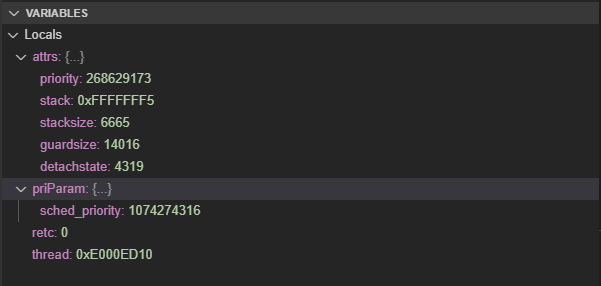
A variable consists of the following details:
- Name: The name of the variable
- Value: The value of the variable. For arrays, this field displays the first few values of its elements
Variables that contain more than one element (such as arrays, structures, or pointers) are displayed with either a > sign or a ˅ sign immediately preceding the expression name.
- The > symbol indicates that the expression contains elements that can be further expanded
- The ˅ symbol indicates that the expression is fully expanded and can be collapsed to reduce the information displayed
Whenever the situation permits it, the value of a variable may be modified by double-clicking the value and entering a new value in the dialog box that opens.
Note
This view does not allow adding or removing rows, since it is automatically populated by the variables present on the context of the program being debugged.
Right-clicking on a given variable shows the following options in the context menu:
- Set Value: Set the value of the variable
- Copy Value: Copy the value of the variable
- Copy as Expression: Copy the variable name to use for adding as an expression
- Graph Selected Value: Will open the Graph View for the selected expression
7.4.2.4. Watch View
The Watch view is the same as the Expressions view from CCS Eclipse. It is a watch window where variables (local, global, static), C-valid expressions, and even registers can be monitored.
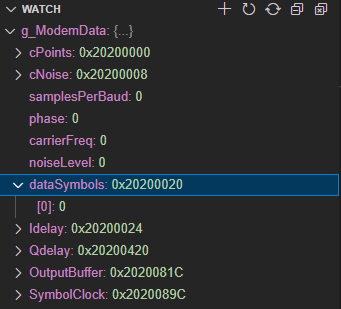
A variable consists of the following columns:
- Name: The name of the variable.
- Value: The value of the variable. For arrays, this field displays the first few values of its elements.
Expressions that contain more than one element, such as arrays, structures, or pointers, are displayed with either a > sign or a ˅ sign immediately preceding the expression name.
- The > symbol indicates that the expression contains elements that can be further expanded.
- The ˅ symbol indicates that the expression is fully expanded and can be collapsed to reduce the information displayed.
To add a variable, simply click on the + sign in the Watch view toolbar and type a valid expression.
Note
To view static global variables, it must be referenced as: 'my_source_file.c'::my_file_static_var.
Whenever the situation permits it, the value of an expression may be modified by double-clicking its value column and entering a new value.
The toolbar contains the following options:
The options are:
- Add Expression: Opens a dialog box to enter the variable to be watched
- Refresh: Update the view when this button is pressed. Depending on the device and mode of operation, the data will be updated only when the device is halted
- Continuous Refresh: Update the view continuously at a rate defined by the CCS Properties. This feature will only work on devices that support non-intrusive memory accesses
- Collapse All: Collapses all expanded variables or registers
- Remove All Expressions: Removes all expressions from the view
Right-clicking on a given variable shows the following options in the context menu:
- Edit Expression: Enables you to edit the value of the expression
- Copy Expression Value: Copies the value of the expression
- Graph Selected Value: Will open the Graph View for the selected expression
- Remove Expression: Removes the expression from the view
- Remove All Expressions: Removes all expressions from the view
7.4.2.5. Breakpoints View
See: Breakpoints.
7.4.2.6. Target Configuration View
7.4.3. Registers View
The Registers view can be accessed by going to View -> Registers, after which an icon  is added to the right-most pane in the IDE. Clicking on this button toggles the register view. It allows viewing and editing the contents of core and peripheral registers of the device, including bitfields and individual bits. To change a register or register bit field value, single click in the value column of the register and modify it. This is only allowed for registers that are not read-only.
Register values that have recently changed are highlighted in yellow text.
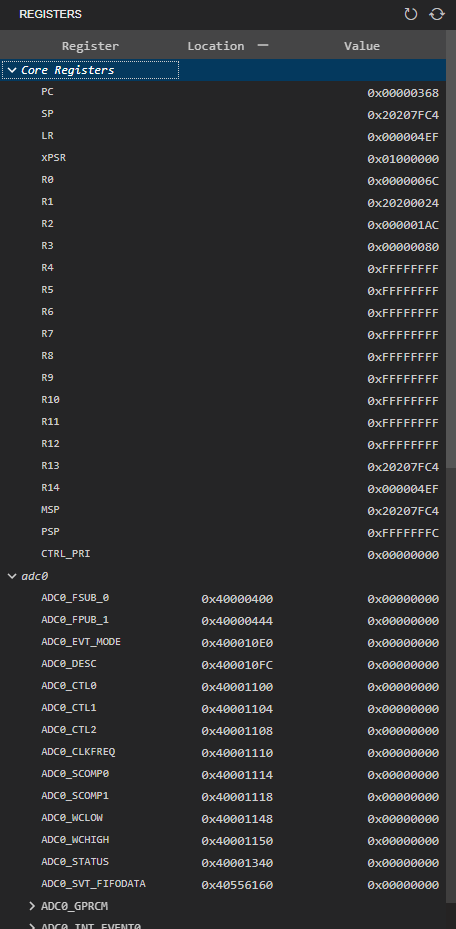
It consists of the following columns:
- Register: The name of the register, bitfield or bit.
- Value: The value of the register, bitfield or bit.
- Location: The memory location of the register. This only applies to memory mapped registers. This column can be shown/hidden using the + and - buttons respectively.
- Description: The description of the register. This column can be hidden. This column can be shown/hidden using the + and - buttons respectively.
Note
This view does not allow adding or removing rows, as they are automatically populated with the device information.
The toolbar in the upper right corner contains several options:
- Refresh: Update the view when this button is pressed. Depending on the device and mode of operation, the data will be updated only when the device is halted.
- Continuous Refresh: Update the view continuously at a rate defined by the CCS Properties. This feature will only work on devices that supports full Real-time Mode.
- Add New View: Open a new view.
- Pin to Debug Context: Pin the view to a specific core. This can be helpful during Multi-core Debug.
- Number Format: Change the display format (Hex, Binary, Octal, etc) of the values.
7.4.4. Disassembly View
The Disassembly view is an integral part of the debugger that translates machine language into assembly language,
as it displays the disassembled instructions and symbolic information needed for debugging.
This view is not opened by default, but can be viewed by going to menu View → Disassembly, unless there is no loaded program or
there are no debug symbols attached to the program. After the view is opened once, a button  is added to the
right-most pane which toggles the Disassembly view.
is added to the
right-most pane which toggles the Disassembly view.
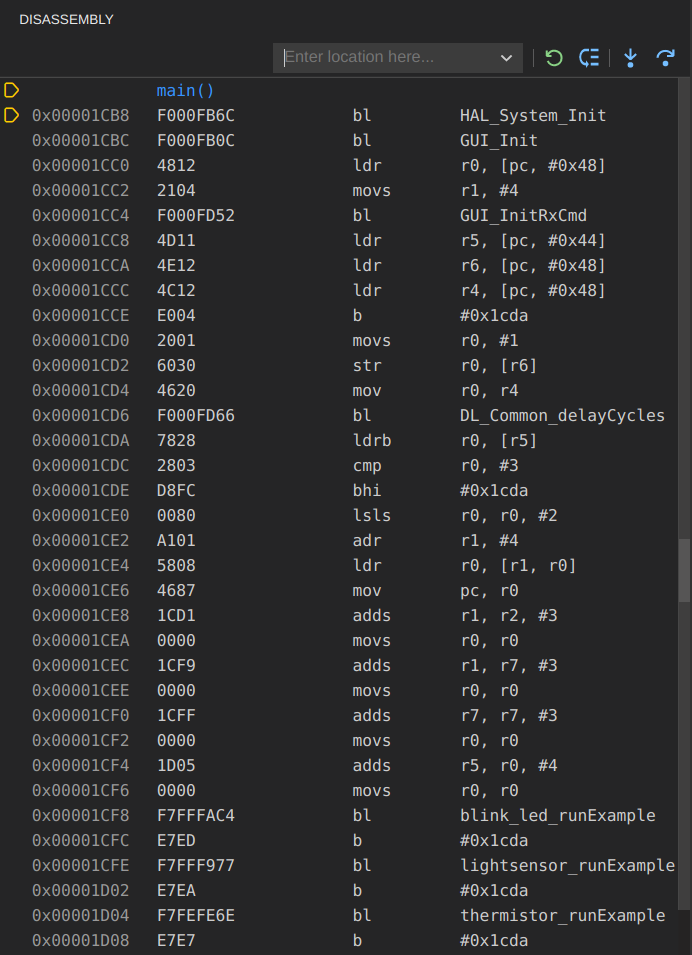
The Disassembly view contains several fields in its default configuration:
The first column shows program addresses.
- The small yellow arrow to the left of a program address indicates the location of the Program Counter - the next instruction to be executed.
The second column shows the opcodes in hex format.
The third and fourth columns show the corresponding assembly instructions.
If the loaded program contains symbolic debug information and the option Show Symbols is enabled, then the function names in context are shown. (In the image above, main() is a symbol being shown).
If the option Show Source is enabled, then the C source code corresponding to an instruction will appear in the row above it.
If you click to the left of an address or symbol, you can insert an address or symbolic breakpoint into the code. More information on breakpoints can be found in breakpoints.
The toolbar contains several functions:
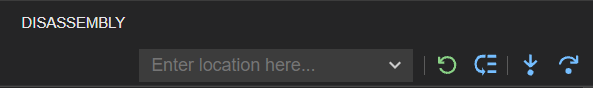
The options are:
- Address box: This box allows inputting an address or a symbol name to navigate to it.
- Refresh view: Updates the contents of the view by loading them from the target.
- Goto current PC location: Moves the view to the Program Counter's current position.
- Assembly Step-into: Executes a single assembly instruction, and jumps into subroutines or functions, allowing the user to run the internal code step-by-step.
- Assembly Step-over: Similar as above, but jumps over subroutines or functions, running the internal code all at once.
Right-clicking on the main view shows the following context menu:
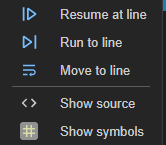
The options are:
- Show Source: Shows source code intertwined with the disassembled instructions.
- Show Symbols: Shows the debug symbols at their corresponding addresses.
- Run to line: Runs to the line pointed by the mouse cursor.
- Move to line: Moves the PC register to the line pointed by the mouse cursor.
- Resume at line: Moves the PC register to the line pointed by the mouse cursor and starts running from this point.
7.4.5. Memory View
The Memory view is another integral part of the debugger that shows the contents of the target memory starting at a specified address and with various data formatting features. The memory view is not opened by default but can be viewed by going to menu View → Memory.
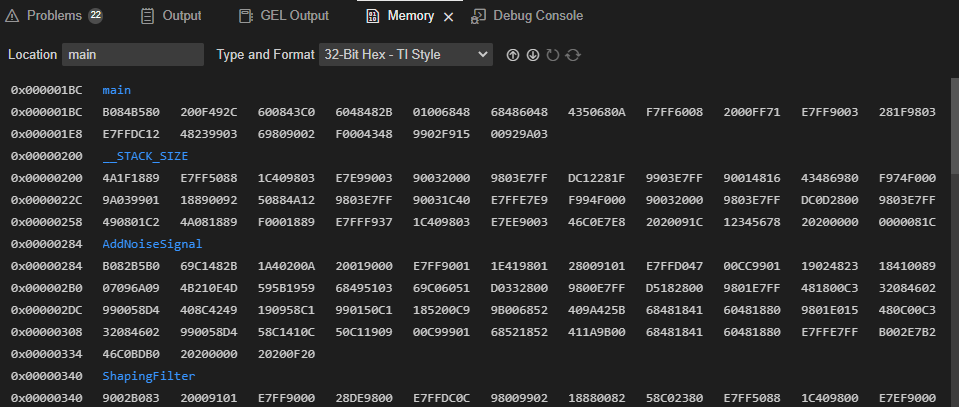
It features multiple viewing formats and types: char, integer (signed/unsigned), float and multiple hexadecimal data sizes (8- through 64-bits). Additional capabilities include the ability to save to/load from files in the host PC (in a varity of formats), viewing all of the variables and functions, and that every memory position has a context-sensitive information box.

The options are:
Location: A textbox that allows inputting an address or symbol name to navigate to it
Type and Format: Allows the user to change the type and format in which the memory is displayed
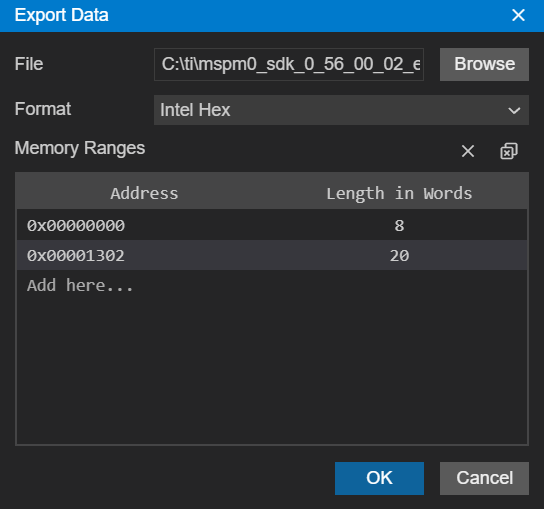
Export data to file: Opens a dialog that allows the user to export specified memory ranges of data to a file on their machine
- File: Specify the file to export the data to
- Format: The format in which the data is to be saved
- Memory Ranges: Specify the memory ranges to be exported
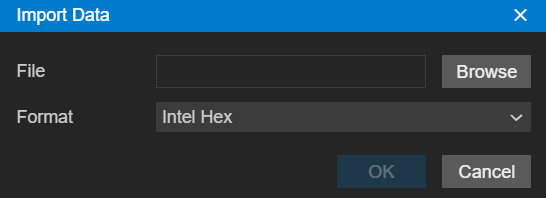
Import data from file: Opens a dialog that allows the user to import data from a file
- File: Specify the file to import the data from
- Format: Specify the format of the data
The toolbar in the upper right corner contains several options:
- Refresh: Update the view when this button is pressed. Depending on the device and mode of operation, the data will be updated only when the device is halted.
- Continuous Refresh: Update the view continuously at a rate defined by the CCS Properties. This feature will only work on devices that support non-intrusive memory accesses.
- Add New View: Open a new view.
- Pin to Debug Context: Pin the view to a specific core. This can be helpful during Multi-core Debug.
7.4.6. Output View
The Output view is another integral part of the debugger that shows several informative messages of the debug session. It is not opened by default but it is usually shown as soon as the Debug Session starts to show various status and progress messages.
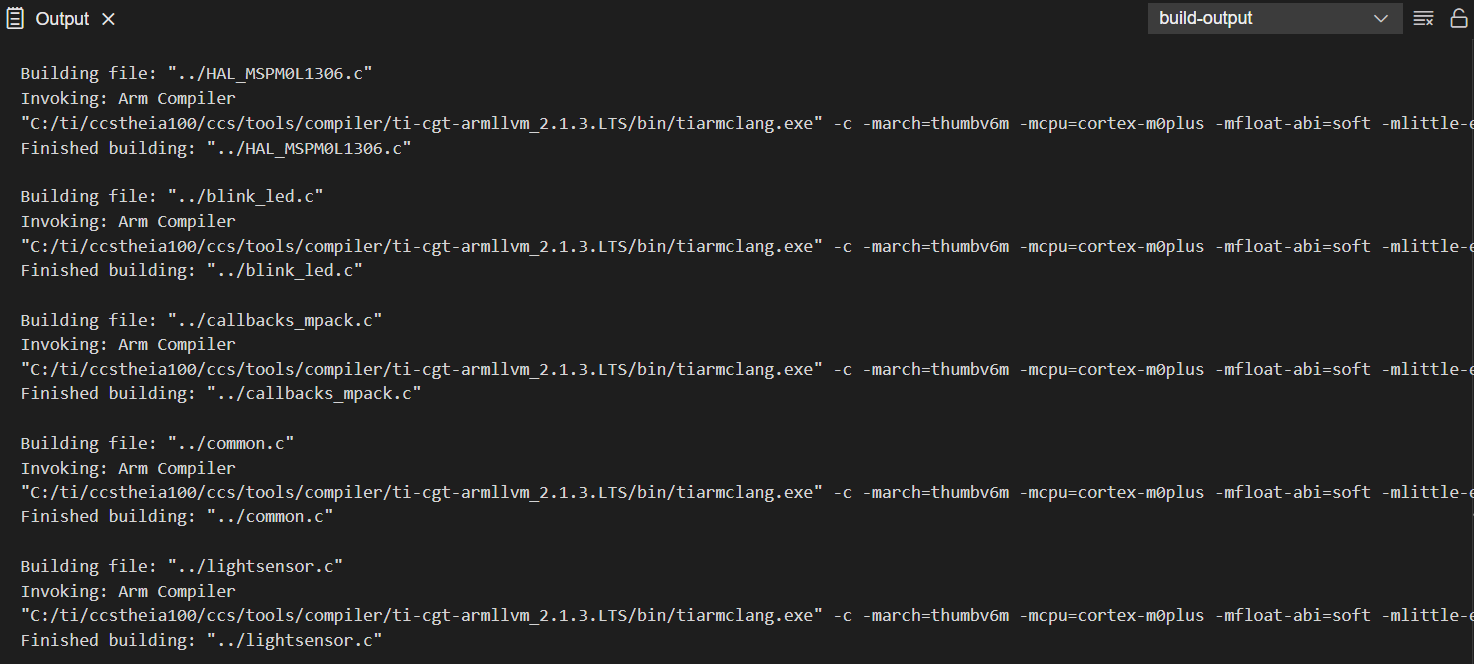
Among the several messages it can display are:
- Errors and Warnings coming from the Debug Probe or its protocol stack.
- Any Console I/O output coming from
printf()statements in the code.
The toolbar contains several functions:
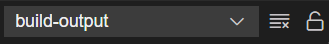
- The dropdown menu allows the user the change what type of output is shown.
- Clear Output: Clears the contents of the Output view.
- Turn Auto Scrolling Off: Locks the automatic scroll when new content is added.
Right-clicking on the Output view shows the following context menu:
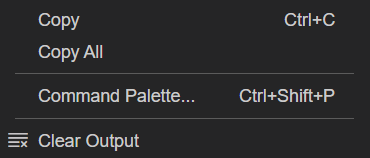
- Copy/Copy All: Copies selected/all information to the clipboard.
- Command Palette: Opens the Command Palette, for running commands.
- Clear Output: Clears the contents of the Output view.
7.4.7. Serial Console View
The Serial Console view allows the user to open a serial connection on a specified port. It can be opened with the menu View → Console → Serial Console.
The toolbar contains several functions (from left to right):
Connect/Disconnect COM Port: Open a connection to an available COM Port or close an existing connection.
Clear Output: Clears the contents of the Serial Console view.
More Actions...: Options to toggle the below actions:
- Local Echo
- Send Characters on Enter
7.4.8. Scripting Console View
The Scripting Console view is a JavaScript shell which will create a Debugger Scripting (ds) instance when it is opened. This allows users to interactively call Scripting API s. It can be opened with the menu View → Console → Scripting Console.
The toolbar contains several functions (from left to right):
- Load JS File...: Open a JavaScript file to run from the console.
- Clear Output: Clears the contents of the Serial Console view.
The ds instance can be used to configure the debugger and open a debug session. This instance is the same instance that is returned when initScripting() is called (See: Getting Started).

The below example would configure the debugger for an MSPM0G3507, open a debug session for the Cortex-M0 core, connect to the core, load a program for it, and run the target.
js:> ds.configure("MSPM0G3507.ccxml")

js:> session = ds.openSession("CORTEX_M0P")

js:> session.target.connect()

js:> session.memory.loadProgram("myApp.out")

js:> session.target.run()
Note that if a debug session has already been launched, then it is not necessary to call ds.configure() since the debugger is already configured for the target that the active debug session was launched for. However, it is still necessary to call ds.openSession() to open a debug session for a core.
Note
If a debug session was already launched manually, then any debugger scripting calls from the console will be reflected in the IDE (the IDE will update). If a debug session was launched from the console, then the IDE will not update to reflect any calls made from the console.
Pressing the TAB key can be used to display a list of the loaded console commands. It can also be used to suggest completions for partially typed commands.

7.4.9. RTOS Objects View
The RTOS Objects view displays the current state of supported real-time kernels running on the target if one is used with the target application.
The RTOS Objects view does not disturb the run-time behavior of the application on the target and adds zero footprint to the target code (when using a JTAG connection).
The type of information available will vary depending on the RTOS and project/SDK/application used. Select an available module from the Module Name dropdown list. Select an option in the View Name to specify the detail/type of information to be displayed for the selected module.
The example below shows basic information on the available tasks:

7.4.10. Graph View
The Graph view allows you to plot expressions on a simple time domain graph that plots the array values in the "Y" axis and the array index (sample count) in the "X" axis.
The Graph view is basically a memory viewer that, instead of displaying the data in raw format, shows it in a X-Y plot format.
The data formatting and plotting is entirely done by the host but using the data present on the target device's memory. In other words, the graph tool does not modify the data on the target memory but only fetches it via the Debug Probe connection to update its view.
In order to update its view, the graph tool requires a trigger set by a debug halt event such as a manual halt, a breakpoint, or enabling the option Continuous Refresh in the Graph Toolbar.
In sequence, the trigger causes the graph tool to perform several tasks:
- Fetch the data samples from the target at addresses of the specified expressions
- Plot each individual sample data matching its numerical value on the vertical axis (Y axis) and increment its position on the horizontal axis (X axis).
The graph can be opened by selecting View → Graph. This will open the New Graph dialog:
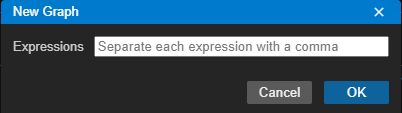
Enter the expression(s) that you wish to graph. If multiple expressions are added, both will be plotted on the same graph. An expression can be an explicit address, varable, etc. If a variable is to be used, it is recommended to reference a global varable since it will always be in scope if real-time continuous refresh is enabled.
Note
A single graph only supports plotting mutiple expressions if they are of the same type (all scalar or all arrays). It does not support mixed types (one scalar and one array).
Once added and the OK button is pressed, the Graph view will be opened. Once the graph is refreshed, the graph will plot any available data.
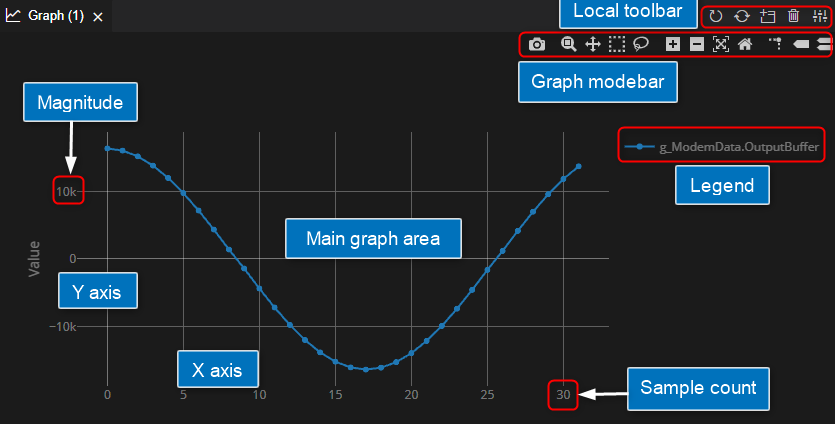
- Axes X and Y: These are the main numerical reference points for the displayed data
- Magnitude: Numeric representation of the value of each data sample
- Sample count: Number of samples shown at a given time
- Main graph area: Where the plot is shown
- Local toolbar: View properties
- Graph modebar: Graph visualization properties
Hovering the mouse pointer in the graph area will highlight the closest plot point.
7.4.10.1. Graph Local Toolbar
Above the upper right corner of the Graph view, a toolbar is displayed which provides the following features:
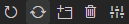
From left to right, these icons are:
Refresh: Update the view when this button is pressed. Depending on the device and mode of operation, the data will be updated only when the device is halted.
Continuous Refresh: Update the view continuously at a rate defined by the CCS Properties. This feature will only work on devices that support non-intrusive memory accesses.
Clear Data: Clears all data.
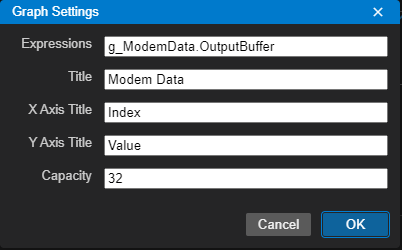
Settings: Opens the Graph Settings.
Expressions: Expression(s) to be plotted
Title: Name of the graph (optional)
X Axis Title: Name of the X axis
X Axis Title: Name of the Y axis
Capacity: Number of points that the graph will plot
- For scalar values: The capacity will default to a size of 250 and is adjustable. the graph will accumulate the scalar value on each refresh until it reaches the buffer size and then shift the value
- For arrays: The capacity will default to the size of the initial array. The size is not adjustable
Open New Graph: Opens a new Graph view.
7.4.10.2. Graph Modebar
When hovering the mouse pointer over the upper right corner of the Graph view, a toolbar will appear which provides the following features:

From left to right, these icons are:
- Download plot as a png: Save the current plot to an PNG file on the host
- Zoom: Clicking this selects the Zoom mode. To zoom in on a region of the graph, click and hold your mouse, moving across the region. Release your mouse. To return to the original view, double-click anywhere on the plot. This mode is enabled by default
- Pan: Clicking this selects the Pan mode. To pan across regions of your graph, click and hold your mouse to explore the data. Double-click anywhere to return to the original view.
- Zoom in: Zoom in. Axes labels and annotations remains the same size to preserve readability
- Zoom out: Zoom out. Axes labels and annotations remains the same size to preserve readability
- Autoscale: Allow graph to autoset axes for best visibility
- Reset axis: Resets the axes of graph based on the data
- Toggle spike lines: Clicking this will toggle if spike lines are displayed when hovering over a plot point on the graph
- Show closest data on hover: Display the data for just the one point under the cursor
- Compare data on hover: Shows you the data for all points with the same x-value (when multiple expressions are plotted)
7.4.11. Breakpoints
Breakpoints are one of the most basic features in any debugger, allowing the execution of the processor or core to halt at a pre-defined place in the code.
Breakpoints can be set at a line in a source file, which gets translated to an address in the device memory, or directly at an address in the Disassembly View. They can also be set on a method in the Outline or Explorer view.
They are displayed at the left side of the source editor view and in the Breakpoints View.
Breakpoints can also be enabled or disabled via the context menu in the source editor or the Breakpoints view. An enabled breakpoint causes a thread to suspend whenever the breakpoint is encountered. Enabled breakpoints are shown in red. A disabled breakpoint does not cause threads to suspend and are greyed out in all views.
There are two types of breakpoints: Software and Hardware.
A software breakpoint is implemented as an opcode replacement. The debugger modifies the opcode by inserting an estop_0 (or similar) instruction where the previous instruction was. The program counter stops immediately before it executes the software breakpoint instruction. In general this instruction is hidden from the main interface, but in certain instances this instruction is displayed in the Disassembly View.
Software breakpoints can only be set in memory regions with write access (RAM), therefore there is no theoretical limit to the number of software breakpoints that can be used.
A hardware breakpoint is implemented internally by the target hardware. The method used to do this is heavily dependent on the device or core, but typically the debugger writes the address to a register on the device and sets a flag to enable breakpoints. These registers are not exposed to the IDE.
A hardware breakpoint can be set in any memory type (RAM, Flash or ROM), but it is limited by the number of registers on the device. This is mandatory for the types of console I/O devices.
A special category of hardware breakpoints are called Watchpoints (also known as "data breakpoints"), which are breakpoints triggered by memory accesses instead of instruction acquisitions.
To set a breakpoint, simply click on the left side of the line number in the source editor view. The debugger will check the debugger memory map to determine if the specified location is writable (RAM). If so, a software breakpoint will be used. If it is determined that the location is not writable (Flash, ROM), then a hardware breakpoint will be used.
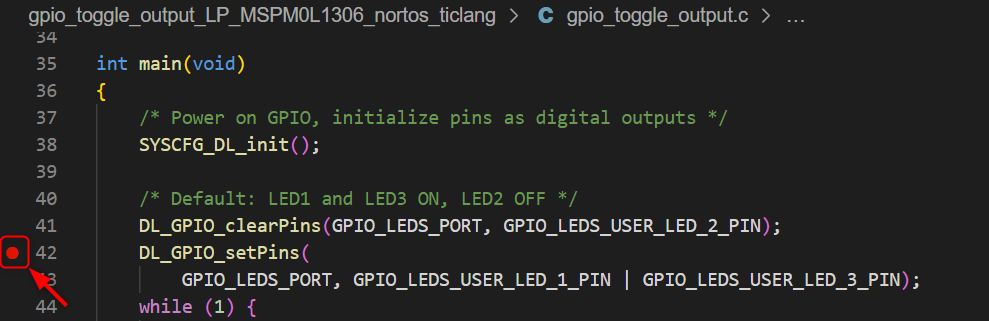
Other ways to add a breakpoint at the selected source line is to go to the menu Run → Toggle Breakpoint or use the associated keyboard shortcut (F9 for the default setting).
Warning
In optimized code, the breakpoint may not be set to the exact line in the C source code. This is because the optimizer may condense code and change the correlation between the assembly instruction and the C source. See the section Debugging optimized code
7.4.11.1. Watchpoints
Watchpoints are a special category of hardware breakpoints that can be triggered for a particular memory read, memory write, or both memory read or write. Watchpoints are only shown in the Breakpoints View.
Watchpoints are extremely useful to catch exceptions, invalid memory boundary accesses, overrun buffers, etc. and can be set to access any memory region, including Memory Mapped Registers (MMR).
To set a watchpoint, go to menu Run → New Breakpoint → Hardware Watchpoint. This will open the following dialog:
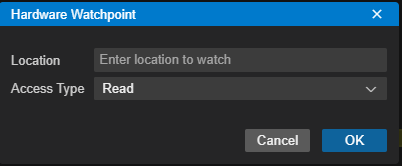
- Address: The memory address to be watched.
- Access type: Choose whether to halt on read accesses, write accesses, or both.
7.4.11.2. Breakpoints View
The Breakpoints view is an integral part of the debugger that allows complete management of breakpoints.
The Breakpoints view is the last section on the leftmost pane of the Debug view.
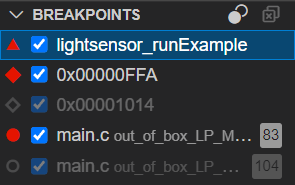
The view above contains the status of all breakpoints.
The shape of the breakpoint icon indicates its type; triangle is a symbolic breakpoint, diamond is an address breakpoint, and circle is a source code breakpoint. If the breakpoint is greyed out, then it is not currently enabled.
The toolbar contains the following options (from left to right):
- Toggle Active Breakpoints: Enables/Disables all active breakpoints. Disabling a breakpoint does not remove (delete) it, making it easy to reapply (enable) it in the future.
- Remove All Breakpoints: Removes all of breakpoints in the view.
- Show Core Name: Display the name of the core that thre breakpoint is associated with (useful for multi-core targets).
The right-click context menu for an entry has the following options:
- Remove Breakpoint: Removes the highlighted breakpoint.
- Remove All Breakpoints: Removes all of the breakpoints.
- Remove Breakpoints Group: Removes breakpoints group.
- Enable All Breakpoints: Enables all of the breakpoint.
- Disable All Breakpoints: Disables all of the breakpoints. Disabling a breakpoint does not remove (delete) it, making it easy to reapply (enable) it in the future.
- Edit Breakpoints:
- Properties...: Opens the dialog box to set the properties of the breakpoint.
7.4.11.3. Breakpoint Properties
Properties shows details of a breakpoint (address location, related source code, type) and allows modifying the associated behaviour (actions, counter, type of event). Select the breakpoint in the Breakpoints view, and select Properties from the context menu to see a more detailed property list.

In addition to simply halting the code, software breakpoints in CCS add a range of other actions such as file I/O transfers, screen updating, etc. which are accessible via the Action option of its properties.

Warning
The options under Debugger Response apply to software breakpoints only. They have no effect with hardware breakpoints and watchpoints.
Some of these actions open a new of parameter options immediately below the Action field. The choice of parameters will depend on the chosen action.
The main actions are:
Remain Halted: The default action when you create a breakpoint is to halt the target when triggered.
Execute Expression (GEL): Evaluates single GEL expression. When selected, a new option field is opened and where a GEL expression may be entered.
Update View: Updates the contents of a single view of the debug session. When selected, a new option field is opened and where a specific view can be chosen for update. After the update, target execution resumes.
Read Data from File/Write Data to File: Performs a read/write operation from/to the host computer when the breakpoint location is reached. After the data is transferred, target execution resumes. When selected, additional fields for a filename, memory address, length, and data format will be available.
- The file is saved in either the TI .dat or .coff formats, which are described in the section Data File Formats.
Other breakpoint properties configurable are:
- Skip Count: Sets the number of passes before the breakpoint action is executed.
- Group: Allows grouping breakpoints for advanced control.
7.4.12. Data File Formats
CCS is able to import and export data in a few file formats, including COFF, flat binary format, Intel HEX, and TI-TXT.
7.4.12.1. Common Object File Format
The Common Object File Format or COFF for short, is a binary file format used for object code, libraries, and executables, originated on Unix systems. TI uses this file format with modifications optimal for embedded systems.
Additional details and references can be found in the TI Assembly Language Tools User's Guides or on the COFF Wikipedia page.
7.4.12.2. Binary Format
The Binary format has no specified header or translation. It is a simple bitstream of data with no information about symbols, address placement, or relocation. The length of the data is equal to the length of the file.
One important aspect: when creating binary files using tiobj2bin or objcopy from a project, care must be taken to place all initialized code/data in adjacent memory locations. Any holes are filled with zeros. If a file with zero-filled gaps is loaded to a device, it may trigger invalid memory access errors.
7.4.12.3. Intel HEX Format
Detials on this format can be found in the TI Assembly Language Tools User's Guides or on the intel HEX Wikipedia page.
7.4.12.4. TI-TXT Format
Detials on this format can be found in the TI Assembly Language Tools User's Guides
7.5. Advanced Debugging Topics
7.5.1. Debugging Optimized Code
If your program is compiled with optimization enabled, that will impact the debug experience. The higher the level of optimization, the more it will degrade the ease of debugging. Please see this article about the tradeoff between debug and optimization: Debug versus Optimization Tradeoff
7.5.2. Debugging Library Code
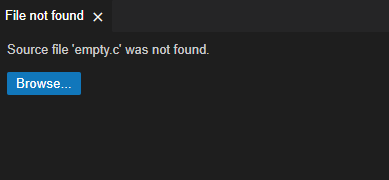
When debugging the application, the target may be halted (either intentionally or unintentionally) within a routine in one of the libraries linked to the application. In such cases, the debugger may not open the source file in the editor.
The reason is that the program is halted at a location where the debugger is unable to locate the corresponding source file. This is typical when halted within a library that was built outside of the current project.
This type of message can occur when halted within any library, including the C runtime library, BIOS libraries, driverlibs, or other custom libraries linked to the project.
Some situations when the message will appear:
- if the Halt button is pressed and the Program Counter is located within a library routine.
- if a breakpoint is set at a label inside a library routine and the debugger is halted at it.
- if the code is halted within a library routine for some unintended reason.
The message itself is typically harmless and can be ignored. If it is required to do source level debugging of the library code, the debugger can point to the location of the source file by clicking on Browse… and browsing to the location where the source file resides (a directory, a mounted remote drive, etc.).
Another option is to go to menu Run → Edit Source Search Paths... and using the Add button in the Source Search Path dialog to specify the paths of the source files.
Libraries from TI such as the C runtime library, driverlib (part of SimpleLink SDKs, C2000Ware, MSPWare, TivaWare etc.) often come with the source, so these directories can be specified to the debugger.
If you do not have access to the source, you can still view and step through the disassembly code using the Disassembly view.
Without the source file correlation, the debugger will also be unable to set breakpoints within a library routine from the editor view. For example, if you open a source file that is part of a library and try to set a breakpoint in it from the editor view without making the correlation between the debugger and source file, then the breakpoint will not be enabled. You can still set the breakpoint from the Breakpoints view by specifying the symbol name or associated address. Then when the program is halted at the breakpoint, you can click on the Browse… button to tell the debugger where the source files are located. Once the association with the source is made, you should then be able to set future breakpoints from the editor view.
7.5.3. Multi-core Debug
7.5.3.1. Launching a Debug Session
There are several options for starting a debug session for a multi-core target:
Manual Launch: This will launch a debug session for the target without any project association. The user can then manually choose which core(s) to load a program for.
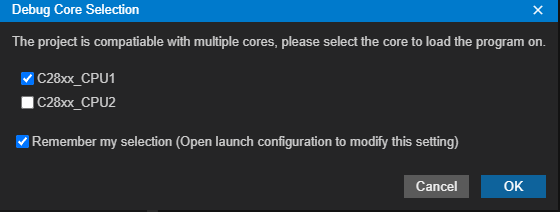
Automatic Launch: Build the project in context and then launch a debug session for the project, connect, and load the application to desired CPUs. CCS will detect which core(s) match the project type and then prompt the user asking which core(s) to debug the project on (connect, load program):
7.5.3.2. Debug Context
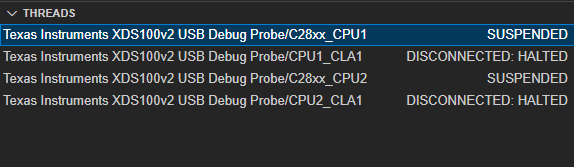
The Threads View displays the connection/CPU name for each debuggable core on a multi-core target.
Note
If an automatic project debug launch was used to debug a project, only the CPUs selected in the Debug Core Selection dialog will appear in the Threads view. To have all the available cores visible, use the Show all cores option in the Threads View. If an manual project-less launch was used, all debuggable cores will be visible by default. It is possible to specify cores to auto-hide from view in the Launch Configurations.
Most of the various views in the views associated with debugging (Call Stack, Variables, Watch, Memory, Disassembly, etc) will reflect the context of the highlighted stack frame for the specified core. To switch the context to another core, simply highlight the CPU for that other core in the Threads view and the other various views will be updated to reflect the context of that core.
Some views such as the Breakpoints view will always show information for all cores. Enabling the Show Core Name option for the view will display the core that the breakpoint is applicable to.
Most debugging views, such as the Disassembly View, allow you to "pin" the view to the context of the currently selected core. This can be done using the Pin to Debug Context icon in the view, as long as this function is supported by the view. Doing this will allow you to change the debug context to another core but still have that view reflect the context of the core it was originally "pinned" to. An example use case would be to open up several instances of a "pinnable" view with each view tied (or "pinned") to a different core to allow side-by-side analysis of the current contents of memory for each core during debug.
When a view is "pinned" to a core, the full core name will also appear below the view toolbar to clearly indicate which core the view is "pinned" to.

Debug commands (step, reset, etc) will apply only to the selected core with context.
7.5.3.3. Grouping Cores
Somme debug commands can be sent to a specific set of cores at the same time. This can be done by "grouping" the cores of interest in the Threads view.
To group cores: Bring up the context menu for a core in the Threads view and select Create Core Group.... This will open the New Core Group dialog:

Select the cores to group from the Available Cores list. A unique name for the group can be specified. Select OK to create the group.
The Enable synchronous group option will attempt to create a special group called a Sync Group. If this option is enabled on a device that does not support it, a warning message will appear and a standard group will be created.
Once the group is created, the Enable Core Group Operations button will appear in the Debug view target execution toolbar. This button is used to toggle between enabling and disabling the group. The group is disabled by default. When the group is enabled, all cores in the group will be identified by the group name. It is possible to create multiple groups. However, a specific core can only belong to one group.

Sending any target connect/disconnect and target execution commands to a member core of a group will be sent to all the cores that are part of the group. Note that for non-synchronous groups, while commands are sent to the cores, it does not always guarantee that execution of the commands are carried out simultaneously. It is important to remember this for target execution commands (run, halt, step, etc) where such precise synchronous execution of commands may be desirable. For this to happen, an actual synchronous (sync) group must be used.
Existing groups can be modified/deleted from the Edit Core Group dialog. This dialog can be opened from the Edit Core Groups... menu item from the context menu of a core in the Threads view.

Options to create a New group or enable Enable core group operations are also available from this dialog.
7.5.3.3.1. Sync Group
A synchronous (or "sync") group is a special type of group similar to a standard group, with the exception that the cores are more tightly grouped - the debugger will attempt to treat all member cores of the sync group as one single debug entity. This type of group is commonly required for effective debugging of an SMP debug environment. For more details on SMP debugging and sync groups, please refer to the article: SMP Debug.
Sync group functionality is not supported on all devices/cores.
7.5.3.4. Hiding Cores
It is possible to filter the list of cores visible in the Threads view that will not be used. This helps to avoid clutter in the view to avoid accidentally selecting a debug context of a core that is not to be used. Select the core to hide and select Hide Selected Core in the context menu. To show any cores that have been hidden, select Show All Cores.
7.5.3.5. Breakpoints (Multi-Core)
The Breakpoints view will always show information for all cores. Enabling the Show Core Name option for the view will display the core that the breakpoint is applicable to.

Each debug context can be configured for Global Breakpoints. This feature will essentially make breakpoints global across all debug contexts that have it enabled. For example, imagine a device with four cores. If the debug contexts for cores 1 and 2 have global breakpoints enabled, and core 1 hits a breakpoint, core 2 will also be halted (if it was running). And vice versa.
Warning
Global breakpoints are supported only for cores that are on the same JTAG scan path (not across multiple debug probes).
To enable global breakpoints for a core: Bring up the context menu for a core in the Threads view and select Enable Global Breakpoints. All cores with global breakpoints enabled will have an additional status message indicating this.

7.5.4. Configuring Flash Settings
CCS comes with an integrated On-Chip Flash Programmer. When a project is configured to use Flash memory regions of the device, the debugger automatically programs the Flash memory for those sections.
Note
Only devices with internal memory are automatically programmed with the built-in flash programmer. External Flash IC devices (I2C, SPI, parallel NAND/NOR) typically use a custom method of programming.
The Flash Settings can be accessed through the Debug Properties
A summary of options per device variant is shown in the next sections, but consult the device documentation for additional information. Please note that the avilable options mentioned below can vary between devices of the same family and hence may be be incomplete or not available depending on the specific device.
7.5.4.1. CC13xx/CC26xx (Cortex M3/M4)
The following settings/operations are supported for CC13xx and CC26xx devices:
Program Load Settings: Sets the erase method, and gives the option to perform blank check and calculate CRC32 on flash memory immediately after the operation.
- All Unprotected Sectors: Erases all regions that is not previously set as protected.
- Necessary Sectors Only: will erase only the flash regions to which the linker has allocated storage.
- Necessary Sectors Only (Retain untouched content within sector): Performs a higher level of granularity for differential Flash programming. This can be used to load multiple executable files that reside in different sectors of memory.
- Specific Sectors: Allows erasing only specific sectors using the Sectors option below.
- Do not erase sectors (program load only): Performs the Flash programming only. Helps speed up the process for knowingly blank devices but can cause issues with pre-flashed devices.
- Use CRC Verification during program load: Performs a CRC calculation and verification of the entire Flash contents.
- Perform Blank Check: Performs a verification if the entire Flash is blank.
Skip Sectors during Program Load: Allows specifying sectors that remain untouched during the Flash erase/program/verification. It can exclude sections based on its previous contents as well.
Customer Configuration (CCFG): Allows for setting various additional device configurations:
- Keep CCFG data: Retains the upper N bytes of the device's CCFG. Consult the device's documentation for additional details.
- Disable Bootloader: Disables the built-in device's bootloader
- Lock debug interface: Prevents access to the debug interface after programming. This is not reversible and should not be used during the debug phase.
- Write-protect sectors: Prevents overwriting of specific sectors using the Sectors option below.
Erase Actions: Manually erase the device's Flash memory.
- Erase entire flash: Erases the entire Flash. The device must be reconnected after this operation.
- Erase specific flash sectors: Erases the sectors specified by the Sectors option below.
- The Flash can be manually erased by clicking on the Erase Flash button.
Device Information: When connected, allows gathering information about the connected device.
Device MAC Addresses: When connected, allows reading and setting the Primary BLE, Secondary BLE, Primary IEEE and Secondary IEEE addresses. Consult the device's documentation for additional details.
Enable Verbose Output: Sets verbose mode output to the Output View
7.5.4.2. F28x
The following settings/operations are supported for F28x devices:
Clock/PLL Settings: These options are critical to configure the device's System Frequency for Flash operations.
- These fields are not modifiable when using a Piccolo device, as the clock control is entirely based on the device’s on-chip oscillator.
Download Settings: These options control the actions to be executed.
- Erase and Program: Performs the Erase followed by Flash programming of the device. This is the safer method to program the devices.
- Program Only: Performs the Flash programming only. Helps speed up the process for knowingly blank devices but can have problems with pre-flashed devices.
- Verify Only: Performs a sanity check on the data flashed to the device.
- Perform Blank Check before loading data to Flash memory: Performs a blank verification before start programming the Flash.
- Verify Flash after Program: Performs a sanity check on the data written to the target device.
- Auto ECC Generation: Enables the generation of Error Correcting Code of the data flashed to the device.
Range Avoidance Settings: Allows specifying ranges that are left untouched by the Flash programmer.
Performance Settings: Enables faster Flash programming by combining memory sections. The use of this option has several tradeoffs shown in the dialog box. Consult the device's documentation for additional details.
Erase Settings: Specifies the various memory ranges to be erased during Flash programming.
- Entire Flash: Erases everything.
- Necessary Sections Only: Erase only the Flash regions to which the linker has allocated storage.
- Selected Sectors Only: Specifies the Flash Banks and Sectors to erase. The Flash can be manually erased by clicking on the button Erase Flash.
- The Flash can be manually erased by clicking on the Erase Flash button.
Blank Check Settings: Performs a verification if the Flash is blank.
- Checksum: Shows the checksup results for the various memory types.
- Click on the Calculate Checksum button to perform the calculations.
Security Settings: Used to program the code security password and other security settings for the various peripherals and memory.
Enable Verbose Output: Sets verbose mode output to the Output View.
Backup RAM during Flash Programming/Operations: Creates a backup copy of the RAM contents during Flash operations.
7.5.4.3. MSP430
The following settings/operations are supported for MSP430 devices:
Target Voltage (mV): Sets the voltage used by the target device.
Download Options: Sets options specific to certain devices.
- Copy application to external SPI memory after program load: Copies the application to external SPI memory. This is used by the Loader ROM code in certain devices.
- Allow Read/Write/Erase access to BSL memory: Allows access to the BSL memory region. This is used to create custom BSL code.
Flash Settings
- Crystal frequency: Sets the crystal frequency required by the Flash algorithm. It needs to match the target board hardware and is set to a default value that matches common development kits.
- Reset target during program load to Flash memory: Enables/disables the system reset signal before the Flash is programmed.
Program Load Settings: Sets the erase method and gives the option to perform blank check and calculate CRC32 on flash memory immediately after the operation.
- Necessary Pages Only: Erase only the flash regions to which the linker has allocated storage.
- Use the Erase Options Specified Below: Enables the options under the Erase section below.
- Do Not Erase Flash Memory: Do not erase anything.
Erase Options: Specifies the various memory types to be erased during Flash programming.
Erase main memory only: Erases only the main memory.
Erase main and information memory: Erases both memory segments.
Erase main, information and protected information memory: Erases the entire memory of the device.
Erase and download necessary segmnents only (Differential Download): Keeps track of the executable previously loaded, performs a comparison between the two, determines the incremental changes and downloads only the modified memory sections. This is particularly useful for development stages where only minor changes are being performed on a large executable.
Warning
This option should NOT be used to load two different programs (such as a bootloader program and application program), as it might erase the first program when loading the second program, and it will also slow down programming as it will try to compare two totally separate programs unnecessarily.
- Replace written memory locations, retain unwritten memory locations: Performs a higher level of granularity for differential Flash programming. This can be used to load multiple executable files that reside in different sections of memory.
- If there is a section that overlaps (such as vector table), the last executable to be downloaded is the one whose vector table needs to be retained, so the correct one is preserved on the target device.
By Address Range (specify below): Specifies the start and end address of flash to erase.
Erase Settings: Sets the Start Address and the End Address when the option By Address Range above is selected.
Device Information: When connected, allows gathering information about the connected device.
Enable Verbose Output: Sets verbose mode output to the Output View
7.5.5. Real-time Mode
Real-time mode is a special feature of selected devices and configurable via the CCS debugger that allows developers to halt and examine the program and its memory without blocking the service of any critical pre-configured interrupts.
Real-time mode enables programmers to:
- Examine and modify contents of memory/register locations while CPU is running and executing code.
- Halt/debug application while allowing user specified time critical interrupts to be serviced without interference.
The devices that support official Real-time mode are all TI C55x, C64x, C674x, C66x and F28x devices through a built-in module called ICEMaker. ARM Cortex M/R based devices support do not support full real-time mode. But they do support real-time (non-intrusive) memory accesses through the Debug Access Port (DAP).
Note that real-time (non-intrusive) memory accesses are always enabled on devices that support them, regardless of whether real-time mode is explicitly enabled or not in CCS Theia.
Memory accesses and halts issued from the debugger can be blocked. For example, when in a critical section of code setting the DBGM (Debug Mask) bit in status/control register will block accesses.
The DBGM bit can be set in hardware or from the application. In some devices, the hardware sets it automatically when any interrupt is taken.
There are two types of real-time mode:
Polite real-time mode (default when real-time mode is enabled):
- DBGM settings are respected by debugger.
- Debugger will not stall the processor to make memory accesses, but rather will wait for processor to get into non-critical section of code before making the access.
Rude real-time mode
- DBGM settings are ignored by debugger and accesses are made anyway.
- Allows for error recovery if application sets these bits and then hangs.
When halted in real-time mode, time critical interrupts can continue to be serviced. The Debug Interrupt Enable Register (DBGIER on C28x) is used to designate time-critical interrupts. Interrupts which are enabled by both IER and DBGIER will be serviced when halted in real-time mode, regardless of global interrupt mask bit (INTM on C28x)
Options to enable/disable real-time mode and toggle between polite/rude real-time mode are available under the Realtime Mode and Polite Mode menu items under the main Run menu.
Real-time mode is especially popular with F28x developers operating with high power systems, thus usage references for this device family can be seen in the below video:
- Video: C2000 Real-Time Features
7.5.6. Advanced Debug Probe Configurations
The Advanced tab of the Target Configuration Editor has a set of common configurations and a few items specific to each Debug Probe. Below follows a short list of the configurations present for each model and variant.
7.5.6.1. XDS110
Board Data File: CCS requires a small text file to properly characterize the Debug Probe an board or device attached to it. This option controls the generation of this file. Leave it in auto generate unless in very special circumstances.
Debug Probe Selection: Informs CCS if there are one or more Debug Probes tied to the host. it features the options One one XDS110 installed or Select by serial number.
- The option Select by serial number opens the extra option Enter the serial number to allow typing the serial number of the Debug Probe to be used.
Power Selection: Configures the type of power method applied to the target: Target supplied power or Probe supplied power (EnergyTrace).
- The option Probe supplied power opens the extra option Enter voltage: with a form to input the voltage supplied by the XDS110 to the target.
Power isolation: Sets the behaviour of the XDS110 probe after the CCS debug session disconnects from the target device/board: Remove power at final disconnect or Keep power at final disconnect. For additional details, check the section 3.1.2.2 of the Addendum and errata to XDS110 Users Guide at the XDS110 page
JTAG TCLK Frequency (MHz): Sets the JTAG TCLK frequency between Fixed default 8.5MHz frequency, Fixed with user specified value or Fixed with user selected faster value.
- The two last selections open an extra option to either type the desired frequency or select among three pre-selected options.
JTAG / SWD / cJTAG Mode: Configures the type of signaling to be used: 4-pin JTAG (IEEE1149.1), SWD modes with either Auxiliary UART or SWO Trace enabled, 4-pin cJTAG (IEEE1149.7) and 2-pin cJTAG (IEEE1149.7). Consult the device's Technical Reference Manual for the modes supported by the device being used.
The 2-pin cJTAG option opens two extra options:
- Target Scan Format, which configures the mode of operation of the cJTAG module
- Auxiliary COM Por Connection, which enables either the UART communications port or SWO Trace.
7.5.6.2. XDS200
Board Data File: CCS requires a small text file to properly characterize the Debug Probe an board or device attached to it. This option controls the generation of this file. Leave it in auto generate unless in very special circumstances.
Debug Probe I/O Port Number: Configures which Debug Probe tied to the host has to be used. Each I/O port is dynamically allocated and is set by the order of which Debug Probe was plugged to the host.
- The option User Defined Port Number opens the extra option Enter a User Defined Port Number to allow typing port numbers greater than 3.
The JTAG nTRST Boot-Mode: Sets the status of the EMU0 and EMU1 pins to allow special Boundary scan modes to be sampled at the switch of the TRST signal. Consult the device's Technical Reference Manual for the modes supported by the device being used.
The Power On-Reset Boot-Mode: Sets the status of the EMU0 and EMU1 pins to allow special device boot modes to be sampled at power up. Read the device's Technical Reference Manual for details.
JTAG TCLK Frequency (MHz): Sets the JTAG TCLK frequency between Fixed with user specified faster value, Adaptive with user specified limit.
- The option Enter a value is always enabled to allow typing the desired frequency.
The JTAG Signals Isolation Upon Disconnect: Sets the behaviour of the Debug Probe after the CCS debug session disconnects from the target device/board: Do not isolate JTAG signals when last client disconnects or Isolate JTAG signals when last client disconnects.
Apply nRESET/SRST pin on the debug header: Configures the behaviour of the nRESET pin to be asserted at the beginning of every debug session.
JTAG / SWD / cJTAG Mode: Configures the type of signaling to be used: 4-pin JTAG (IEEE1149.1), SWD modes with either Auxiliary UART or SWO Trace enabled, 4-pin cJTAG (IEEE1149.7) and 2-pin cJTAG (IEEE1149.7). Consult the device's Technical Reference Manual for the modes supported by the device being used.
The 4-pin cJTAG option opens two extra options:
- The Converter 1149.7 Frequency Source: Adjusts the clock source and type for the cJTAG operation.
- The Target Pin Width: Adjusts the bus width of the target hardware.
The 2-pin cJTAG option opens four extra options:
- Target Scan Format: Configures the mode of operation of the cJTAG module.
- The Target Pin Width: Adjusts the bus width of the target hardware.
- User COM Por Connection, which enables either the UART communications port or the standard TDO data pin.
7.5.6.3. XDS560v2
Board Data File: CCS requires a small text file to properly characterize the Debug Probe an board or device attached to it. This option controls the generation of this file. Leave it in auto generate unless in very special circumstances.
Emulator I/O Port Number: Configures which Debug Probe tied to the host has to be used. Each I/O port is dynamically allocated and is set by the order of which Debug Probe was plugged to the host.
- The option User Defined Port Number opens the extra option Enter a User Defined Port Number to allow typing port numbers greater than 3.
JTAG TCLK Frequency (MHz): sets the JTAG TCLK frequency between:
- Automatic with faster 35.0MHz limit: The debug probe performs a signal integrity test until it reaches the highest speed up to 35.0MHz.
- Automatic with legacy 10.368MHz limit: The debug probe performs a signal integrity test until it reaches the highest speed up to 10.368MHz. It can help connecting to boards in noisier environments.
- Automatic with user specified limit: The debug probe performs a signal integrity test until it reaches the highest speed up to the user-defined value passed to the option Enter a value.
- Adaptive with user specified limit: The debug probe performs a signal integrity test until it reaches the highest speed up to the user-defined value passed to the option Enter a value.
- Adaptive without any limit at all: The debug probe performs a signal integrity test until it reaches the highest speed possible.
- Fixed with user specified faster value: The debug probe attempts to connect at the speed defined by the user-defined value passed to the option Enter a value. If the connection is unreliable, it reduces the TCLK speed to get a reliable connection.
- Fixed with user specified slower value: The debug probe attempts to connect at the speed defined by the user-defined value passed to the option Enter a value. If the connection is unreliable, it increases the TCLK speed to get a reliable connection.
- TCLK looped-back with user specified limit: The debug probe shorts TCK and RTCK internally to allow connecting to targets that do not have this connection provisioned.
TMS/TDO Output Timing: Adjusts the operation mode of the TMS signal to allow for a faster but less compatible operation mode.
The JTAG nTRST Boot-Mode: Sets the status of the EMU0 and EMU1 pins to allow special Boundary scan modes to be sampled at the switch of the TRST signal. Consult the device's Technical Reference Manual for the modes supported by the device being used.
The Power On-Reset Boot-Mode: Sets the status of the EMU0 and EMU1 pins to allow special device boot modes to be sampled at power up. Read the device's Technical Reference Manual for details.
The Boot-Mode Pin Map: Sets the functions of each EMU0 and EMU1 pins, giving limited GPIO control over these pins to set modes and hardware features (if the target board is routed to do so).
The JTAG Signals Isolation Upon Disconnect: Sets the behaviour of the Debug Probe after the CCS debug session disconnects from the target device/board: Do not isolate JTAG signals when last client disconnects or Isolate JTAG signals when last client disconnects.
The cJTAG Converter Features: Configures the type of signaling to be used: 4-pin JTAG (IEEE1149.1), 4-pin cJTAG (IEEE1149.7) or 2-pin cJTAG (IEEE1149.7). Consult the device's Technical Reference Manual for the modes supported by the device being used.
The 4-pin cJTAG option opens two extra options:
- The Converter 1149.7 Frequency Source: Adjusts the clock source and type for the cJTAG operation.
- The Target Pin Width: Adjusts the bus width of the target hardware.
The 2-pin cJTAG option opens four extra options:
- The Converter 1149.7 Frequency Source: Adjusts the clock source.
- The Converter 1149.7 Frequency Value: Adjusts the clock frequency.
- The Target Pin Width: Adjusts the bus width of the target hardware.
Target Scan Format: Configures the mode of operation of the cJTAG module.
7.5.6.4. XDS 560v2 ProTrace
Board Data File: CCS requires a small text file to properly characterize the Debug Probe an board or device attached to it. This option controls the generation of this file. Leave it in auto generate unless in very special circumstances.
Emulator I/O Port Number: Configures which Debug Probe tied to the host has to be used. Each I/O port is dynamically allocated and is set by the order of which Debug Probe was plugged to the host.
- The option User Defined Port Number opens the extra option Enter a User Defined Port Number to allow typing port numbers greater than 3.
JTAG TCLK Frequency (MHz): Sets the JTAG TCLK frequency between Adaptive, Fixed with specified value or TCLK looped-back with user specified limit.
- The last two selections enable the option Choose a value, which allows selecting between Slow, Typical and Fast (maximum of 6.5MHz)
TMS/TDO Output Timing: Adjusts the operation mode of the TMS signal to allow for a faster but less compatible operation mode.
The JTAG nTRST Boot-Mode: Sets the status of the EMU0 and EMU1 pins to allow special Boundary scan modes to be sampled at the switch of the TRST signal. Consult the device's Technical Reference Manual for the modes supported by the device being used.
The Power On-Reset Boot-Mode: Sets the status of the EMU0 and EMU1 pins to allow special device boot modes to be sampled at power up. Read the device's Technical Reference Manual for details.
The Boot-Mode Pin Map: Sets the functions of each EMU0 and EMU1 pins, giving limited GPIO control over these pins to set modes and hardware features (if the target board is routed to do so).
The JTAG Signals Isolation Upon Disconnect: Sets the behaviour of the Debug Probe after the CCS debug session disconnects from the target device/board: Do not isolate JTAG signals when last client disconnects or Isolate JTAG signals when last client disconnects.
The cJTAG Converter Features: Configures the type of signaling to be used: 4-pin JTAG (IEEE1149.1), 4-pin cJTAG (IEEE1149.7) or 2-pin cJTAG (IEEE1149.7). Consult the device's Technical Reference Manual for the modes supported by the device being used.
The 4-pin cJTAG option opens two extra options:
- The Converter 1149.7 Frequency Source: Adjusts the clock source and type for the cJTAG operation.
- The Target Pin Width: Adjusts the bus width of the target hardware.
The 2-pin cJTAG option opens four extra options:
- The Converter 1149.7 Frequency Source: Adjusts the clock source.
- The Converter 1149.7 Frequency Value: Adjusts the clock frequency.
- The Target Pin Width: Adjusts the bus width of the target hardware.
Target Scan Format: Configures the mode of operation of the cJTAG module.
7.5.6.5. XDS100v2 and XDS100v3
Board Data File: CCS requires a small text file to properly characterize the Debug Probe an board or device attached to it. This option controls the generation of this file. Leave it in auto generate unless in very special circumstances.
Debug Probe Selection: Informs CCS if there are one or more Debug Probes tied to the host. it features the options One one XDS100 installed or Select by serial number.
- The option Select by serial number opens the extra option Enter the serial number to allow typing the serial number of the Debug Probe to be used.
The JTAG nTRST Boot-Mode: Sets the status of the EMU0 and EMU1 pins to allow special Boundary scan modes to be sampled at the switch of the TRST signal. Consult the device's Technical Reference Manual for the modes supported by the device being used.
The Power On-Reset Boot-Mode: Sets the status of the EMU0 and EMU1 pins to allow special device boot modes to be sampled at power up. Read the device's Technical Reference Manual for details.
JTAG TCLK Frequency (MHz): Sets the JTAG TCLK frequency between:
- Fixed default 1.0MHz frequency: Connects at the fixed frequency of 1.0MHz.
- Adaptive with user specified limit: Connects using Adaptive clock using the user-defined TCLK value passed to the option Enter a value.
- Fixed with user specified faster value: The debug probe attempts to connect at the speed defined by the user-defined value passed to the option Enter a value. If the connection is unreliable, it reduces the TCLK speed within a narrow range to get a reliable connection.
- Fixed with user specified slower value: The debug probe attempts to connect at the speed defined by the user-defined value passed to the option Enter a value. If the connection is unreliable, it increases the TCLK speed within a narrow range to get a reliable connection.
The XDS100v3 adds the following options:
The JTAG Signals Isolation Upon Disconnect: Sets the behaviour of the Debug Probe after the CCS debug session disconnects from the target device/board: Do not isolate JTAG signals when last client disconnects or Isolate JTAG signals when last client disconnects.
The Converter Usage: Configures the type of signaling to be used: 4-pin JTAG (IEEE1149.1), 4-pin cJTAG (IEEE1149.7) or 2-pin cJTAG (IEEE1149.7). Consult the device's Technical Reference Manual for the modes supported by the device being used.
The 2-pin cJTAG option opens three extra options:
- The Converter 1149.7 Frequency: Adjusts the clock source of the cJTAG converter.
- The Debug Probe 1149.1 Frequency: Adjusts the clock frequency of the 4-pin JTAG/cJTAG.
Target Scan Format: Configures the mode of operation of the cJTAG module.