
|
CapTIvate™ Technology Guide
v1.10.00.00
|
|
CapTIvate™ Technology Guide
v1.10.00.00
|
The CapTIvate™ Design Center is a rapid development tool that accelerates capacitive touch designs for CapTIvate™ Technology enabled MSP430 devices. By helping guide the product developer through the capacitive touch development process, the CapTIvate™ Design Center can simplify and accelerate any touch design through the use of innovative user graphical interfaces, wizards and controls.
A PC with the following requirements is required to execute the CapTIvate™ Design Center:
The source code projects generated by the tool support the following IDEs:
If you are not running the application using a root account, you may not have permissions to the HID device mounted by the MSP microcontroller.
To enable access perform the one-time setup step:
The CapTIvate™ Design Center is released under the BSD 3-clause license. See the license manifest in the installation directory for details.
This section is intended to provide a very basic and quick overview of how to use the CapTIvate™ Design Center to define a typical capacitive touch design, generate source code, and communicate with the target. For additional detailed information about the features of the CapTIvate™ Design Center, refer to the CapTIvate™ Design Center user's guide.
When ready to start your own design, check out the workshop guide section, Creating a new sensor design project.
Double click on the desktop "CapTIvateDesignCenter" short cut to start the tool.

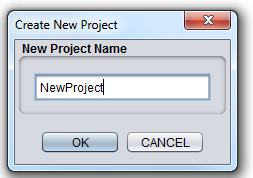
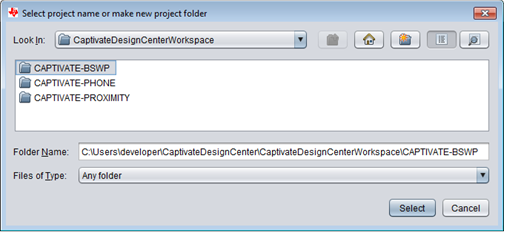
Use the File->Project New menu to create a new project
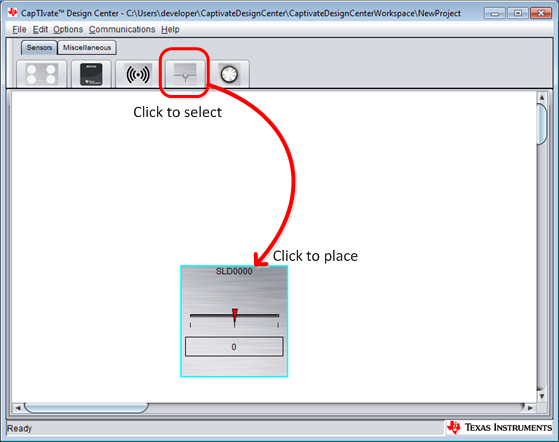
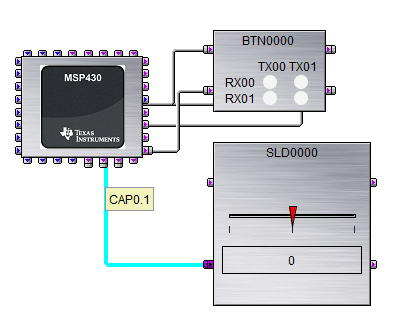
Select the slider by clicking on the sensor icon. Place the new object by clicking on the design canvas.
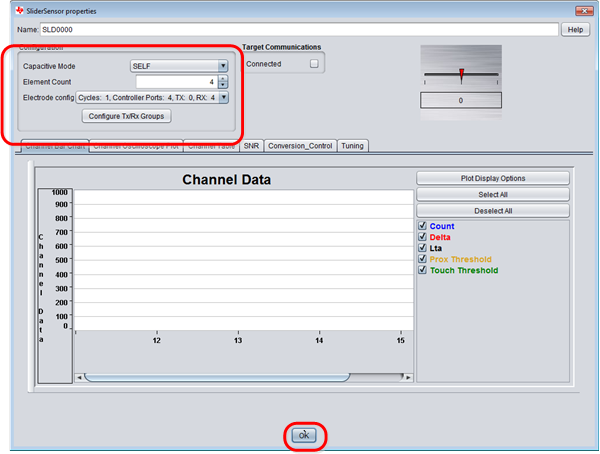
Display the sensor properties to configure it to be a Self capacitance slider with 4 elements.
Select the wheel by clicking on the sensor icon. Place the new object by clicking on the design canvas.
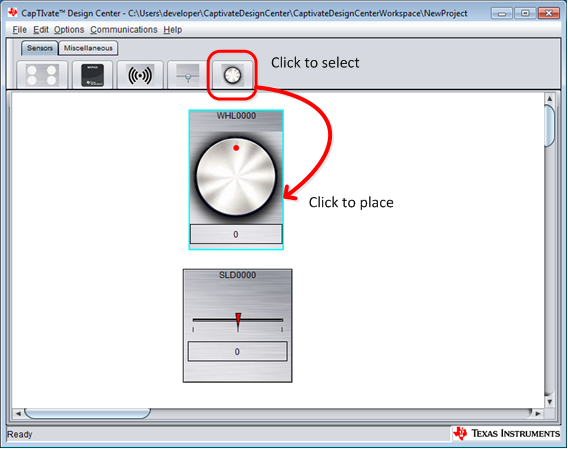
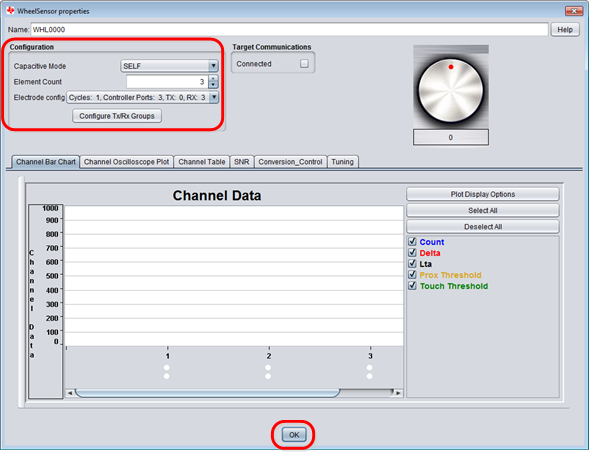
Display the sensor properties to configure it to be a Self capacitance wheel with 3 elements.
Select the button group by clicking on the sensor icon. Place the new object by clicking on the design canvas.
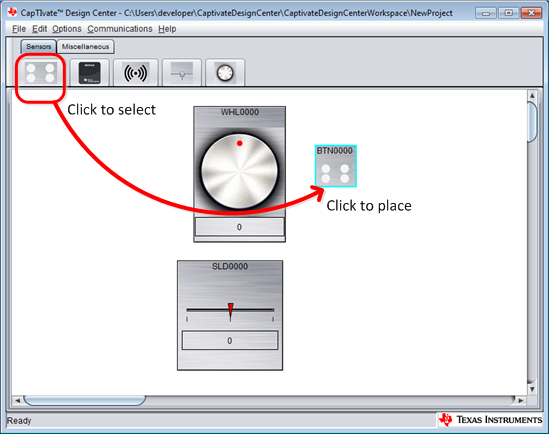
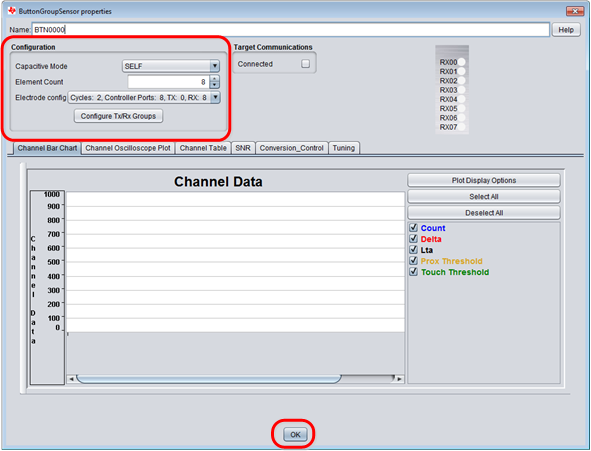
Display the sensor properties to configure it to be a Self capacitance button group with 8 elements.
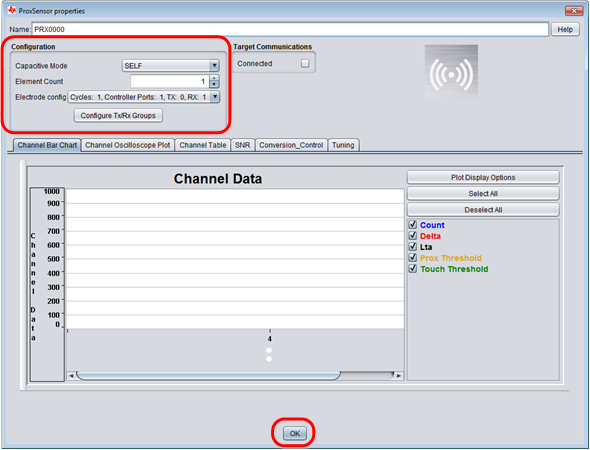
Select the proximity sensor by clicking on the sensor icon. Place the new object by clicking on the design canvas.
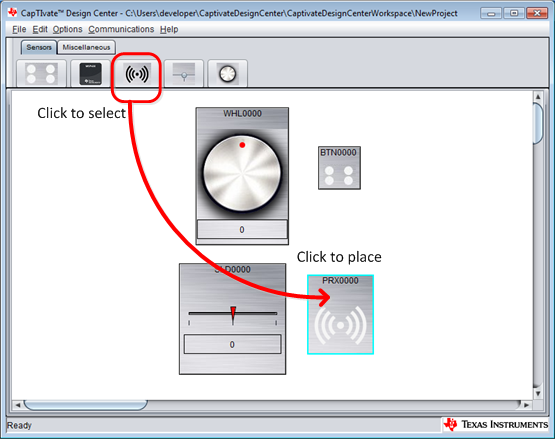
Display the sensor properties to configure it to be a Self capacitance proximity with 1 element.
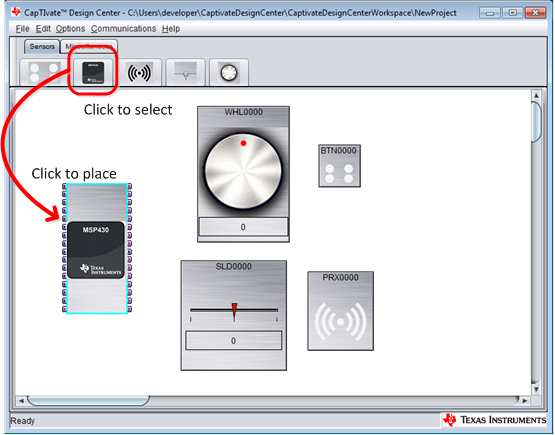
Select the MSP430 by clicking on the MCU icon. Place the new object by clicking on the design canvas.
Double-click on the MSP430 controller object in the design area to display its properties.
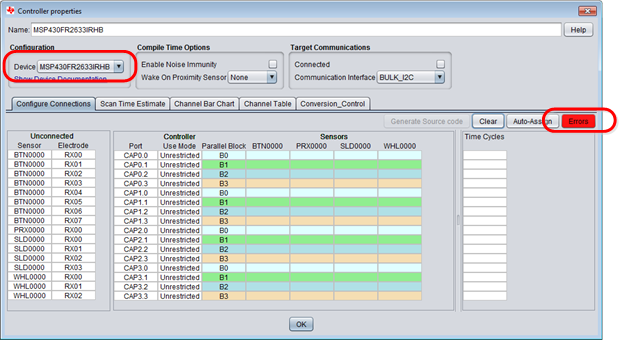
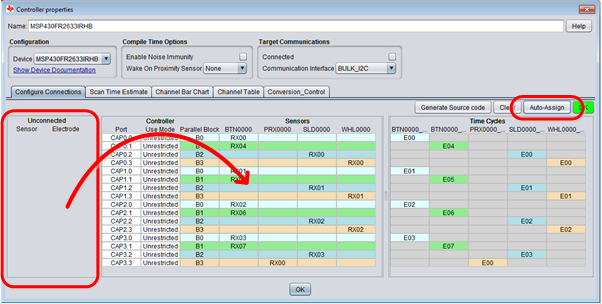
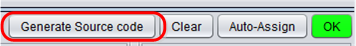
Select the "Auto-Assign" button to automatically assign all the sensor ports to appropriate ports on the MSP430. Note that the "Errors" LED turns green and "OK", indicating that all sensor ports have been assigned to controller ports.
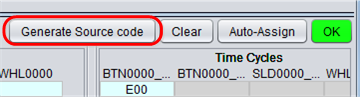
Select the "Generate Code" button on the MSP430 Controller properties dialog.
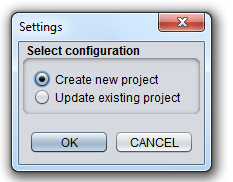
Select "Create new project" then "OK" in the dialog indicating that you want to create a new full project.
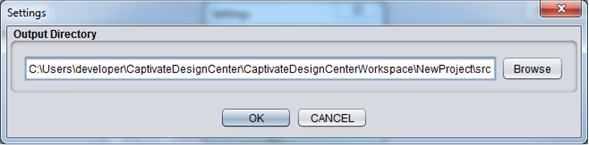
Select "OK" to keep the default location for the generated code.
For information regarding importing/opening project in CCS or IAR and running the generated projects please refer to Loading and Running Generated Projects
This section shows some examples of how the data read from the target over HID is displayed.
Note that you will not see any valid sensor data unless your target board is connected to a sensor board that matches the configuration created in the Design Center GUI.
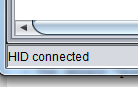
Enable the HID communication by selecting the menu "Communications->Connect." Verify the HID device is connected by viewing the message in the main window lower left corner.
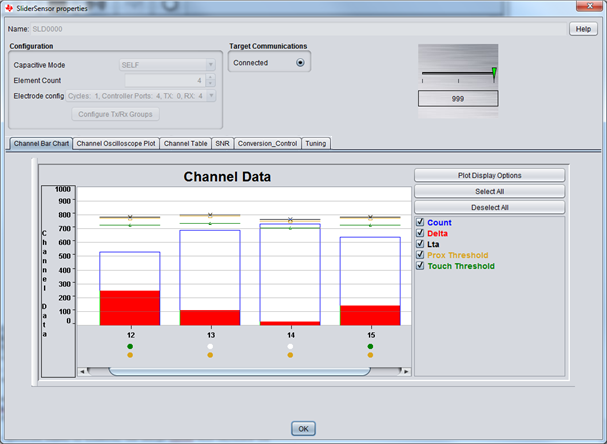
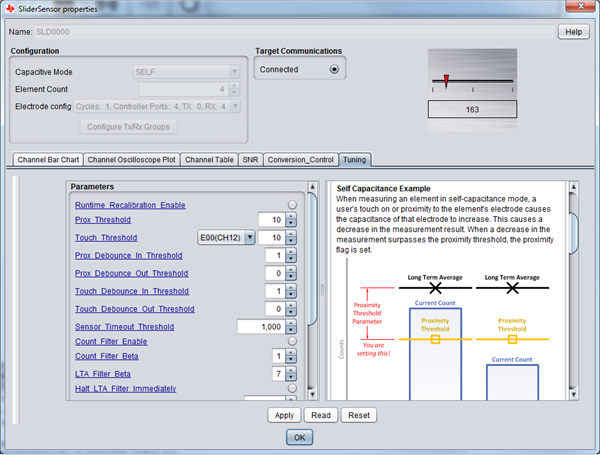
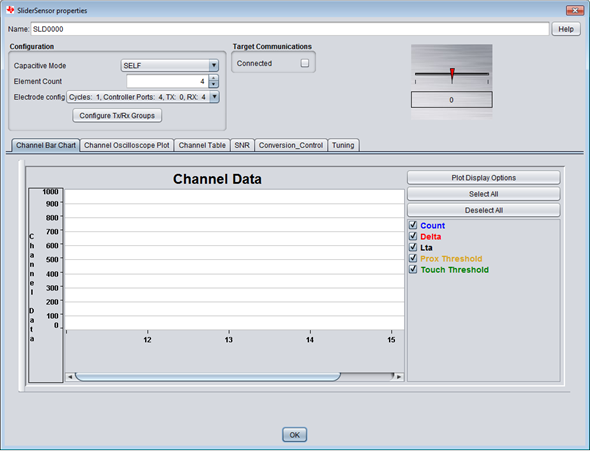
Double click on the slider object to display the properties dialog. The tabs are used to display graphs of the real-time sensor data, and also to enable reading and modifying the sensor's configuration and tuning parameters. The sensor "position" is also reflected in the display.
Sensors can be configured in real-time using the Tuning panel. Modify the desired parameter then click "Apply". All parameters are described directly in the panel for ease of use. Sensor parameters can only be modified when the target is connected.
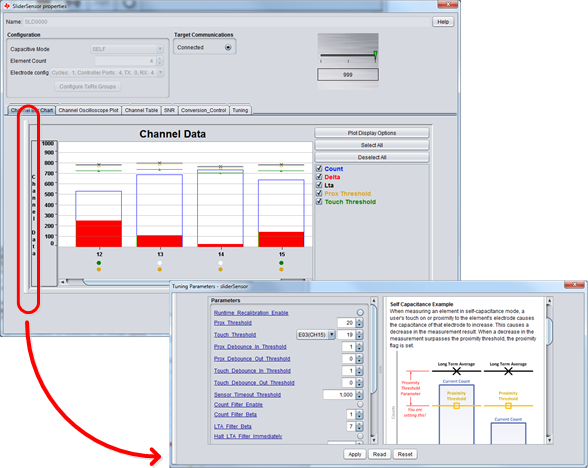
It is possible to "un-dock" any of the tuning views to allow easier viewing of one or more views at one time. Click and drag the handle on the left of the view to position as needed. Closing an un-docked window returns it to the tab pane.
For additional detailed information about the features of the CapTIvate™ Design Center, refer to the CapTIvate™ Design Center user's guide.
When ready to start your own design, check out the workshop guide section, Creating a new sensor design project.
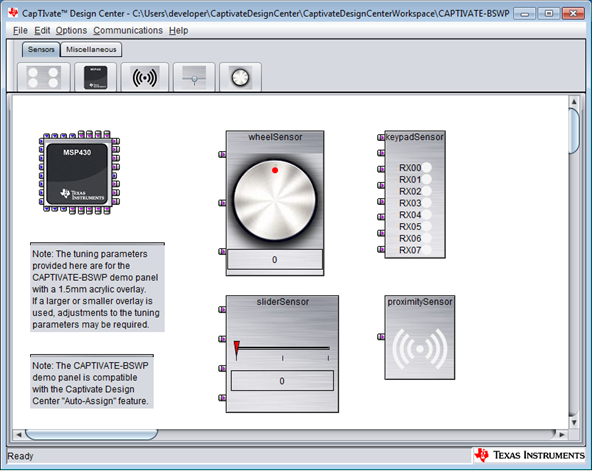
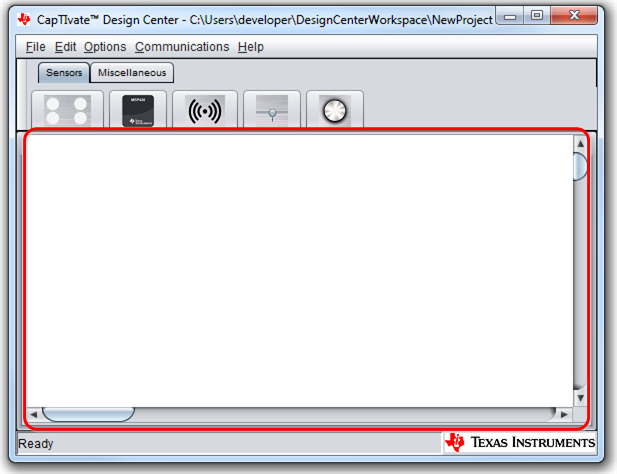
The Design Center GUI consists of three main panels; Menu bar, Object selection tab and Design canvas.
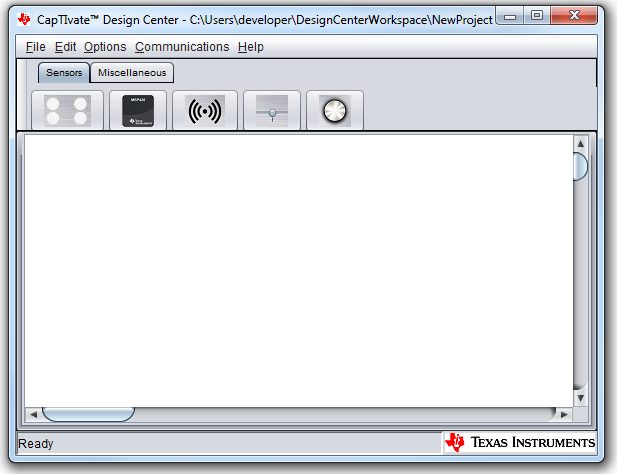
The menu bar provides access to the GUI's features and controls.

The object selection tab displays objects can be selected for placement in the design canvas. Object types include:
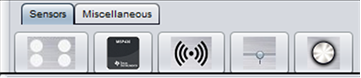
To place an object in the design canvas:
Objects may be selected and moved anywhere on the canvas. Additional object operations can be displayed by right-clicking the mouse button on the object. To display the properties and configure the object, double-click using the left mouse button. To access the on-line help for an object type, select it and press the F1 key.
This menu item provides selections for projects, workspaces and printing.
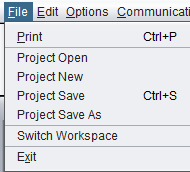
Allows the user to print the window.
Allows the user to:
The design center stores projects within a workspace directory. This menu allows the user to change open a different workspace. This behavior is similar to the way TI Code Composer Studio uses workspaces and projects.
The default workspace path is USERPROFILE%/CaptivateDesignCenter/CaptivateDesignCenterWorkspace.
Exit the CapTIvate™ Design Center application.
This menu item provides options for deleting or restoring one or more selected objects. For example, if the canvas is populated with multiple sensors, to clear the canvas simply select all, then cut (delete).
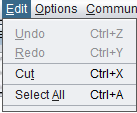
Undo or redo a previous edit menu operation.
Remove the selected object from the design
Select all the objects in the design canvas
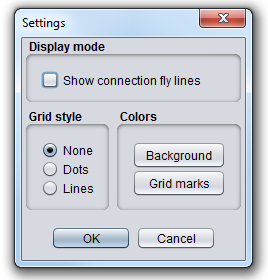
Allows the user to customize the display of the design canvas.
Modifies the canvas.
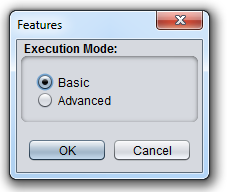
Changes the feature mode. In "Advanced" mode, more sensor tuning and configuration options are displayed.
Modifies the communications.
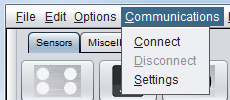
Controls whether the Design Center communicates with the target board over HID.
Enables the user to change the HID connection parameters.
NOTE: The parameters default to the correct values for TI's CapTIvate™ Technology EVMs.
Access to the CapTIvate™ Documentation and software version.

Displays the help documentation in a browser window.
Displays software version information.
Double clicking on the controller object will display the properties dialog.
The properties dialog for a controller object allows the user to:
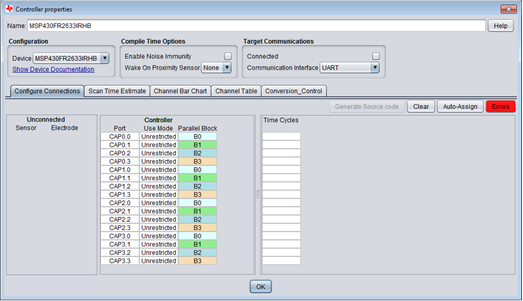
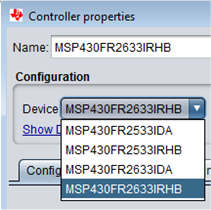
Select the desired MSP430 device with CapTIvate™ Technology from the pull-down list. When using the CapTIvate™ EVM, choose the MSP430FR2633IRHB.
Enable/disable target communications using this button. This is equivalent to the Communications->Connect/Disconnect menu items. The Communication Interface provides UART and I2C selections for the HID Bridge MCU to target MCU communications interface. To change the current interface, select a new one and click the "Connected" button. The HID Bridge MCU on the CAPTIVATE-PGMR PCB will immediately start using the new interface. When generating source code, the generated project files will be updated to provide support for the new interface.

Compile options can be selected to enable additional features provided in software. These features, when selected, are added to the code project generated by the CapTIvate™ Design Center.
There are three ways to map the sensor ports to controller pins:
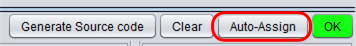
If the "Auto-Assign" button is selected, the Design Center will attempt to optimally connect all of the unconnected the sensor ports to the controller. Note that any connections that already exist will not be changed. In this manner, it is possible to make some connections manually, and then auto-assign the rest.
This is a good option if there are no pre-existing restrictions on the mapping. For example, if the mapping is constrained due to board layout considerations, users should choose one of the other options.
If the assignment completes successfully, the "Errors" indicator will turn green. If the indicator is "red", errors still exist. Clicking on the indicator will display a dialog with a listing of the remaining errors.
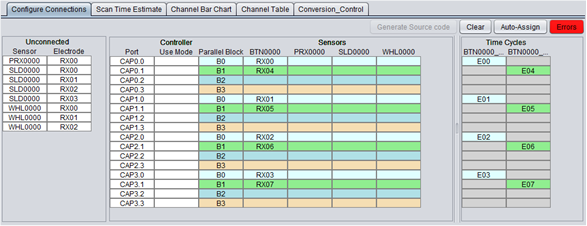
The Configure Connection table enables detailed control for mapping the sensor ports to the controller ports. The table is split into 3 main parts:
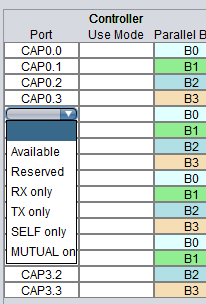
Selecting a cell in the port column will bring up a pull-down menu that allows the user to control the usage mode of the port. Ths "Use Mode" column will be updated to display any restrictions made a controller pin.
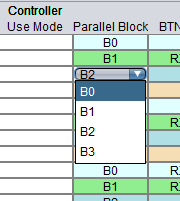
Selecting a cell in the port column will bring up a pull-down menu that allows This column allows the user to modify which pins are assigned to each parallel sense block.
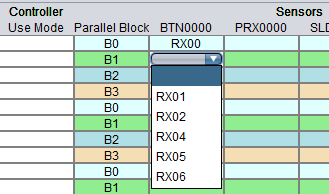
Selecting a cell in a sensor column will display the list of unconnected ports for that sensor which are legally allowed to be assigned to that controller pin. As sensor ports are assigned, the Unconnected and Time Cycle tables are dynamically updated.
Connections between the controller and sensors can be made by clicking the port on the sensor and dragging the connection to the desired port on the controller.
Note: Be sure to display the connections first using the Options->Display menu item.
Source code for the design can be generated once all the sensor ports have been connected to the controller.
This option will create a complete project with the design specific definitions, support code, and CSS/IAR project files.
This option will only update the design specific definition files. Use this option to update a project that has already been imported into an IDE.
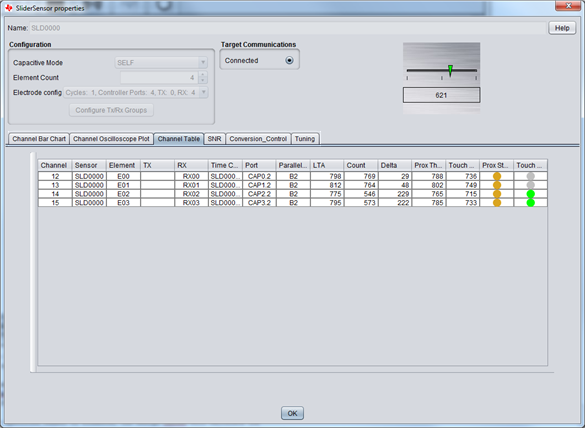
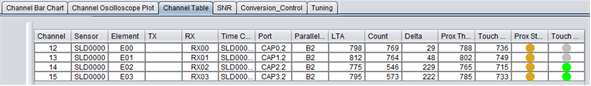
See Channel Table
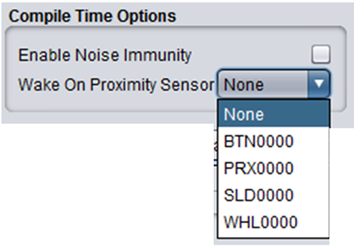
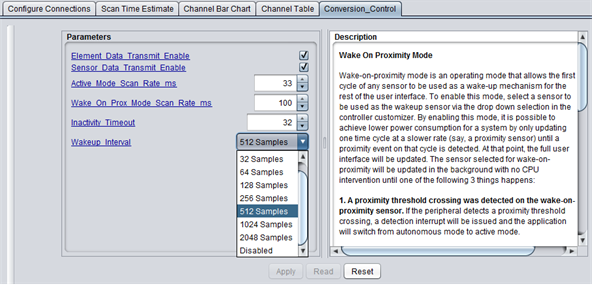
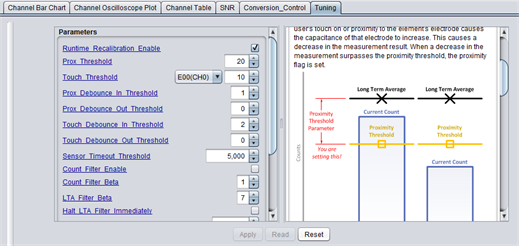
There are two groups of parameters that are controlled in this tab; one for data control, the other for wake on proximity. Clicking on any parameter will display a description for it in the "Description" viewing pane to the right of the parameter.
These controls provide a method to minimize the amount of data sent from the target MCU to the CapTIvate™ Design Center during real-time tuning. By default, these both should be "checked." For designs with large number of sensors or elements, the data transmission can be very large and potentially slow down the report rate during sensor tuning. Deselecting one or the other will help improve the throughput.
When using wake on proximity for ultra-low power proximity detection, it is possible to select:
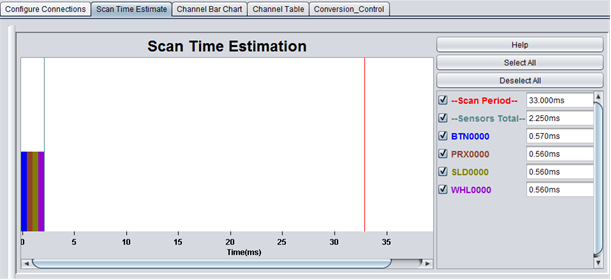
The scan time estimator displays the nominal amount of time it will take to measure each sensor, drawn with respect to the overall scan period. The overall scan period is controlled by the System Report Rate parameter.
Double clicking on a sensor object will display the properties dialog. The properties dialog for a sensor object allows the user to:
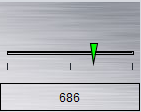
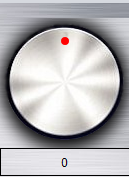
Each properties dialog will display the "position" of the sensor. The rendering of this information is specific to the sensor type. The display is active whenever the Design Center target communications are active.
Button Group Sensor Each button in the group is displayed in a grid indexed by the sensor's TX/RX ports.

The sensor configuration is specified through the properties dialog.
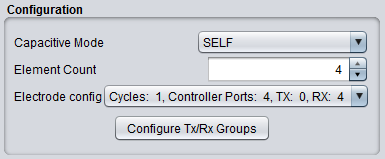
Specify the capacitive mode type for the sensor. Choices are:
Specify the number of elements for sensor.
Based on the specified number of elements, the Design Center will calculate the possible TX/RX port configurations along with the number of time cycles that are required for each of the configurations. The Design Center will default to a configuration that takes the minimum number of time cycles.
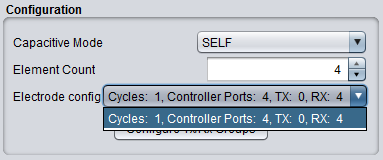
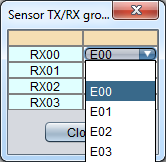
In some cases, it may be desired to change how the default assignment of the sensor elements to the TX/RX ports. Selecting the "Configure TX/RX Groups" will display a dialog where these mappings can be changed.
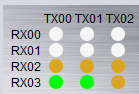
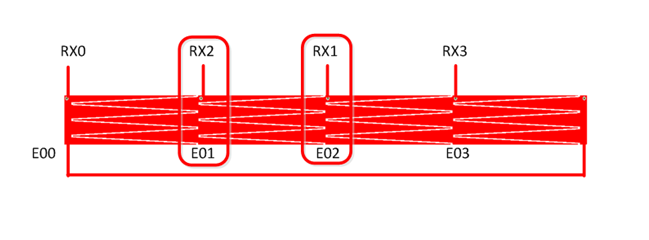
The example below shows a typical 4-element self capacitive slider with default TX/RX group assignment. Note how the Design Center assigns RX0..RX3 to one pin from each CapTIvate™ block and to the sensor electrodes E00..E03. When designing the PCB it is important to follow these assignments generated by the Design Center. In the case of a slider or wheel, it is very important that RX0->E00, RX1->E01, RX2->E02, etc., else the algorithm will not work correctly.
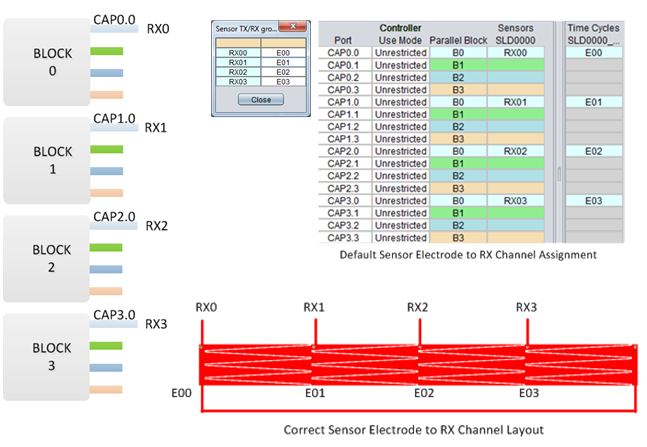
There may be instances where a previous PCB design doesn't match the current Design Center configuration or the PCB routing was done incorrectly. Below is an example showing a 4-element slider with RX1 and RX2 swapped (RX1 assigned to slider element E02 and RX2 assigned to slider element E01).
The Design Center sensor TX/RX group assignments can be overriden to provide electrode assignments that match the PCB design. Below is an example showing how sensor electrode E02 is assigned to RX02 and E01 is assigned to RX01 using the Sensor TX/RX grouping tool. After the re-assignment the Controller properties view shows the new proper sensor electrode assignments and the software can now processes the slider in the correct order.
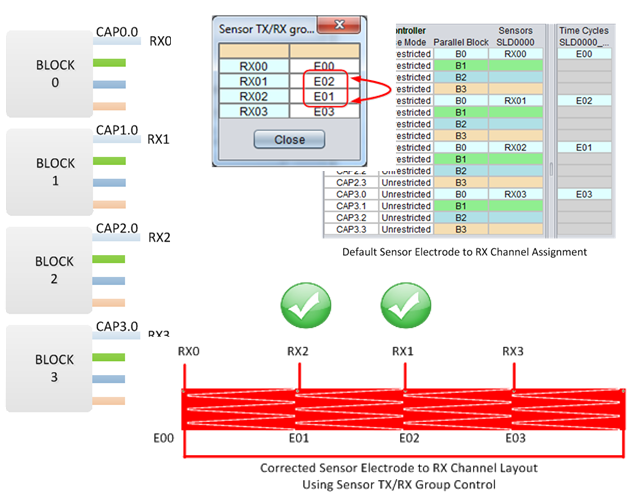
Note, this method provides a convenient way to reverse the behavior of either a slider or wheel if desired.
Enable/disable target communications. This button is equivalent to the Communications->Connect/Disconnect menu items.
See Channel Table
See Channel Table
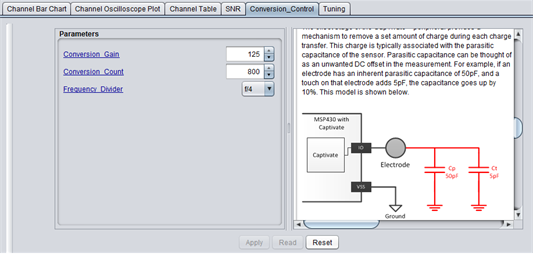
The sensor parameters are specified through the Tuning and Conversion Control tabs. Real-time reading and writing values to the target requires that target communications are enabled.
Parameter values are written to the appropriate structures whenever the source code is generated for the design. The values will take affect after the new source code is compiled and loaded to the target.
It is also possible to read and write values directly to the target in real-time when the target communications are enabled in the Design Center. This enables real-time tuning of sensor performance and can greatly reduce the time necessary to achieve the desired system behavior.
Note: that any values loaded in real time will revert to the original values when the target is reset unless new source code is generated, compiled and loaded to the target.
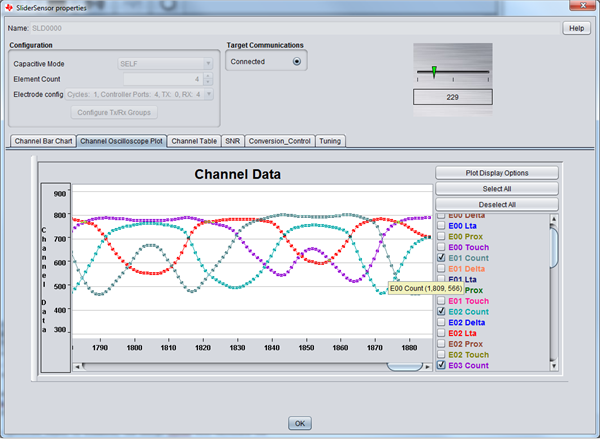
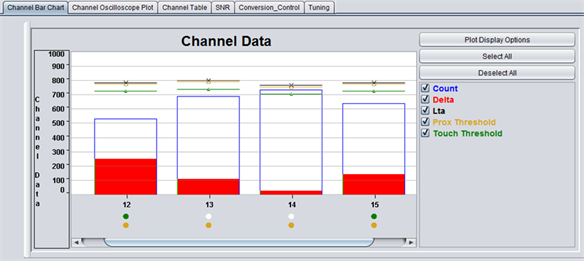
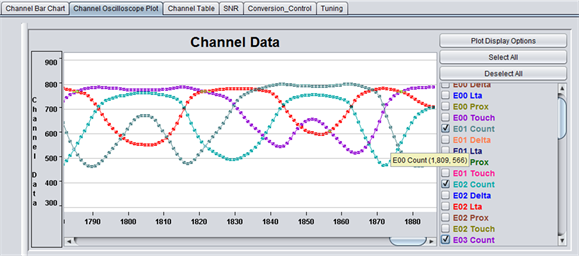
The Design Center provides a rich set of tools to view the sensor data from the target.
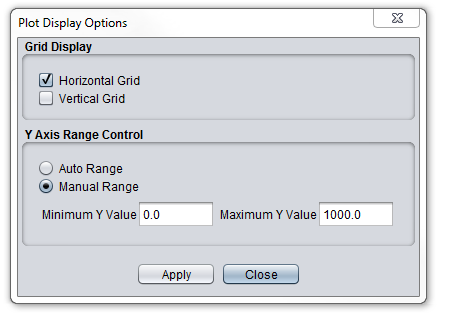
Data displayed for each channel:
Data displayed for each channel:
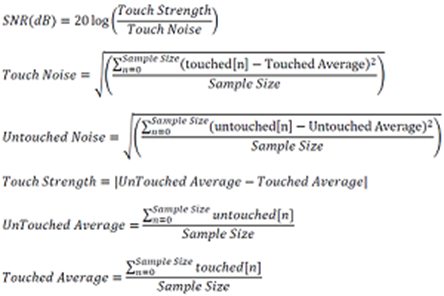
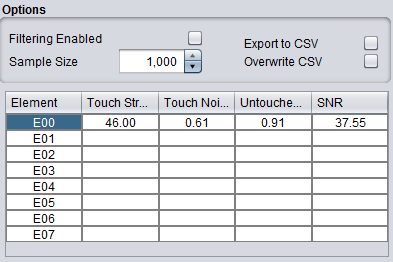
The CapTIvate™ Design Center provides a built-in SNR measurement capability that makes it very easy to perform SNR data collection and calculations in real-time. The SNR measurement view is available on every sensor.
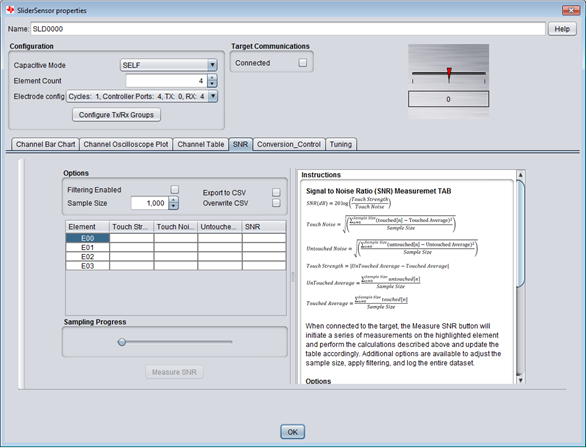
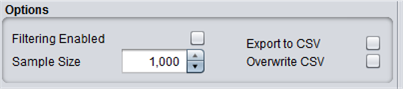
The SNR options provide flexibility for the data collection and measurement process.
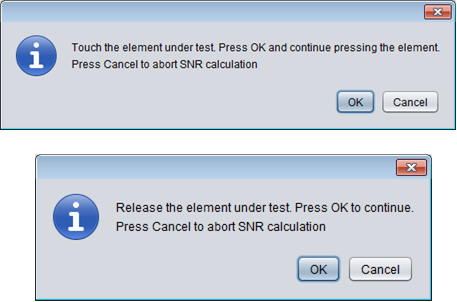
The SNR measurement process is automated, but does require interaction (touch) with the sensors. Only one electrode can be measured at a time. In the table under the SNR options, click to select the electrode to be measured, then click the "Measure SNR" button. The first prompt will appear. Touch and hold the target electrode and click the "OK" button. After the number of samples have been acquired, the second prompt will appear. Remove your finger from the electrode and click the "OK" button.
When the measurement sequence is complete, the SNR calculations are displayed in the selected electrode row.
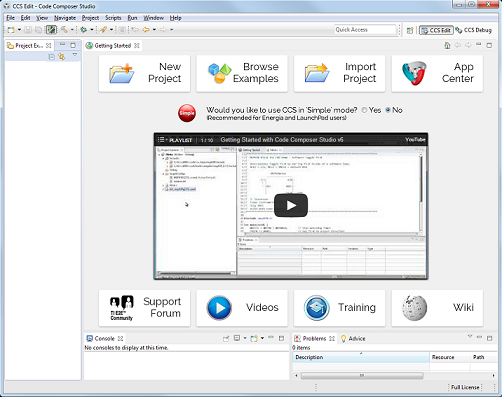
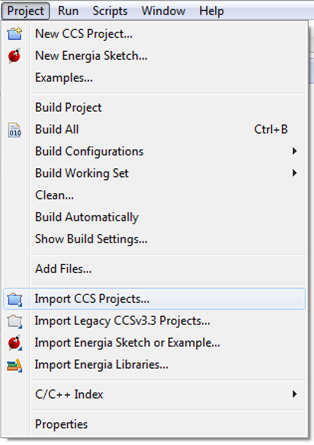
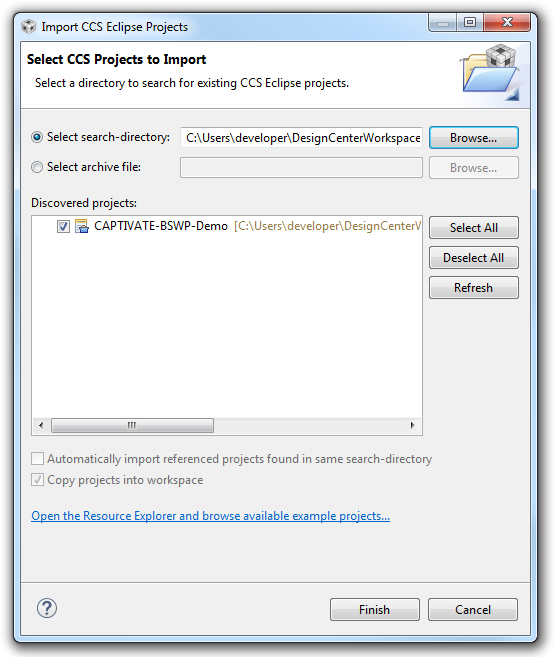
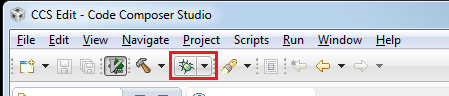
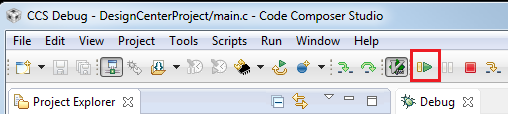
To import a CCS project generated by the Design Center, follow the instructions below.
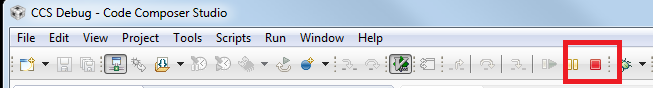
Click the "stop" button to stop the debugger.
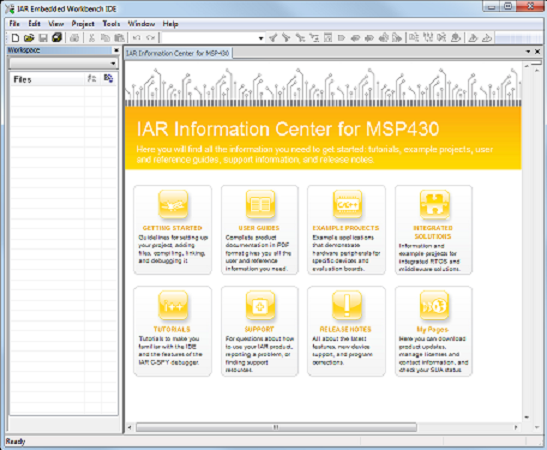
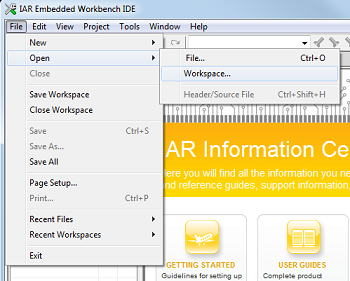
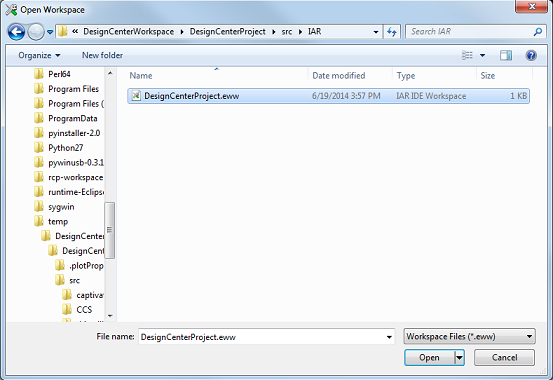
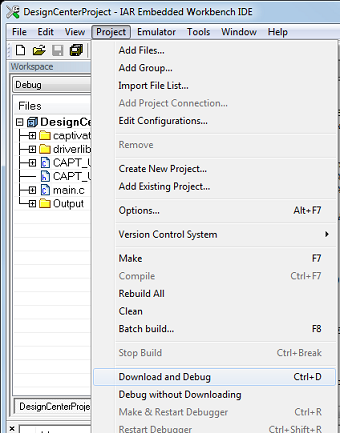
To open an IAR project generated by the Design Center, follow the instructions below.
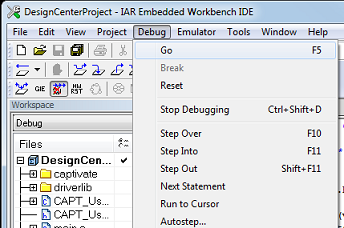
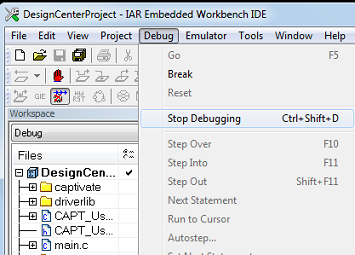
Click the "Stop Debugging" menu item to stop the debugger.
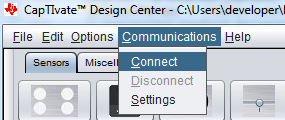
Once the code has been loaded onto the target, select the "Communications->Connect" menu in the Design Center to enable the HID communications.