Performance Visualization Tool
The performance visualization tool can be used to view all the performance statistics recorded when running the edge AI C++ demo application. This includes the CPU and HWA loading, DDR bandwidth, Junction Temperatures and FPS obtained. Refer to Available options for details on the performance metrics available to be plotted.
This tool works as follows:
Logging: When running the application, the performance statistics can be recorded and stored in log files. This is done automatically when running the C++ application, but the Python application does not generate logs. However a standalone binary executable is provided that can be run in parallel with the Python application, which will generate these performance logs.
Visualization: There is a Python script which parses these logs and plots graphs, which can be easily viewed by a visiting a URL in any browser. This script uses Streamlit package to update the graphs in real-time, as the Edge AI application runs in parallel. However, since Streamlit is not supported in the SDK out of box, this script needs to run on docker. Please refer to Docker Environment for building and running a docker container.
Generating Performance Logs
Each log file contains real-time values for some performance metrics, averaged over a 2s window. The temperature sensor values are sampled in real time, every 2s. The performance visualization tool then parses these log files one by one based on the modification timestamps.
The edge AI C++ demo will automatically generate log files and store them in the directory
../perf_logs, that is, one level up from where the C++ app is run. For
example, if the app is run from edge_ai_apps/apps_cpp, the logs will be
stored in edge_ai_apps/perf_logs.
Similarly, there is a binary executable that can be compiled that does the same logging
standalone. The source for this is available under edge_ai_apps/scripts/perf_stats/.
The README.md file has simple instructions to build and run this standalone logger binary.
After building it, use following command to print the statistics on the terminal as well
as save them in log files that can be parsed.
root@tda4vm-sk:/opt/edge_ai_apps/scripts/perf_stats/build# ../bin/Release/ti_perfstats -l
Running the Visualization tool
To use this tool, run the command given below. This script expects some log files to be present
in the directory edge_ai_apps/perf_logs after running any C++ demo. One can also bring up
this tool while running the demo but it might affect the performance of the demo itself
as it consumes a bit of ARM cycles during launch but stabilizes over a certain duration.
root@tda4vm-sk:/opt/edge_ai_apps# streamlit run scripts/perf_vis.py --theme.base="light"
This script also accepts the log directory as a command line argument as follows:
root@tda4vm-sk:/opt/edge_ai_apps# streamlit run scripts/perf_vis.py --theme.base="light" -- -D <path/to/logs/directory/>
A network URL can be seen in the terminal output. The graphs can be viewed by visiting this URL in any browser. The plotted graphs will keep updating based on the available log files.
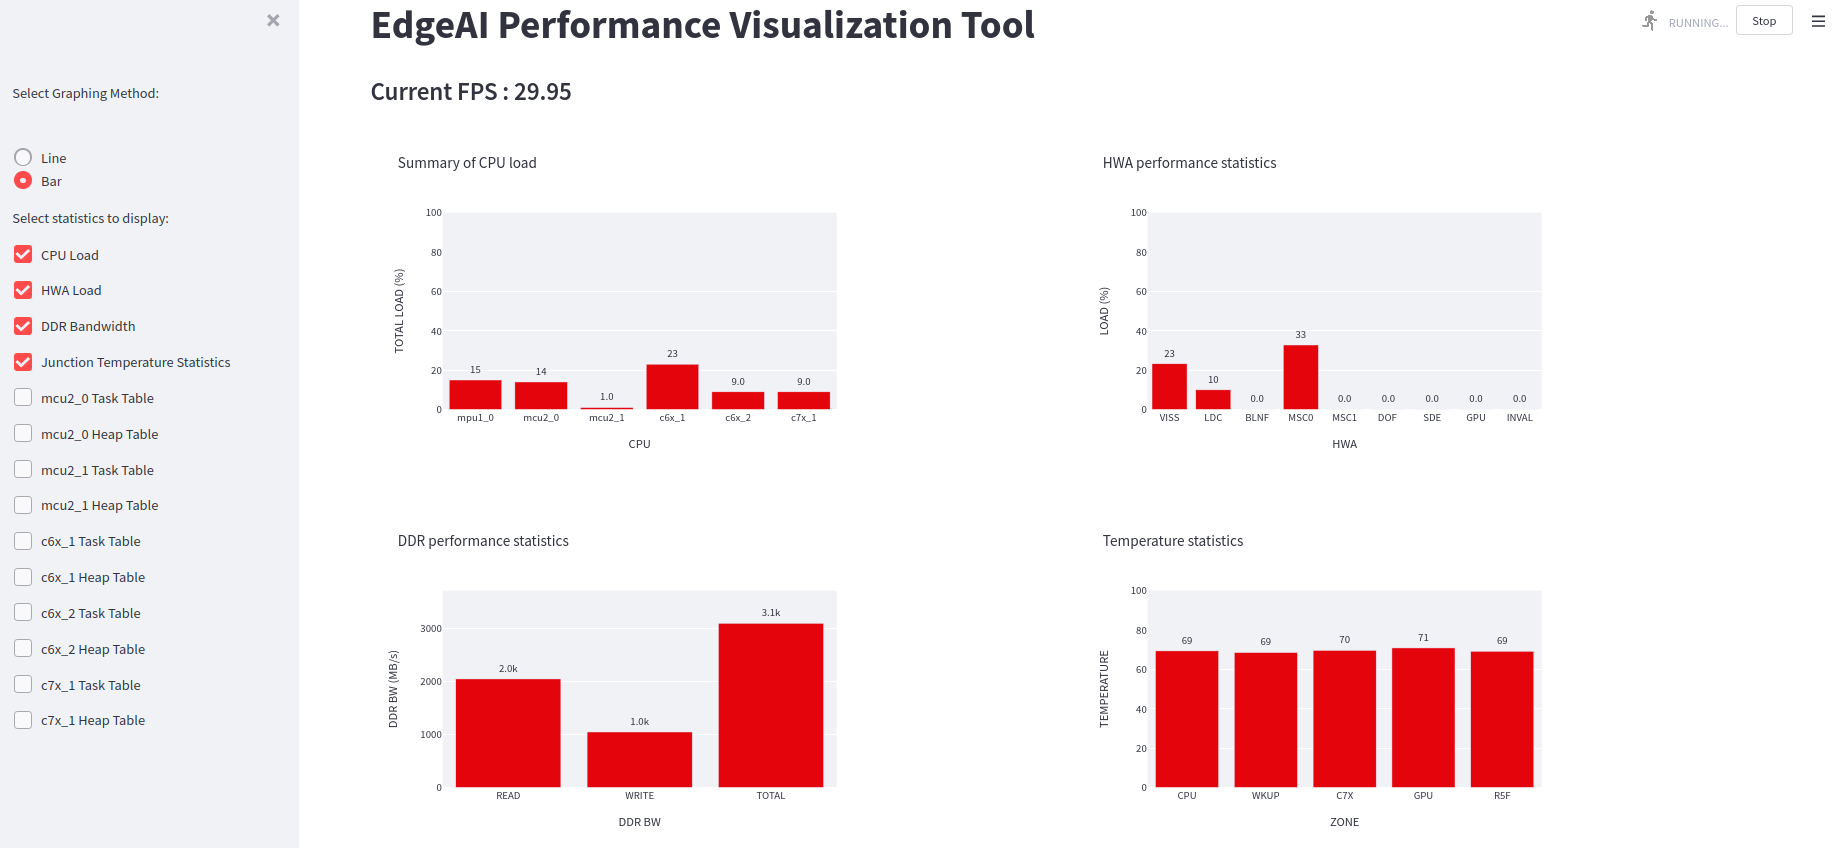
Fig. 25 Performance visualizer dashboard showing CPU and HWA loading, DDR bandwidth, Junction Temperatures and the FPS obtained
To exit press Ctrl+C in the terminal.
Available options
Average frames per second (FPS) recorded by the application is displayed by default. Using the checkboxes in the sidebar, one can select which performance metrics to view. There are 14 metrics available to be plotted, as seen from the above image:
CPU Load: Total loading for the A72(mpu1_0), R5F(mcu2_0/1), C66x(c6x_1/2) and C71x(c7x_1) DSPs.
HWA Load: Loading (percentage) for the various available hardware accelerators.
DDR Bandwidth: Average read, write and total bandwidth recorded in the previous 2s interval.
Junction Temperatures: The live temperatures recorded at various junctions
Task Table: A separate graph for each cpu showing the loading due to various tasks running on it.
Heap Table: A separate graph for each cpu showing the heap memory usage statistics.
For the first three metrics, there is a choice to view line graphs with a 30s history or bar graphs with only the real-time values. The remaining eleven have real-time bar graphs as the only option.
Simple Tools for Performence Numbers
Alternative to the perf vizualization tools we have simple tools to get the perf numbers like core loadings, DDR Bandwidths, junction temperatues, GStreamer element latencies etc.. on the bash terminal.
Perfstats tool
Perfstats tool is a simple cpp application which prints stats on the terminal
and updates it every second. To use this tool, it needs to be compiled and
run in a parallel ssh terminal along with the application. For detailed
instructions please refer to edge_ai_apps/scripts/perf_stats/README.md
below is the sample output of the tool
Summary of CPU load,
====================

CPU: mpu1_0: TOTAL LOAD =  12.21 % ( HWI =   0.24 %, SWI =   0. 0 % )
CPU: mcu2_0: TOTAL LOAD =   1. 0 % ( HWI =   0. 0 %, SWI =   0. 0 % )
CPU: mcu2_1: TOTAL LOAD =   1. 0 % ( HWI =   0. 0 %, SWI =   0. 0 % )
CPU:  c6x_1: TOTAL LOAD =  62.79 % ( HWI =   0.51 %, SWI =   0. 7 % )
CPU:  c6x_2: TOTAL LOAD =   0. 5 % ( HWI =   0. 2 %, SWI =   0. 1 % )
CPU:  c7x_1: TOTAL LOAD =   0. 8 % ( HWI =   0. 4 %, SWI =   0. 2 % )


HWA performance statistics,
===========================

HWA:   MSC0: LOAD =  13.33 % ( 79 MP/s )


DDR performance statistics,
===========================

DDR: READ  BW: AVG =    849 MB/s, PEAK =    849 MB/s
DDR: WRITE BW: AVG =    354 MB/s, PEAK =    354 MB/s
DDR: TOTAL BW: AVG =   1203 MB/s, PEAK =   1203 MB/s
Parse GST Tracers
GStreamer has a feature called tracers to get useful statistics like element wise
latency, cpu loading, etc. as a part of GST debug logs. These logs are very
verbose and very difficult to interpret in the raw format. We provide a simple
python script to parse these logs on the fly and display the stats on the
terminal. For detailed instructions to use the script please refer to
edge_ai_apps/scripts/gst_tracers/README.md
below is the sample output of the script
+-----------------------------------------------------------------------------------+
|element                       latency      out-latancy      out-fps     frames     |
+-----------------------------------------------------------------------------------+
|tiovxdlcolorconvert0          16.21        0.00             0           1          |
|capsfilter1                   0.12         0.00             0           1          |
|capsfilter0                   0.07         33.36            29          168        |
|jpegdec0                      7.10         33.16            30          168        |
|tiovxdlcolorconvert2          2.05         33.15            30          168        |
|capsfilter7                   0.19         33.15            30          168        |
|split_01                      3.88         16.57            60          336        |
|queue0                        0.19         33.14            30          168        |
|capsfilter3                   0.07         33.14            30          168        |
|queue1                        0.12         33.13            30          168        |
|capsfilter4                   0.06         33.13            30          168        |
|tiovxdlcolorconvert3          3.17         33.14            30          168        |
|capsfilter8                   0.11         33.14            30          168        |
|tiovxdlpreproc0               5.88         33.15            30          168        |
|capsfilter5                   0.10         33.15            30          168        |
|tiovxdlcolorconvert1          32.91        34.33            29          161        |
|capsfilter6                   0.08         34.33            29          161        |
|mosaic_0.sink_0               0.06         34.33            29          161        |
|mosaic_0                      33.94        34.02            29          160        |
|capsfilter2                   0.13         34.02            29          160        |
+-----------------------------------------------------------------------------------+