Calibration
General Calibration
This section details how to use the meter constant calibration and transducer length calibration features.
- Open GUI.
- Click Calibration–>General tab.
- In “Meter Constant Calibration” section of the panel, set your flow rate using a reference meter and input the expected volume flow rate in the field, then click start calibration.
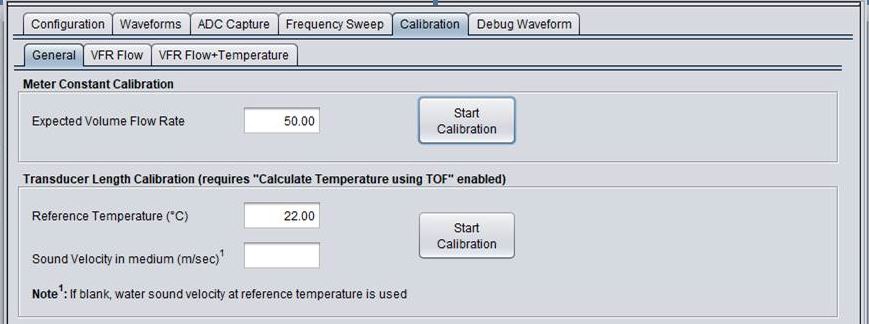
Fig. 21 Meter Constant Calibration
- After running the calibration for a period of time(about 1 minute), click stop calibration and input the reference meter actual averaged volume flow rate during the calibration period.

Fig. 22 Mean VFR Input
- After clicking OK, a pop up will show the calibrated meter constant. To overwrite the existing meter constant, click OK.
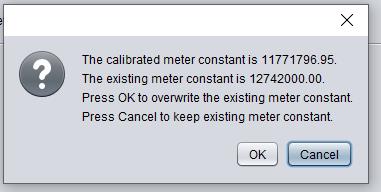
Fig. 23 Meter Constant Calibration Pop Up
- To apply the new meter constant to the connected board, click request update from the Configuration–>Parameters panel.
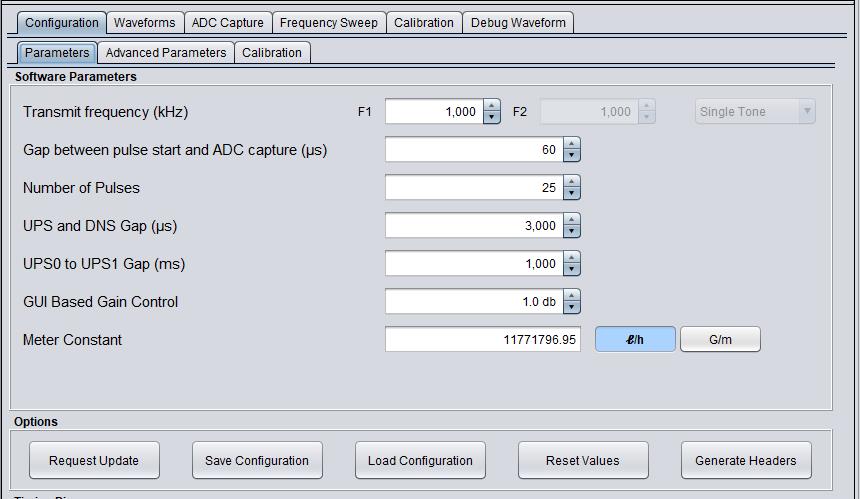
Fig. 24 Updated Meter Constant
- In “Transducer Length Calibration” section of the panel, input “Reference Temperature (°C)”, click “Start Calibration” button, let it run for a period(several seconds), and then click “Stop Calibration” button.
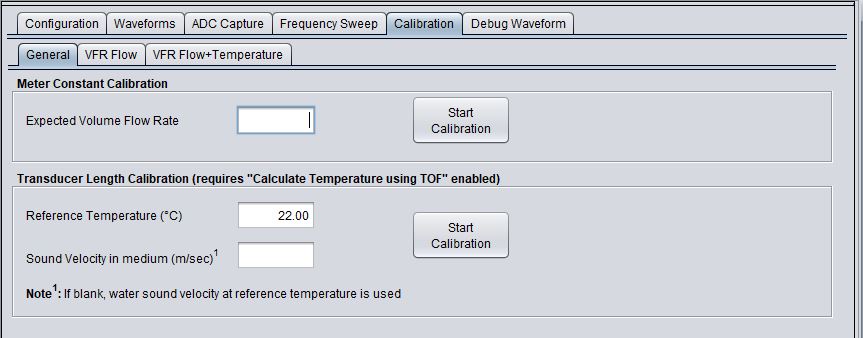
Fig. 25 Transducer Length Calibration
- A window will appear showing the calibrated transducer length and existing configuration. Click “OK” to overwrite the existing value or “Cancel” to ignore the suggested values.
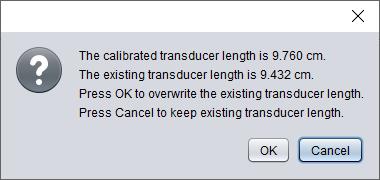
Fig. 26 Transducer Length Calibration Pop Up
- To update the transducer length constant in the application, the user must click “Generate Headers” from the Configuration–>Calibration panel and recompile the code. If the only parameter changed in the Configuration tab was “Transducer Length”, only update “USS_temperatureLUT.h” in the IDE project.
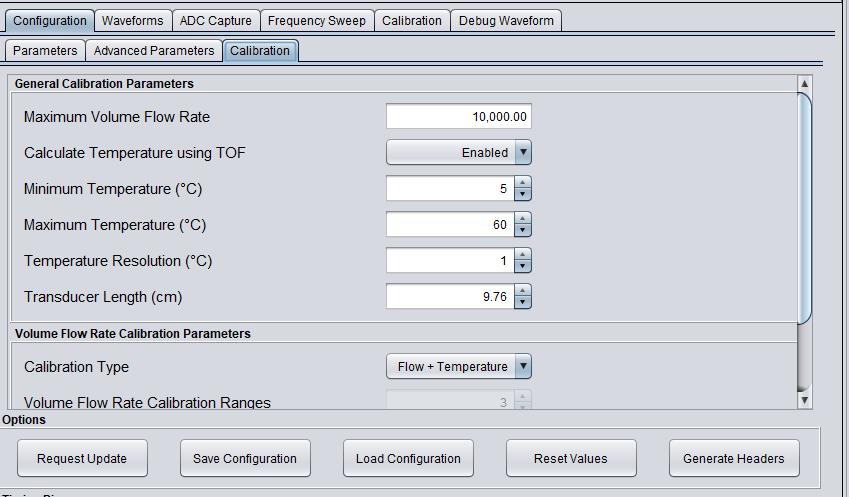
Fig. 27 Updated Transducer Length
Flow VFR Calibration
This section explains the typical flow VFR calibration process.The flow calibration panel enables the user to calibrate the meter (using linear fit calibration) for different number of ranges. For example if an application requires higher accuracy for lower and higher flows, then 2 ranges may be used. This section covers the basic settings for calibration, and how to calibrate the meter manually or at run-time. Once the calibration is completed the meter constants can be transmitted to the target or output to a header file.
Calibration Configuration
Number of Calibration Ranges
- The number of ranges used for calibration is configured in the Configuration->Calibration tab. Each time the number of ranges is updated, the project header files must be regenerated and the code must be recompiled for valid operation.
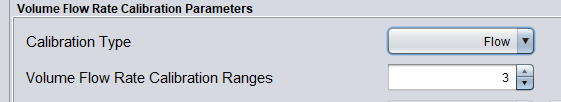
Fig. 28 Volume Flow Rate Calibration Ranges Configuration
- The Control Panel at the bottom of the calibration tab includes the following options:
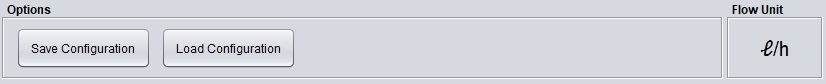
Fig. 29 Control Panel
Saving Configurations
Save the current calibration configuration (values of each range) or load saved configurations by using the “Save Configuration” or “Load Configuration” buttons. The location of the configuration file will default to a USS directory created in your home folder upon installation, at ~home/USS_VERSION/USSWorkspace/USS_Project. Saving the configuration will also save the automatic logging state and location. Additionally, the GUI will automatically save the configuration upon exit and reload the exit configuration when launched.
Flow Unit
The “Flow Unit” is derived from the Meter Constant units in the Configuration->Parameter tab.
- The “Meter Calibration Parameters” panel at the middle of the calibration tab includes the following options:
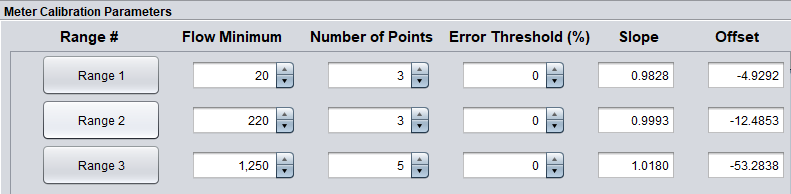
Fig. 30 Meter Calibration Parameters
Flow Minimum
Input the “Flow Minimum” for each range. During run-time calibration, changing this value does not require the code to be recompiled.
Number of Points
Input the “Number of Points” for each range. Each calibration point is made up of an expected VFR and a mean VFR. During run-time calibration, changing this value do not require the code to be recompiled.
Error Threshold (%) (Optional)
Input the “Error Threshold” for each range. This value is used once calibration for a range is completed. For each calibration point, the mean VFR is applied with the meter constants. The calibrated mean VFR is compared versus the expected VFR and compared to this threshold. If the new calibrated value is above this threshold, the cell will be red, otherwise it will be green. During run-time calibration, changing this value do not require the code to be recompiled.
Slope
The slope is the meter constant calculated after all the calibration points have been entered.
Offset
The offset is the meter constant calculated after all the calibration points have been entered.
Manual Calibration
This section describes how to manually calibrate the meter. This requires to have log of previously tested data sets, including expected VFR and mean VFR.
- For each “Range #” in the Meter Calibration Parameters panel, click on the Range button.
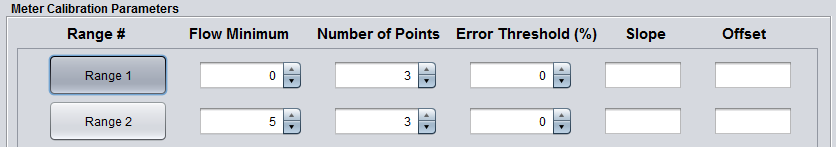
Fig. 31 Click on Range Button
- All of the Expected VFR and Mean VFR boxes will have a red edge around them.
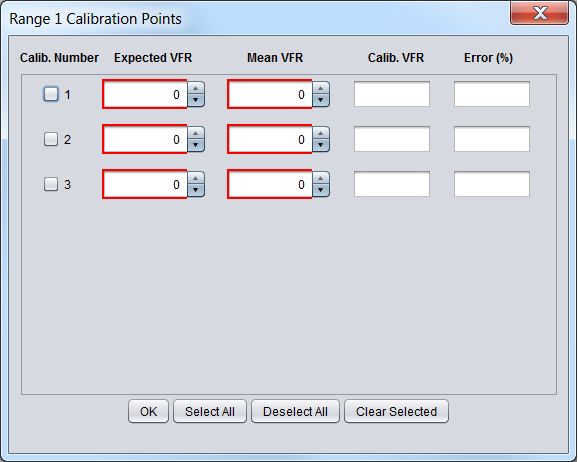
Fig. 32 Calibration Point Default
- Enter the Expected VFR and Mean VFR for each calibration point. As the values are updated the red edge will become green. Once all the calibration points are updated, the Calib. VFR and Error (%) columns will be populated.
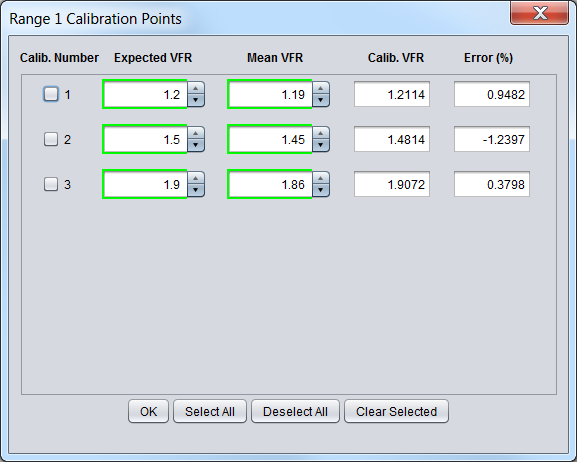
Fig. 33 Calibration Point Calibrated
- (Optional) Enter the Error Threshold for the calibrated Range. If the input “Error Threshold” is less than the absolute value of calculated Error (%) for each Calibration Point, the box will be red.
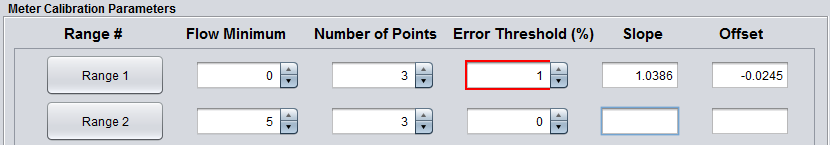
Fig. 34 Error Threshold Input
- To view which calibration point’s error was larger than the error threshold, click on the Range box.
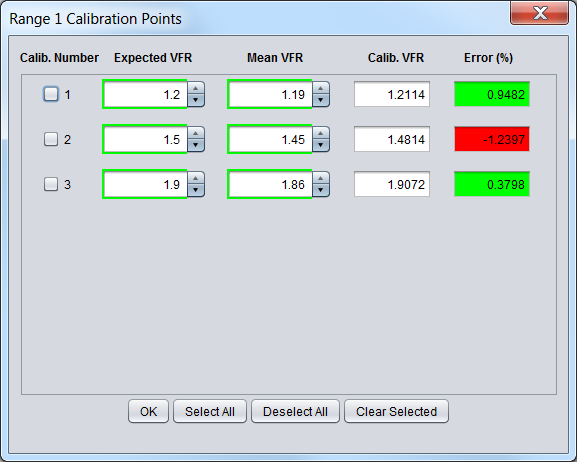
Fig. 35 Calibration Point Error
- The user can choose to re-calibrate the calibration point with larger error, or increase the Error Threshold for the corresponding range. If the Error Threshold is increased above the largest error then the Error Threshold’s red edge will become green.
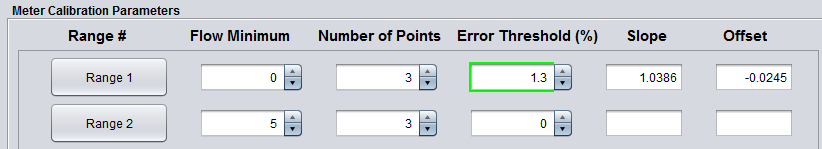
Fig. 36 Error Threshold Input Updated
- Repeat the previous steps for the remaining ranges. The slope and offset columns must have values populated when calibration is completed.
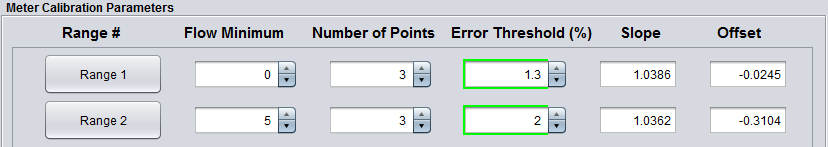
Fig. 37 Calibrated Ranges
- If the code running on the target was previously compiled using the # ranges used for manual calibration, then connect to the target and click the “Update Calibration” button, to store the meter constants. Otherwise, generate the header files and recompile the target code.
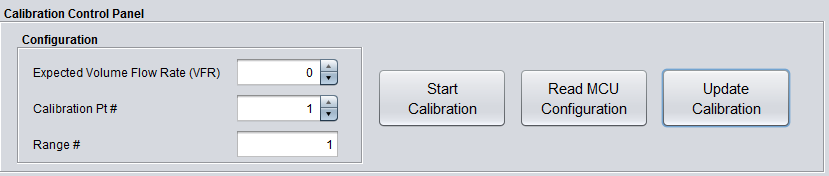
Fig. 38 Update Calibration
- A calibration update message should appear.
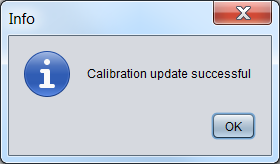
Fig. 39 Calibrated Ranges
- (optional) If Design Center is connected to a target board, click on “Read MCU Configuration” to view the meter constants stored in the target. This will send a request to the target to send the meter constants it has for each range. It will not overwrite the meter constants in the Meter Calibration Parameter panel.
Run-Time Calibration
This section describes how to calibrate the meter at run-time, instead of loading previously tested data sets.
- Enter the “Expected Volume Flow Rate (VFR)” and “Calibration Pt# ” in the Configuration panel. The Range text box will be updated automatically based on the “Expected Volume Flow Rate (VFR)” and will display the corresponding Range #.
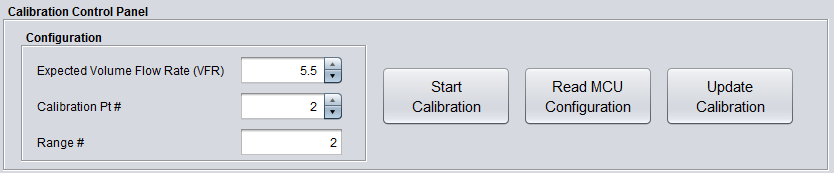
Fig. 40 Expected Volume Flow Rate Input
- Click the “Start Calibration” button on the Calibration Control Panel at the bottom of the Calibration Tab. The Start button notifies the target via HID command to initiate data transfer.
- Wait for a desired amount of time while captures are being averaged.
- Click the “Stop Calibration” button on the Calibration Control Panel at the bottom of the Calibration Tab. The Stop button notifies the target via HID command to stop data transfer.
- When the stop button is pressed a pop dialog will appear asking for the averaged mean VFR, enter the golden meter averaged VFR and the Calibration Pt in the corresponding Range # will be updated with the expected and averaged mean VFR.
- This process must be repeated for all the Calibration Points in each Range. The slope and offset columns in the “Meter Calibration Parameters” will have the calibration constants when the calibration is completed.
- If the code running on the target was previously compiled using the # ranges used for run-time calibration. Then click the “Update Calibration” button, to store the meter constants. Otherwise, generate the header files and recompile the target code.
- (optional) Click on “Read MCU Configuration” to view the meter constants stored in the target. This will send a request to the target to send the meter constants it has for each range. It will not overwrite the meter constants in the Meter Calibration Parameter panel.
Flow + Temperature VFR Calibration
This section explains the typical flow + temperature VFR calibration process. USS Water demo application version 2.30.00.xx or later must be used for full temperature+flow calibration functionality. This section also assumes the calibration of the meter constant and transducer length has been calibrated based on the “General” guidelines. The number of calibration points required will depend on the users accuracy requirements and pipe design.
Collecting Meter Calibration Data
This section details how the user can enter the measurement data corresponding to the customer specific pipe, generate the meter constant calibration table and use it in the CCS water meter example project.
- Click “Calibration” tab under “Configuration”.
- Input Number of reference flows in “Number of Flows” box and specify the individual values in the window that pops-up when you click the “Values” button.
- Input Number of reference temperatures in “Number of Temperatures” box and specify the individual values in the window that pops-up when you click the “Values” button.
- Input the minimum operating temperature, in “Minimum Temperature (°C)” box, maximum operating temperature in “Maximum Temperature (°C)” box and temperature resolution in “Temperature Resolution (°C)” box respectively. The actual values are dependent on the use case but the minimum temperature specified should be ≥ 1°C and the maximum temperature specified should be ≤ 65°C. The temperature resolution can be as low as 0.1°C. Please note that the memory usage for an internal table in the SW is dependent on this resolution.
- Select “Enabled” in the “Calculate Temperature using TOF” field.
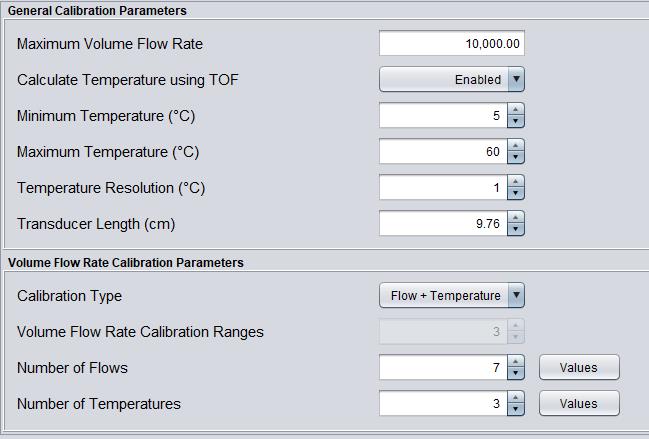
Fig. 41 Flow+Temperature VFR Calibration Configuration
- Click the main “Calibration” tab
- Click “Add” in the Flow/Temperature Measurements table.
- “Meter ID” is optional and only used to identify what spool was used for testing.
- “Flow ID” will provide a drop down based on the values provided in step 3. These are target flows used to group the measurement points.
- “Temp ID” will provide a drop down based on the values provided in step 3. These are target temperatures used to group the measurement points.
- “Ref flow” should be input by the user. This is the observed value on the reference meter.
- “Ref Temp” should be input by the user. This is the observed reference temperature.
- “Meas Flow” should be input by the user. This is the uncalibrated observed flow that the EVM provides.
- Fill this table until all values are complete. As the measurements are input, the Quadrilateral points and meter constants tables will be populated. WARNING: You must have at least 1 measurement for each flow/temperature combination defined in step 3.
- (Optional) “Save Configuration” (in Figure 2) can be used to save all these values in .xml format. If GUI is closed and reopened, the last set of measurements will be automatically loaded to the GUI.
- (Optional) “Load configuration” can be used to load previously saved .xml files.
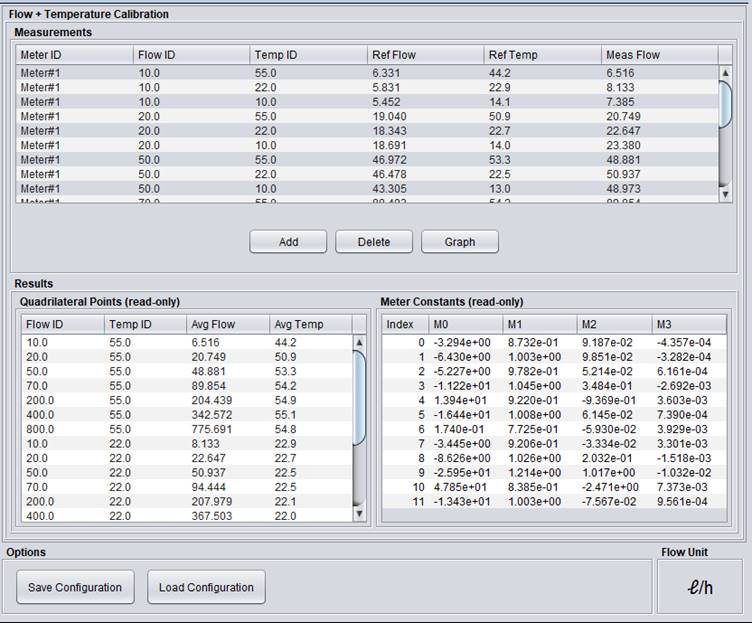
Fig. 42 Flow+Temperature VFR Calibration Panel
- Go to “Configuration–>Calibration” tab in the main GUI window. Click “Generate Headers” and select a directory to store the .h files.
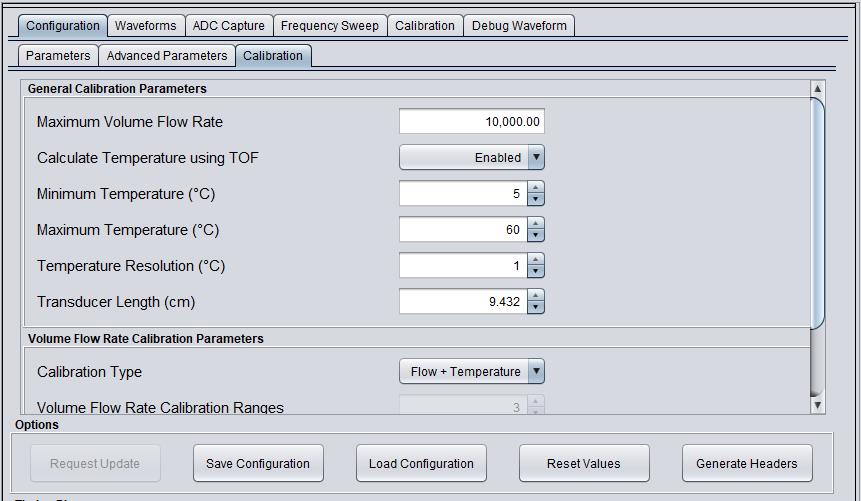
Fig. 43 Generate Headers
- Open CCS project and replace the contents of the directory with the 2 generated files as shown below.
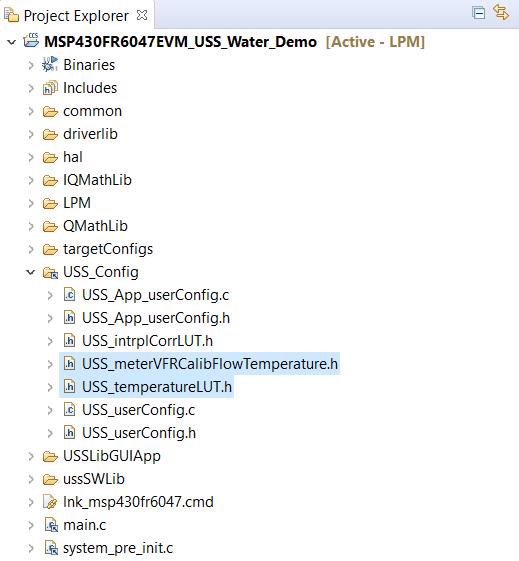
Fig. 44 CCS Project with updated files
- Rebuild project and load back to EVM.
- Once new project has been loaded to EVM, reconnect to the GUI.
Using GUI with Calibration
This section will detail how to use the GUI after calibration is complete and the project has been rebuilt with the calibrated header files.
- Open GUI.
- Click Calibration–>VFR Flow + Temperature tab.
Measurements
Measurements table shows the actual measured flow and measured temperature. “Meter ID” can be used to identify different spools (meter unit number) if required. “Flow ID” and “Temp ID” correspond to the values shown in the previous configuration tab. Values can be changed/added or deleted from the table.
Quadrilateral Points
Quadrilateral Points shows the average measured flow under the column “Avg Flow” and average measured temperature under the column “Avg Temp” for each point. This table sorts from highest to lowest temperature. Within each temperature setting, it is sorted from the lowest to highest flow ID. This table defines the total number of points (number of flows x number of temperatures). This table is read only. WARNING: This table should not include any zero values for flow and temperature.
Meter Constants
Meter Constants table shows the resulting meter constants. “Index” refers to the quadrant of each meter constant set. These are the meter constants used within a given quadrilateral. Table is read only.
- The “load configuration” button can be used to import saved calibration configurations.
- The “Graph” button brings up a new window which shows the uncalibrated flow + temperature quadrilaterals. When running measurements, a blue dot in the graph will show the existing measurement location in the quadrilaterals.
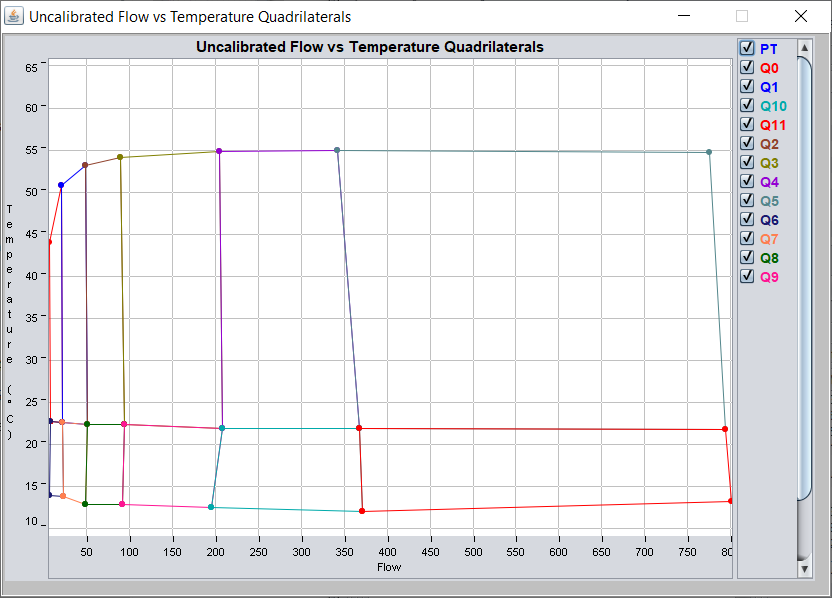
Fig. 45 Flow+Temperature VFR Quadrilaterals
- Click “Waveforms” tab. Click “start” to begin taking measurements with the existing configuration. “Delta TOF” and “Absolute TOF” will be displayed as usual. “Volume Flow Rate” (VFR) graph will show the flow rate with correction based on meter constants shown in previous steps. Statistics can be seen below the graph.
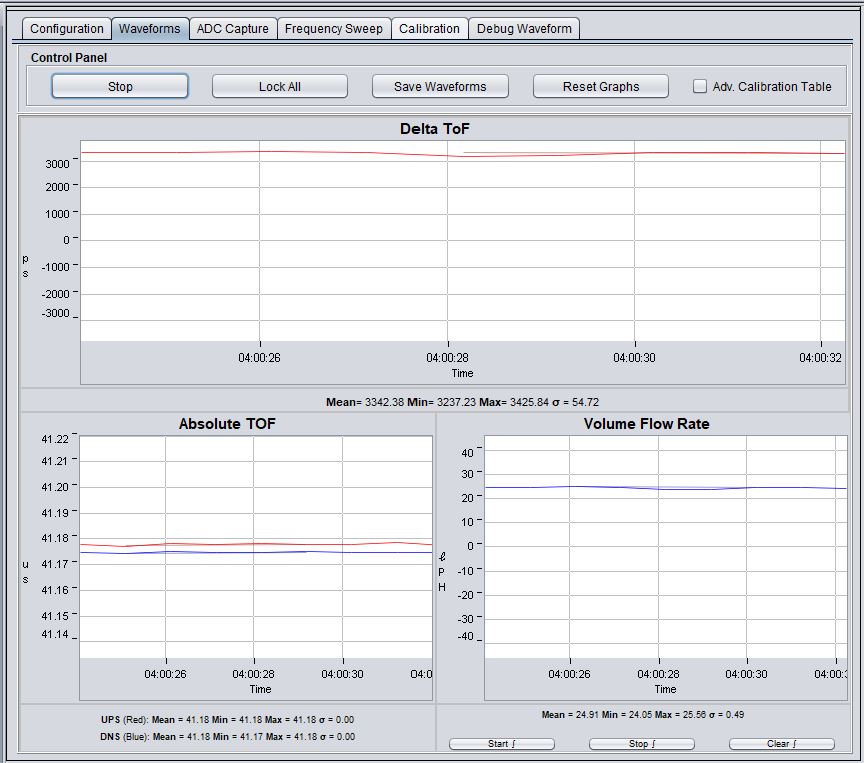
Fig. 46 Waveforms Panel
- Click “Debug Waveform” tab. This has 4 separate plots. The description of each of the plots below corresponds to the default outputs of the project.
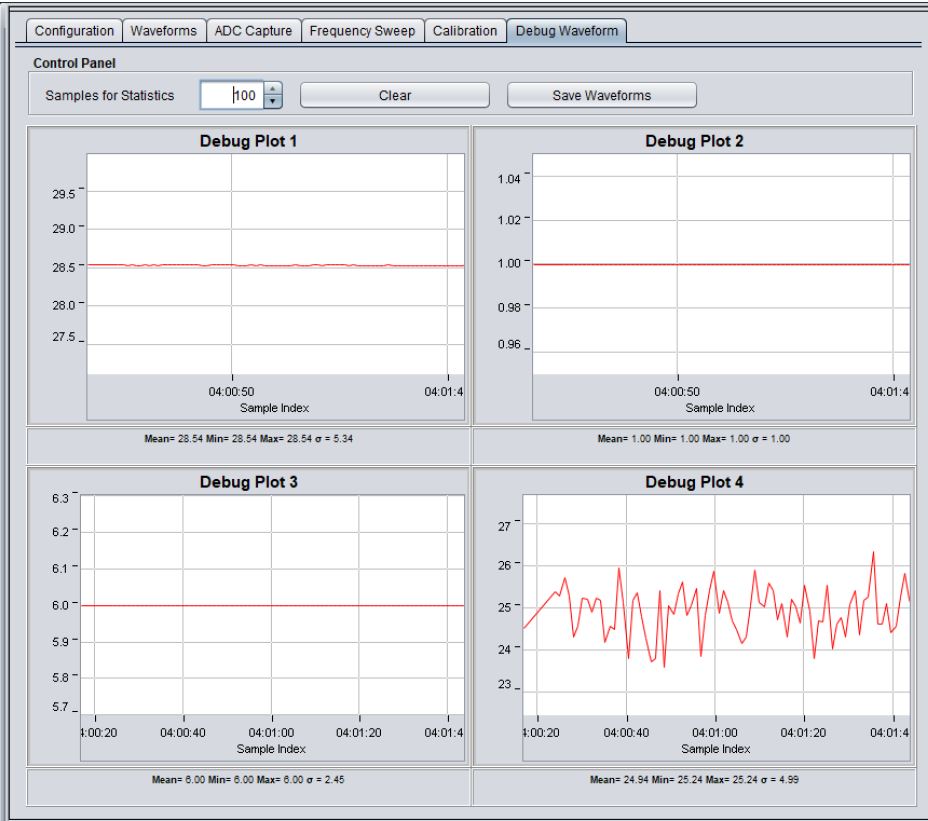
Fig. 47 Debug Panel
Debug plot 1
Estimated temperature based on the absolute TOF (ABSTOF) calculation if “Calculate temperature using TOF” is enabled.
Debug plot 2
Number of search iterations required to determine the quadrilateral that corresponds to the temperature and flow rate under measurement. This value ranges from 1 – 8. 1 is typical when the quadrilateral is found on the first iteration. 8 can indicate that maximum iterations were required or that the measurements are outside of the quadrilaterals.
Debug plot 3
Quadrilateral number used for correction.
Debug plot 4
Uncorrected volume flow rate (VFR) prior to the calibration correction being applied. This can be used to analyze the improvement provided by the calibrated VFR in the “Volume Flow Rate” graph in the “Waveforms” tab.
More Information
- For more information on the application, and available evaluation kits, see the download page.
- For technical support, email the USS GUI support team or visit the MSP430 E2E forum