TI-RTOS Object Viewer
Both IAR and CCS include the RTOS Object Viewer (ROV) plug-in that provides insight into the current state of TI-RTOS, including task states, stacks, and so forth. Because both CCS and IAR have a similar interface, these examples discuss only CCS.
To access the ROV in IAR:
- Use the TI-RTOS menu on the menu bar.
- Select a subview.
To access the ROV in CCS:
- Click the Tools menu.
- Click RTOS Object View (ROV).
This section discusses some ROV views useful for debugging and profiling. More details can be found in the TI-RTOS User’s Guide, including documentation on how to add log events to application code.
Warning
When using autosized heap, the ROV may display errors when accessing modules such as Task and Heap for ROV Classic. In order to use ROV with an autosized heap, the following steps may be taken:
- – CCS:
- Use ROV2, or apply the workaround below when using ROV classic
- – IAR:
Apply the following patch to the
function init()in\kernel\tirtos\packages\ti\sysbios\heaps\package.xs. The lines highlited below should be added.
Scanning the BIOS for Errors
The BIOS Scan for errors view goes through the
available ROV modules and reports on errors. This functionality can
be a good point to start if anything has gone wrong. This
scan only shows errors related to TI-RTOS modules and only the
errors it can catch.
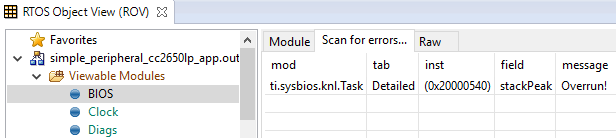
Figure 115. Scan for errors. Here a Task Stack has been overrun.
Viewing the State of Each Task
The Task Detailed view is useful for seeing the state of
each task and its related runtime stack usage. This example shows
the state the first time the user-thread is called. Figure 116.
shows the Bluetooth low energy stack task, represented by its ICall proxy,
the Idle task, the simple_peripheral task and the GAPRole task.
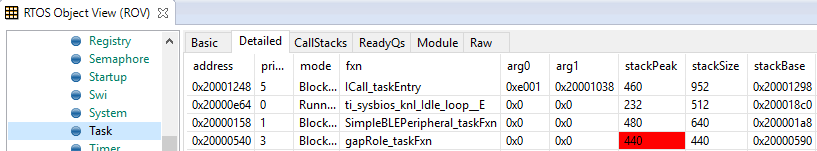
Figure 116. Detailed view of the Tasks. Notice the address of the overrun task matches the instance id from Scan for errors.
The following list explains the column in Figure 116.
- address
- This column shows the memory location of the Task_Struct instance for each task.
- priority
- This column shows the TI-RTOS priority for the task.
- mode
- This column shows the current state of the task.
- fxn
- This column shows the name of the entry function of the task.
- arg0, arg1
- These columns show arbitrary values that can be given to entry function of the task. In the image, the ICall_taskEntry is given 0xb001, which is the flash location of the entry function of the RF stack image and 0x20003a30 (the location of bleUserCfg_t user0Cfg, defined in main()).
- stackPeak
- This column shows the maximum run-time stack memory used based on watermark in RAM, where the stacks are prefilled with 0xBE and there is a sentinel word at the end of the run-time stack.
Note
Function calls may push the stack pointer out of the run-time stack, but not actually write to the entire area. A stack peak near stackSize but not exceeding it may indicate stack overflow.
- stackSize
- This column shows the size of the runtime stack, configured when instantiating a task.
- stackBase
- This column shows the logical top of the runtime stack of the task (usage starts at stackBase + stackSize and grows down to this address).
Viewing the System Stack
The Hwi Module view allows profiling of the system stack
used during boot or for main(), Hwi execution, and Swi execution.
See System Stack for more information on the system
stack.
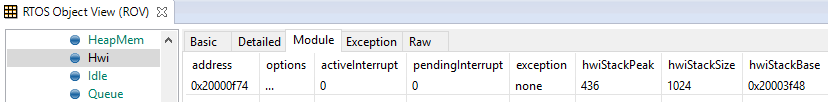
Figure 117. Viewing the System Stack in Hwi
The hwiStackPeak, hwiStackSize, and hwiStackBase can be used to check for system stack overflow.