7. Measuring performance
There are simple tools to get the performance numbers like core loadings, DDR bandwidths, HWA loadings, GStreamer element latencies etc.. on the bash terminal.
7.1. GStreamer plugin for Performance measurement
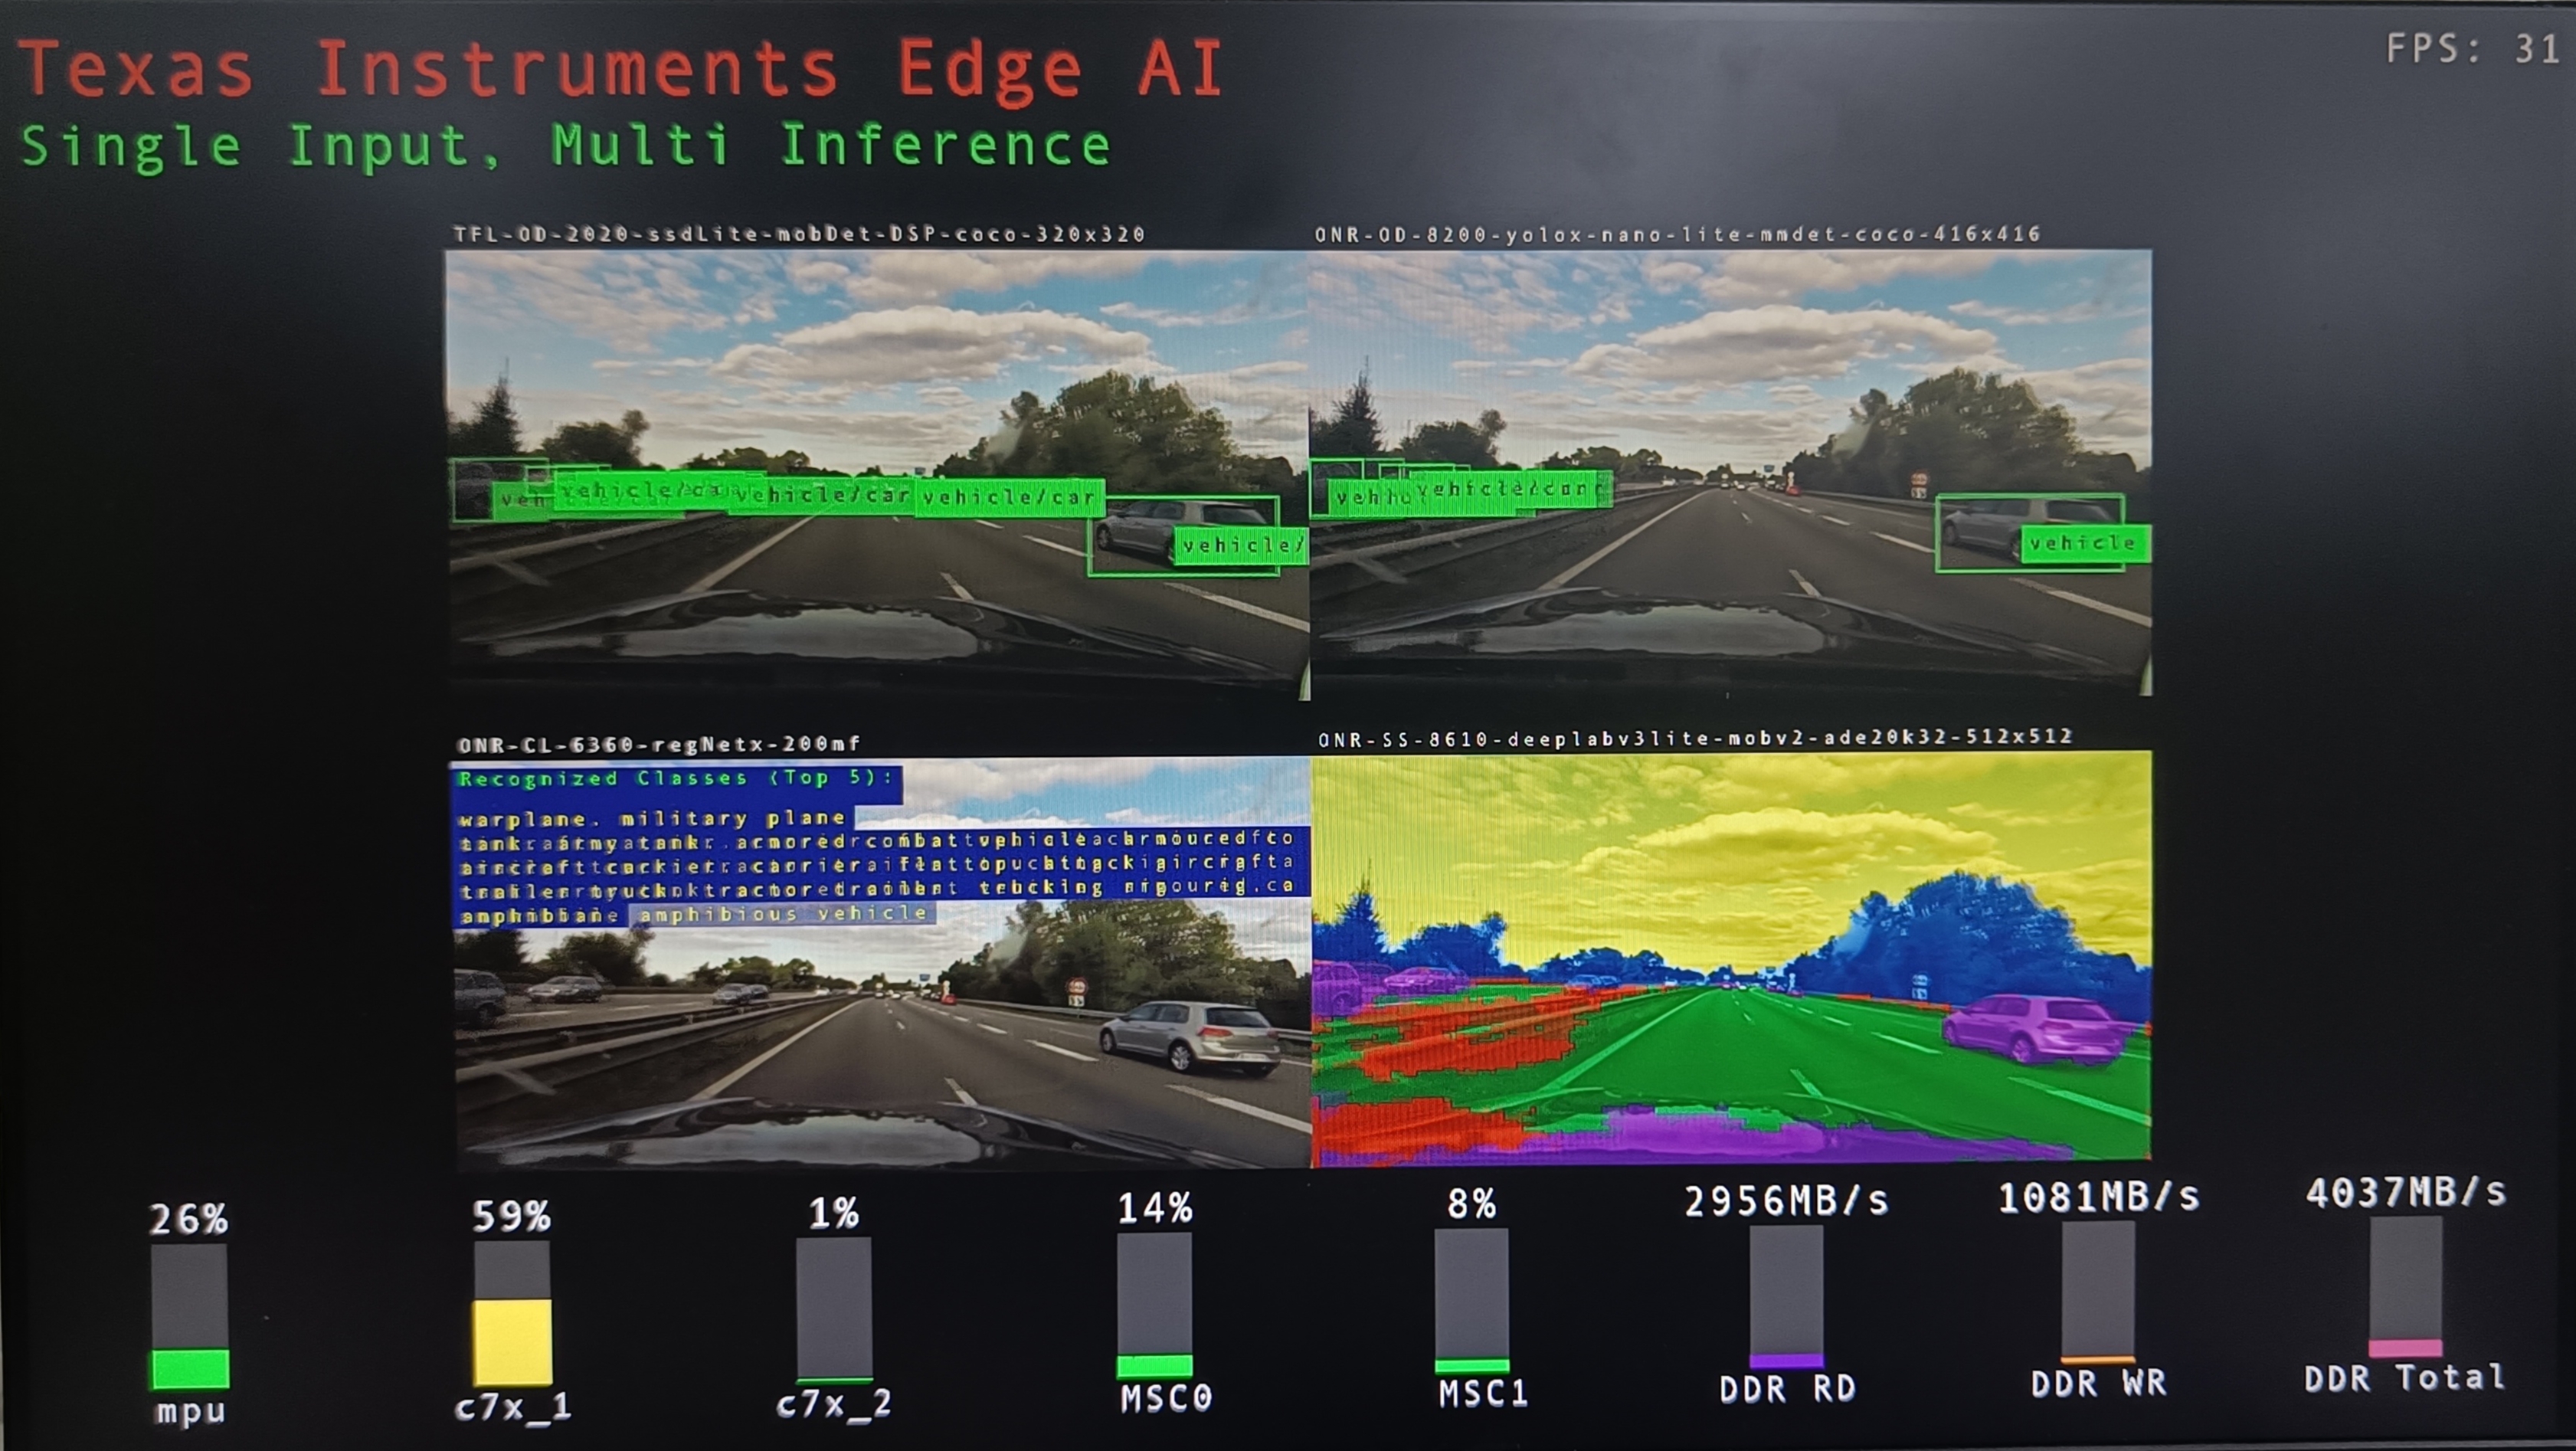
This custom GStreamer plugin allows users to include these non-intrusive elements in the pipeline which overlays the performance information directly on the output image displayed on the screen. The entire processing, is done on native NV12 format which makes it convenient to use along with opTIFlow pipelines. For detailed instructions to use the plugin please refer to tiperfoverlay
A preview of performance overlay on the display is as shown,
7.2. Perf-stats tool
Perf-stats tool is a simple cpp application which prints stats on the terminal and updates it every second. To use this tool, it needs to be compiled and run in a parallel ssh terminal along with the application. For detailed instructions please refer to perf-stats readme
below is the sample output of the tool
Summary of CPU load,
====================
CPU: mpu1_0: TOTAL LOAD = 43.81 % ( HWI =  0.74 %, SWI =  0.24 % )
CPU: c7x_1: TOTAL LOAD = 12. 0 % ( HWI =  0. 0 %, SWI =  0. 0 % )

HWA performance statistics,
===========================
HWA:  MSC0: LOAD =  6.93 % ( 45 MP/s )
HWA:  MSC1: LOAD =  6.93 % ( 60 MP/s )

DDR performance statistics,
===========================

DDR: READ BW: AVG =  1455 MB/s, PEAK =  6140 MB/s
DDR: WRITE BW: AVG =   332 MB/s, PEAK =  2138 MB/s
DDR: TOTAL BW: AVG =  1787 MB/s, PEAK =  8278 MB/s
7.3. Parse GST Tracers
GStreamer has a feature called tracers to get useful statistics like element wise latency, cpu loading, etc. as a part of GST debug logs. These logs are very verbose and very difficult to interpret in the raw format. We provide a simple python script to parse these logs on the fly and display the stats on the terminal. For detailed instructions to use the script please refer to gst-tracers readme
below is the sample output of the script
+------------------------------------------------------------------------------+
|element                      latency     out-latancy     out-fps    frames    |
+------------------------------------------------------------------------------+
|h264parse0                   1.72        6580.05         0          3         |
|v4l2h264dec0                 329.79      33.29           30         886       |
|tiovxmemalloc0               0.11        33.29           30         886       |
|capsfilter0                  0.08        33.29           30         886       |
|split_01                     20.37       16.65           60         1770      |
|queue0                       0.31        33.30           30         885       |
|capsfilter1                  0.16        33.30           30         885       |
|queue1                       0.22        33.30           30         885       |
|capsfilter3                  0.07        33.30           30         885       |
|tiovxdlpreproc0              1.63        33.30           30         885       |
|capsfilter2                  0.43        33.30           30         885       |
|tidlinferer0                 7.28        33.30           30         885       |
|post_0                       2.57        33.30           30         885       |
|queue2                       0.18        33.30           30         885       |
|mosaic_0                     51.00       33.30           30         883       |
|capsfilter4                  0.14        33.30           30         883       |
|queue3                       30.80       33.34           30         882       |
|tiperfoverlay0               3.40        33.34           30         882       |
+------------------------------------------------------------------------------+