12.1. Source-Based Code Coverage in tiarmclang
The TI Arm Clang Compiler Tools (tiarmclang) support Source-Based Code Coverage that is particularly suited for embedded applications. In addition to being generally useful for thorough application development, code coverage is required by internal and external developers in the Industrial and Automotive markets for Functional Safety.
The following forms of Code Coverage are supported:
Function coverage is the percentage of functions which have been executed at least once. A function is considered to be executed if any of its instantiations are executed.
Instantiation coverage is the percentage of function instantiations which have been executed at least once. Template functions and static inline functions from headers are two kinds of functions which may have multiple instantiations.
Line coverage is the percentage of code lines which have been executed at least once. Only executable lines within function bodies are considered to be code lines.
Region coverage is the percentage of code regions which have been executed at least once. A code region may span multiple lines (e.g in a large function body with no control flow). However, it is also possible for a single line to contain multiple code regions (e.g in “return x || y && z”). Region coverage is equivalent to Statement coverage provided by other vendors.
Call Region coverage is the percentage of code regions containing function calls which have been executed at least once. A code region may contain multiple function calls when there is no control flow. This metric is a subset of Region coverage. Call Region coverage is equivalent to Call coverage provided by other vendors.
Branch coverage is the percentage of source-condition-based branches that have been taken at least once. The new tiarmclang tools’ support for Branch coverage (also known as Branch Condition coverage) provides a finer level of coverage than that which is provided by other vendors, allowing users to track “True/False” execution coverage across leaf-level Boolean expressions used in conditional statements. This makes it much more informative and useful than Decision coverage that some other vendors support, which only tracks execution counts for a single control flow decision point, which may be a Boolean expression comprised of conditions and zero or more Boolean logical operators.
Modified Condition/Decision Coverage (MC/DC) is the percentage of all single condition outcomes that independently affect a decision outcome that have been exercised in the control flow. MC/DC builds on top of branch coverage, and as such, it too requires that all code blocks and all execution paths have been tested. MC/DC pertains to complex Boolean expressions involving more than one single condition where each condition has been shown to affect that decision outcome independently.
Note
Coverage across Function Instantiations
If a function has multiple instantiations, as in the case of C++ function templates, the instantiation reflecting the maximum coverage of lines, regions, or branches is used for the final coverage tally. In other words, a function definition is considered fully covered if any one of its instantiations is fully covered with respect to lines, regions, or branches.
12.1.1. Support for Embedded Use Cases
The tiarmclang compiler tools minimize the data size requirements of Code Coverage by allocating memory space for only the counters and keeping all other coverage related information in non-allocatable sections preserved in the object file itself. This ensures that target memory is only utilized for incrementing counters. In addition, the runtime support only supports writing counters to a file as part of a “bare-metal” profiling model and nothing else. Support for writing a full raw profile file, merging counters, etc., is not included as part of tiarmclang.
Note that instrumentation that is inserted to track the counters will introduce cycle performance and codesize overhead, depending on the size of the program. This is due to the additional instructions needed, number of counters needed, and impact to existing code optimization. Reducing the size of counters will be addressed as a future enhancement for the compiler to decrease the memory footprint introduced by code coverage to better mitigate the codesize overhead.
12.1.2. Effects of Code Optimization
The tiarmclang compiler derives instruction-to-source mappings through the Abstract Syntax Trees during the compilation’s Code Generation (CodeGen) phase that are eventually lowered to an intermediate representation, which is where counter instrumentation occurs. Counter instrumentation is completed prior to optimization passes that operate on the intermediate representation, so this means that coverage data is very accurate with respect to the source code. Counter increments that would have occurred in an unoptimized program occur in the optimized variant. For example, counter mapping regions for an inlined function are created with instrumentation prior to inlining. If inlining is performed, the instrumentation is inlined along with it. The resulting execution counts map back to the original source as though the function had never been inlined.
While counter instrumentation is not obstructed by optimization, the presence of counter instrumentation may inhibit certain optimizations
12.1.3. Tool Usage
In addition to the tiarmclang compiler, which is used to produce counter instrumentation, the tools used to produce and visualize code coverage data are tiarmprofdata and tiarmcov.
12.1.3.1. Useful Coverage Profile Merging Options (tiarmprofdata)
USAGE: tiarmprofdata merge [options] <filename ...>
Format of output profile
--binary - binary encoding (default)
--text - output in text mode
Profile kind
--instr - instrumentation profile (default)
--obj-file=<string> - object file
--output=<file> - output file
--remapping-file=<file> - symbol remapping file
--sparse - generate a sparse profile (only meaningful for --instr)
12.1.3.2. Useful Coverage Visualization Options (tiarmcov)
USAGE: tiarmcov {subcommand} [OPTION]... --sources [SOURCES]...
Subcommands
export - Export instrprof file to structured format either as text (JSON) or as LCOV.
JSON: tiarmcov export --format=text
LCOV: tiarmcov export --format=lcov
CSV: tiarmcov export --format=csv
report - Summarize instrprof style coverage information.
show - Annotate source files using instrprof style coverage.
Function Filtering Options
--filename-allowlist=<file> - Show code coverage only for files that match a regular expression listed in the given file.
--ignore-filename-regex=<string> - Skip source code files with file paths that match the given regular expression.
--line-coverage-gt=<number> - Show code coverage only for functions with line coverage greater than the given threshold.
--line-coverage-lt=<number> - Show code coverage only for functions with line coverage less than the given threshold.
--name=<string> - Show code coverage only for functions with the given name.
--name-regex=<string> - Show code coverage only for functions that match the given regular expression.
--name-allowlist=<file> - Show code coverage only for functions listed in the given file.
--region-coverage-gt=<number> - Show code coverage only for functions with region coverage greater than the given threshold.
--region-coverage-lt=<number> - Show code coverage only for functions with region coverage less than the given threshold.
--sources [SOURCES] Show code coverage only for specified source files.
General Options
--instr-profile=<string> - File with the profile data obtained after an instrumented run.
--num-threads=<uint> - Number of merge threads to use (default: autodetect).
--object=<string> - Coverage executable or object file.
--output-dir=<string> - Directory in which coverage information is written out.
--path-equivalence=<string> - <from>,<to> Map coverage data paths to local source file paths.
--project-title=<string> - Set project title for the coverage report.
--show-mcdc-summary - Show MC/DC condition statistics in summary table. Data will only appear if code was compiled with the -fmcdc option.
--show-branch-summary - Show branch condition statistics in summary table.
--show-instantiation-summary - Show instantiation statistics in summary table.
--show-region-summary - Show region statistics in summary table.
--show-call-region-summary - Show call region statistics in summary table.
--summary-only - Export only summary information for each source file.
Source-Based Viewing Options (for “tiarmcov show”)
--show-mcdc - Show coverage for MC/DC conditions in each Boolean expression. Data will only appear if code was compiled with the -fmcdc option.
--show-branches=<value> - Show coverage for branch conditions.
=count - show True/False counts
=percent - show True/False percent
--show-expansions - Show expanded source regions.
--show-instantiations - Show function instantiations.
--show-branches=<value> - Show coverage for branch conditions.
--show-line-counts-or-regions - Show the execution counts for each line, or the execution counts for each region on lines that have multiple regions.
--show-regions - Show the execution counts for each region.
--show-functions - Show coverage summaries for each function.
12.1.4. Generating Instrumented Binaries
Source code must be built using tiarmclang with -fprofile-instr-generate -fcoverage-mapping options. The -fmcdc option may be used if measuring MC/DC is desired (if MC/DC-level coverage is not desired, please do not use -fmcdc in order to minimize the level of instrumentation required). For example:
tiarmclang -fprofile-instr-generate -fcoverage-mapping {-fmcdc} foo.cc -o foo
Note
Instrumented binaries comprised of object files instrumented using version 1.3.x.LTS of the compiler tools aren’t supported
Due to format changes added after version 1.3.x.LTS of the compiler tools, instrumented binaries that include object files instrumented with version 1.3.x.LTS of the compiler should not be linked with binaries built using version 2.1.x.LTS (or later) of the compiler tools.
The following options are available to help reduce the size of the instrumentation code and data footprint that is added to an application build to enable computation and visualization of code coverage information.
Reduce Size of Profile Counter
-fprofile-counter-size=[64|32]
The default size for the compiler generated profile counters that annotate an application when code coverage is enabled is 64-bits. using the option with -fprofile-counter-size=32 instructs the compiler to use 32-bit integer values to record the execution count associated with a basic block (a sequence of executable code that can potentially be the destination of a call or branch) where applicable.
Limit Generation of Code Coverage Information to Functions
-ffunction-coverage-only
Normally when compiler generated code coverage is enabled in tiarmclang, the compiler will annotate an application with execution counters for basic blocks. This option can be used to reduce the code coverage instrumentation footprint by limiting compiler generated code coverage information to function entry execution counts.
Use Profile Function Groups to Limit Coverage Overhead
-fprofile-function-groups=N
-fprofile-selected-function-group=i
Reduce instrumented size overhead by spreading the overhead across ‘N’ total executable builds, where ‘i’ refers to an individual executable build between ‘0’ and ‘N-1’. Raw profiles from different groups can be merged as described below: Merging Multiple Indexed Profile Data Files from Multiple Executables.
12.1.5. Retrieving the Counters From Memory
Once the executable has been loaded and executed one or more times, the counters should be retrieved from memory and written to a raw profile data file on the host. Counters are stored in an allocated memory section named __llvm_prf_cnts, and this section is demarcated with the start and stop symbols, __start___llvm_prf_cnts and __stop___llvm_prf_cnts, which can allow the target memory to be read from the host.
The data retrieved in memory should be saved to a file, and this file is the raw profile counter file.
If MC/DC-level coverage is enabled using -fmcdc at compile-time, additional coverage data is stored in an allocated memory section named __llvm_prf_bits, and this section is demarcated with the start and stop symbols, __start___llvm_prf_bits and __stop___llvm_prf_bits. This data must be saved in the same raw profile counter file immediately following the counter data. This data must be read as bytes!
Note
It is critically important that these sections used to track coverage counters (__llvm_prf_cnts and __llvm_prf_bits) be placed in memory that is writable during runtime (“RAM” instead of “FLASH”). By default, the linker will attempt to place the sections next to the .bss section, but users may also manually place the sections using a linker command file.
12.1.5.1. Retrieving Counters Using the CCS Scripting Console
Retrieving counters from memory can be done in Code Composer Studio (CCS) using the following example script, which can be pasted into the CCS scripting console:
 1var scriptEnv = Packages.com.ti.ccstudio.scripting.environment.ScriptingEnvironment.instance();
 2var server = scriptEnv.getServer("DebugServer.1");
 3var session = server.openSession("Texas Instruments XDS110 USB DebugProbe_0/CORTEX_M4_0");
 4
 5var cntStart = session.symbol.getAddress("__start___llvm_prf_cnts");
 6var cntStop = session.symbol.getAddress("__stop___llvm_prf_cnts");
 7
 8var cntContent = session.memory.readData(0, cntStart, 8, cntStop - cntStart);
 9
10var executable = session.symbol.getSymbolFileName();
11var outFile = new Packages.java.io.RandomAccessFile(executable + ".cnt" , "rw");
12
13outFile.setLength(0);
14for each (var val in cntContent) {
15    outFile.writeByte(Number(val));
16}
17
18var mcdcStart = session.symbol.getAddress("__start___llvm_prf_bits");
19var mcdcStop = session.symbol.getAddress("__stop___llvm_prf_bits");
20
21var mcdcContent = session.memory.readData(0, mcdcStart, 8, mcdcStop - mcdcStart);
22for each (var val in mcdcContent) {
23    outFile.writeByte(Number(val));
24}
25outFile.close();
This example script produces a raw profile counter file named after the executable using the “.cnt” suffix.
12.1.5.2. Retrieving Counters Using Compiler Runtime Support
Alternatively, the counter data can also be retrieved from memory using a function that is provided as part of the compiler runtime support, __llvm_profile_write_file(). This function writes the counters from the target to the host using runtime routines (fwrite()). Any other means of downloading the data may also be used. This produces a raw profile counter file using the default filename default.profraw.
int test_main(int argc, const char *argv[]) {
  // Call into an important routine
  important_func1();

  // Call into an important routine
  important_func2();

  // Write out counter details to file
  __llvm_profile_write_file();

  // Exit
  return 0;                                                                     }
12.1.6. Processing the Raw Profile Counter Data Into an Indexed Profile Data File
An indexed profile data file should be produced for each executable that is run; it is produced based on a raw profile counter file that has the runtime counter data retrieved from memory (see Retrieving the Counters From Memory section above).
This is done by invoking the tiarmprofdata utility and indicating the raw profile counter file as well as the executable used to produce it. This is required since in order to support embedded use cases, pertinent code coverage information must be extracted from non-allocatable sections in the executable. The result is an indexed profile data file. In the example below, the raw profile counter files used as input are app1.profcnts, app2.profcnts, and app3.profcnts. The resulting indexed profile data file produced for each is app1.profdata, app2.profdata, and app3.profdata, respectively.
tiarmprofdata merge -sparse -obj-file=app1.out app1.profcnts -o app1.profdata
tiarmprofdata merge -sparse -obj-file=app2.out app2.profcnts -o app2.profdata
tiarmprofdata merge -sparse -obj-file=app3.out app3.profcnts -o app3.profdata
12.1.6.1. Merging Multiple Indexed Profile Data Files from Multiple Executables
An indexed profile data file for each executable must be produced before any profile data from multiple executables can be merged. If multiple executables have been run based on the same source code base, the corresponding indexed profile data files for each of the executables can then be merged into a single indexed profile data file.
tiarmprofdata merge -sparse app1.profdata app2.profdata app3.profdata -o app_merged.profdata
Wildcards can be used to identify the range of indexed profile data files used as input.
12.1.7. Visualization
In order to visualize the code coverage, the single merged indexed profile data file along with each of the corresponding executables must be given as input to the tiarmcov visualization tool. The visualization tool can be used to generate a dump of the source file along with a summary report in either HTML or Text format. The names of each executable must be specified individually by name using the --object=<executable> option.
12.1.7.1. HTML Format
When generating HTML output, a summary coverage report is also generated at the root of a directory tree that contains coverage data for each of the files. For the source-based coverage views, it is recommended to use --show-expansions and --show-instantiations options to see the full view of all macro expansions and function template instantiations, respectively. In addition, branch coverage information can be included in the source-based view, and it can be represented in terms of execution count or percentage.
If you need to focus on code coverage for specific source files, you may list the source files following the --sources option.
The following example visualizes coverage in HTML with macros and templates expanded; it also includes detailed branch coverage in terms of execution count.
tiarmcov show --format=html --show-expansions --show-instantiations --show-branches=count
   --object=./app1.out --object=./app2.out --object=./app3.out -instr-profile=app-merged.profdata --sources demo.c
   --output-dir=/example/directory
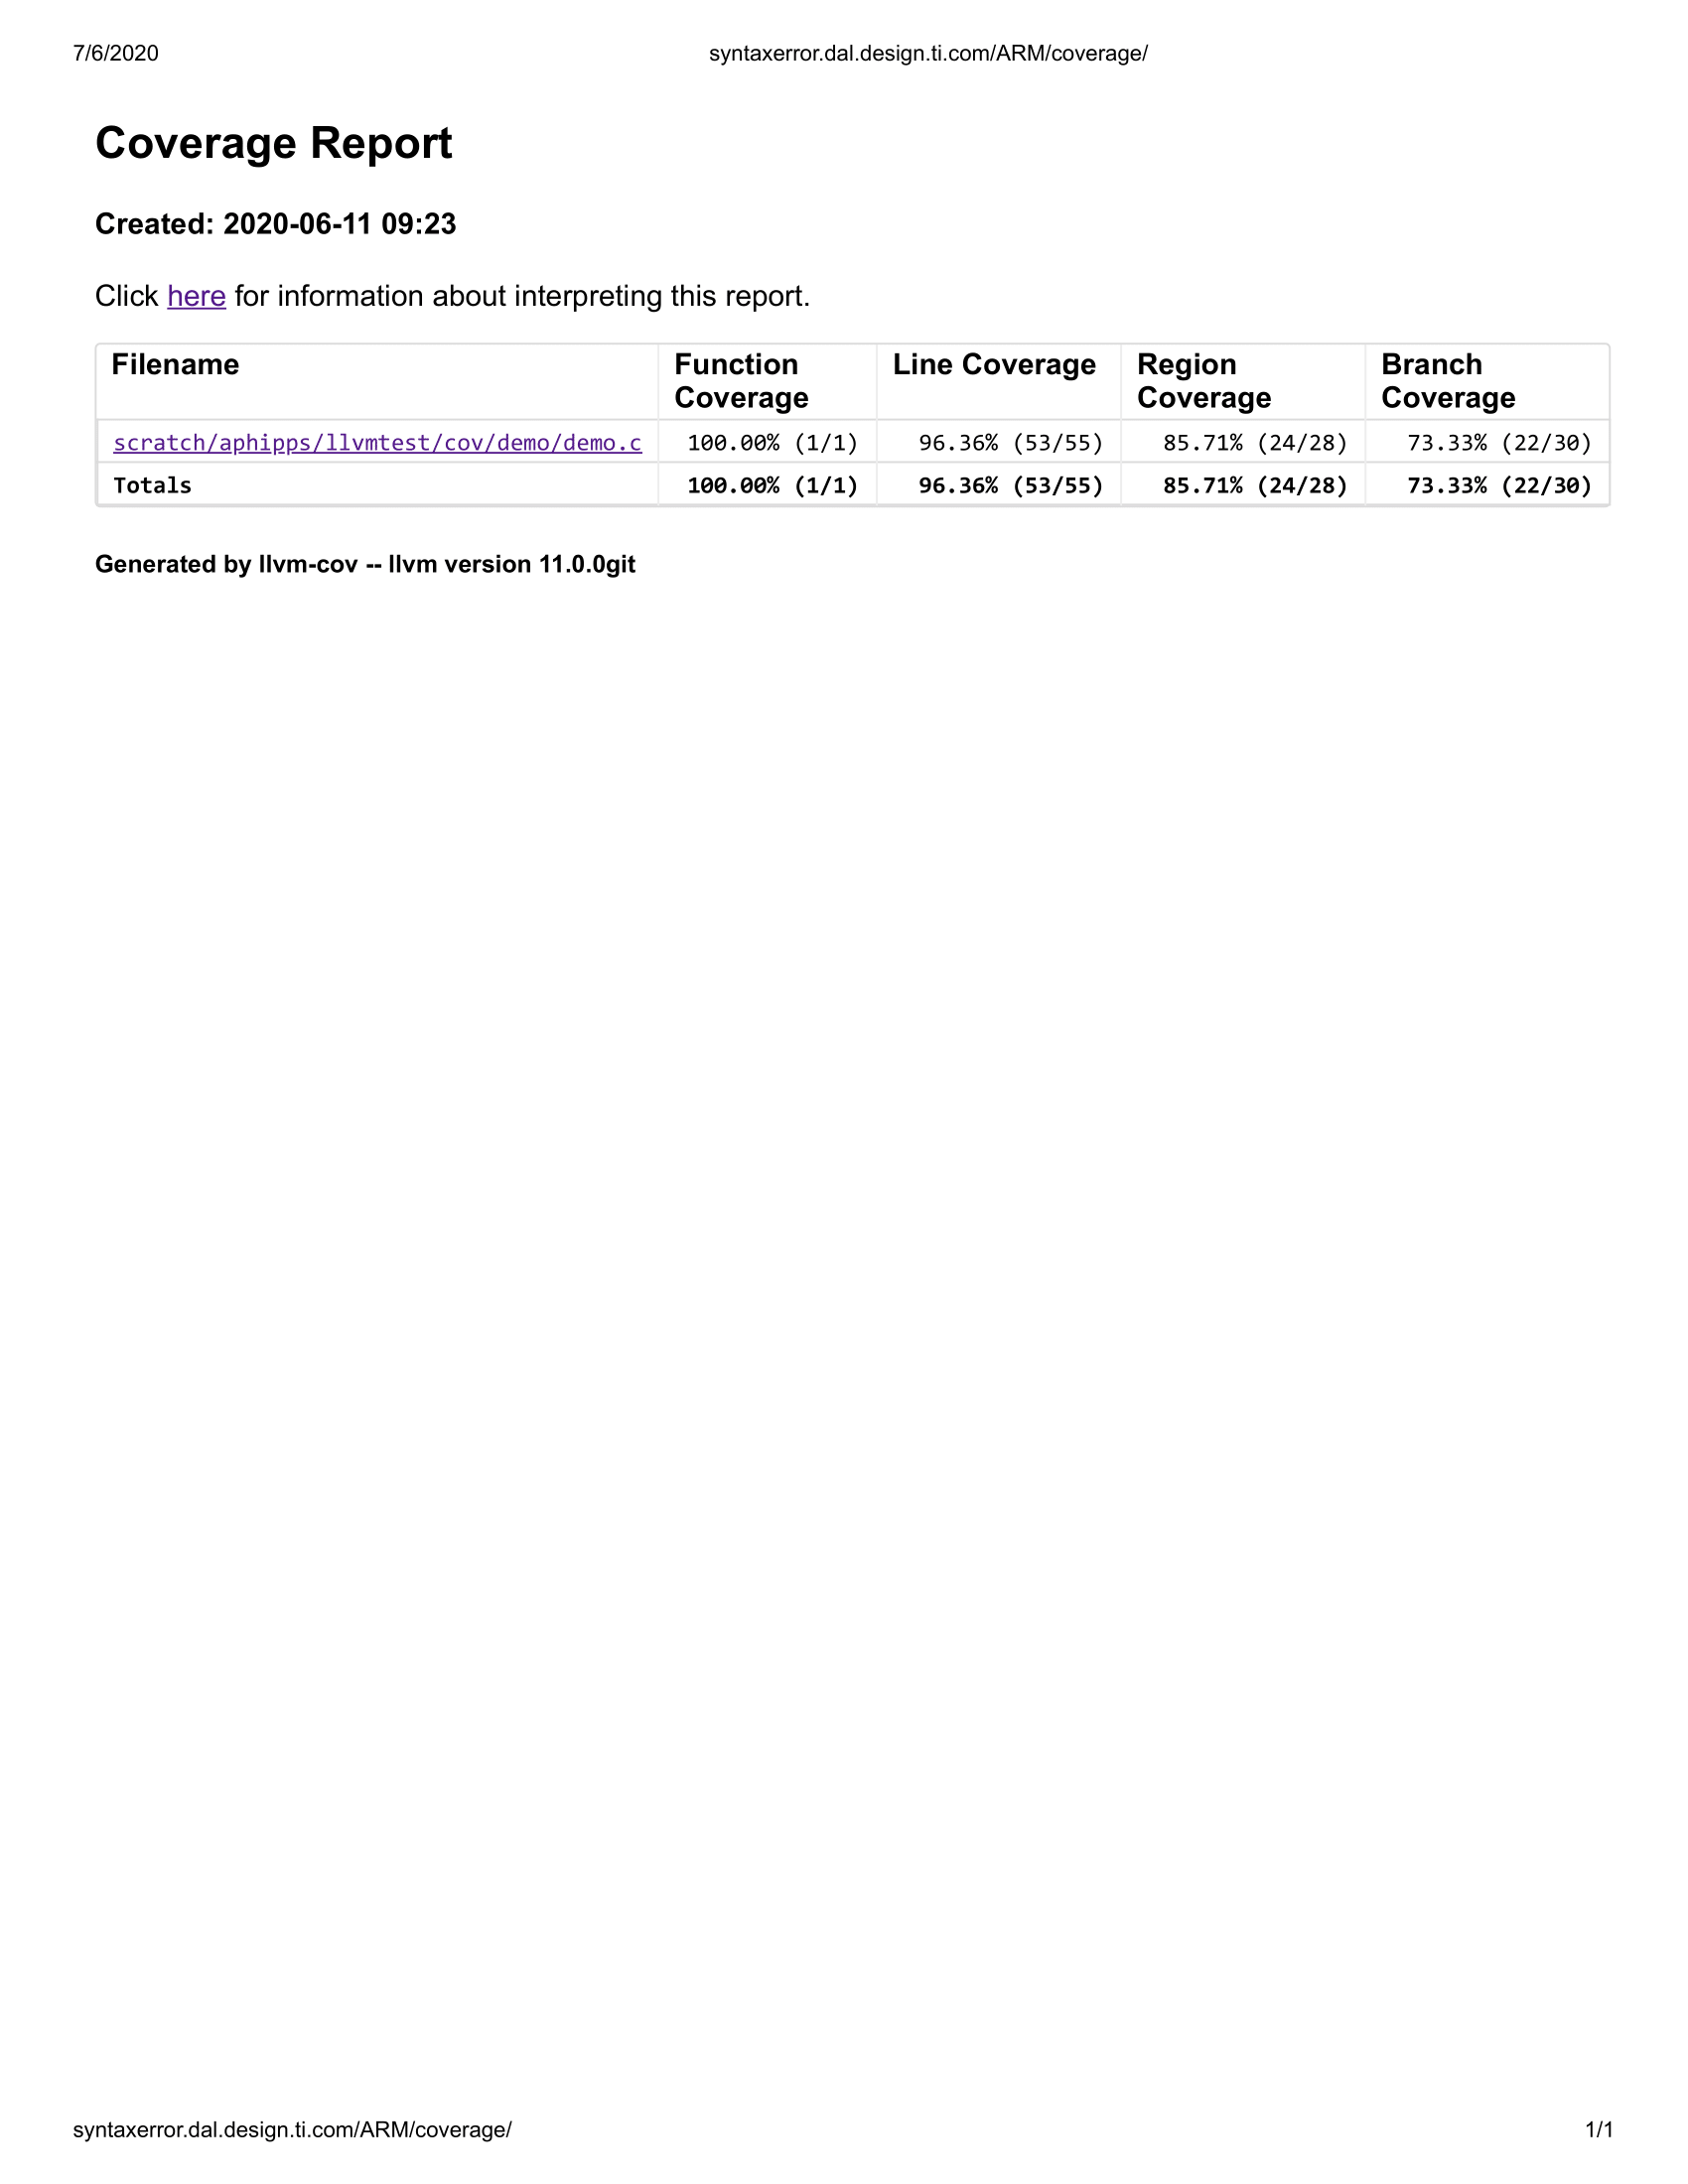
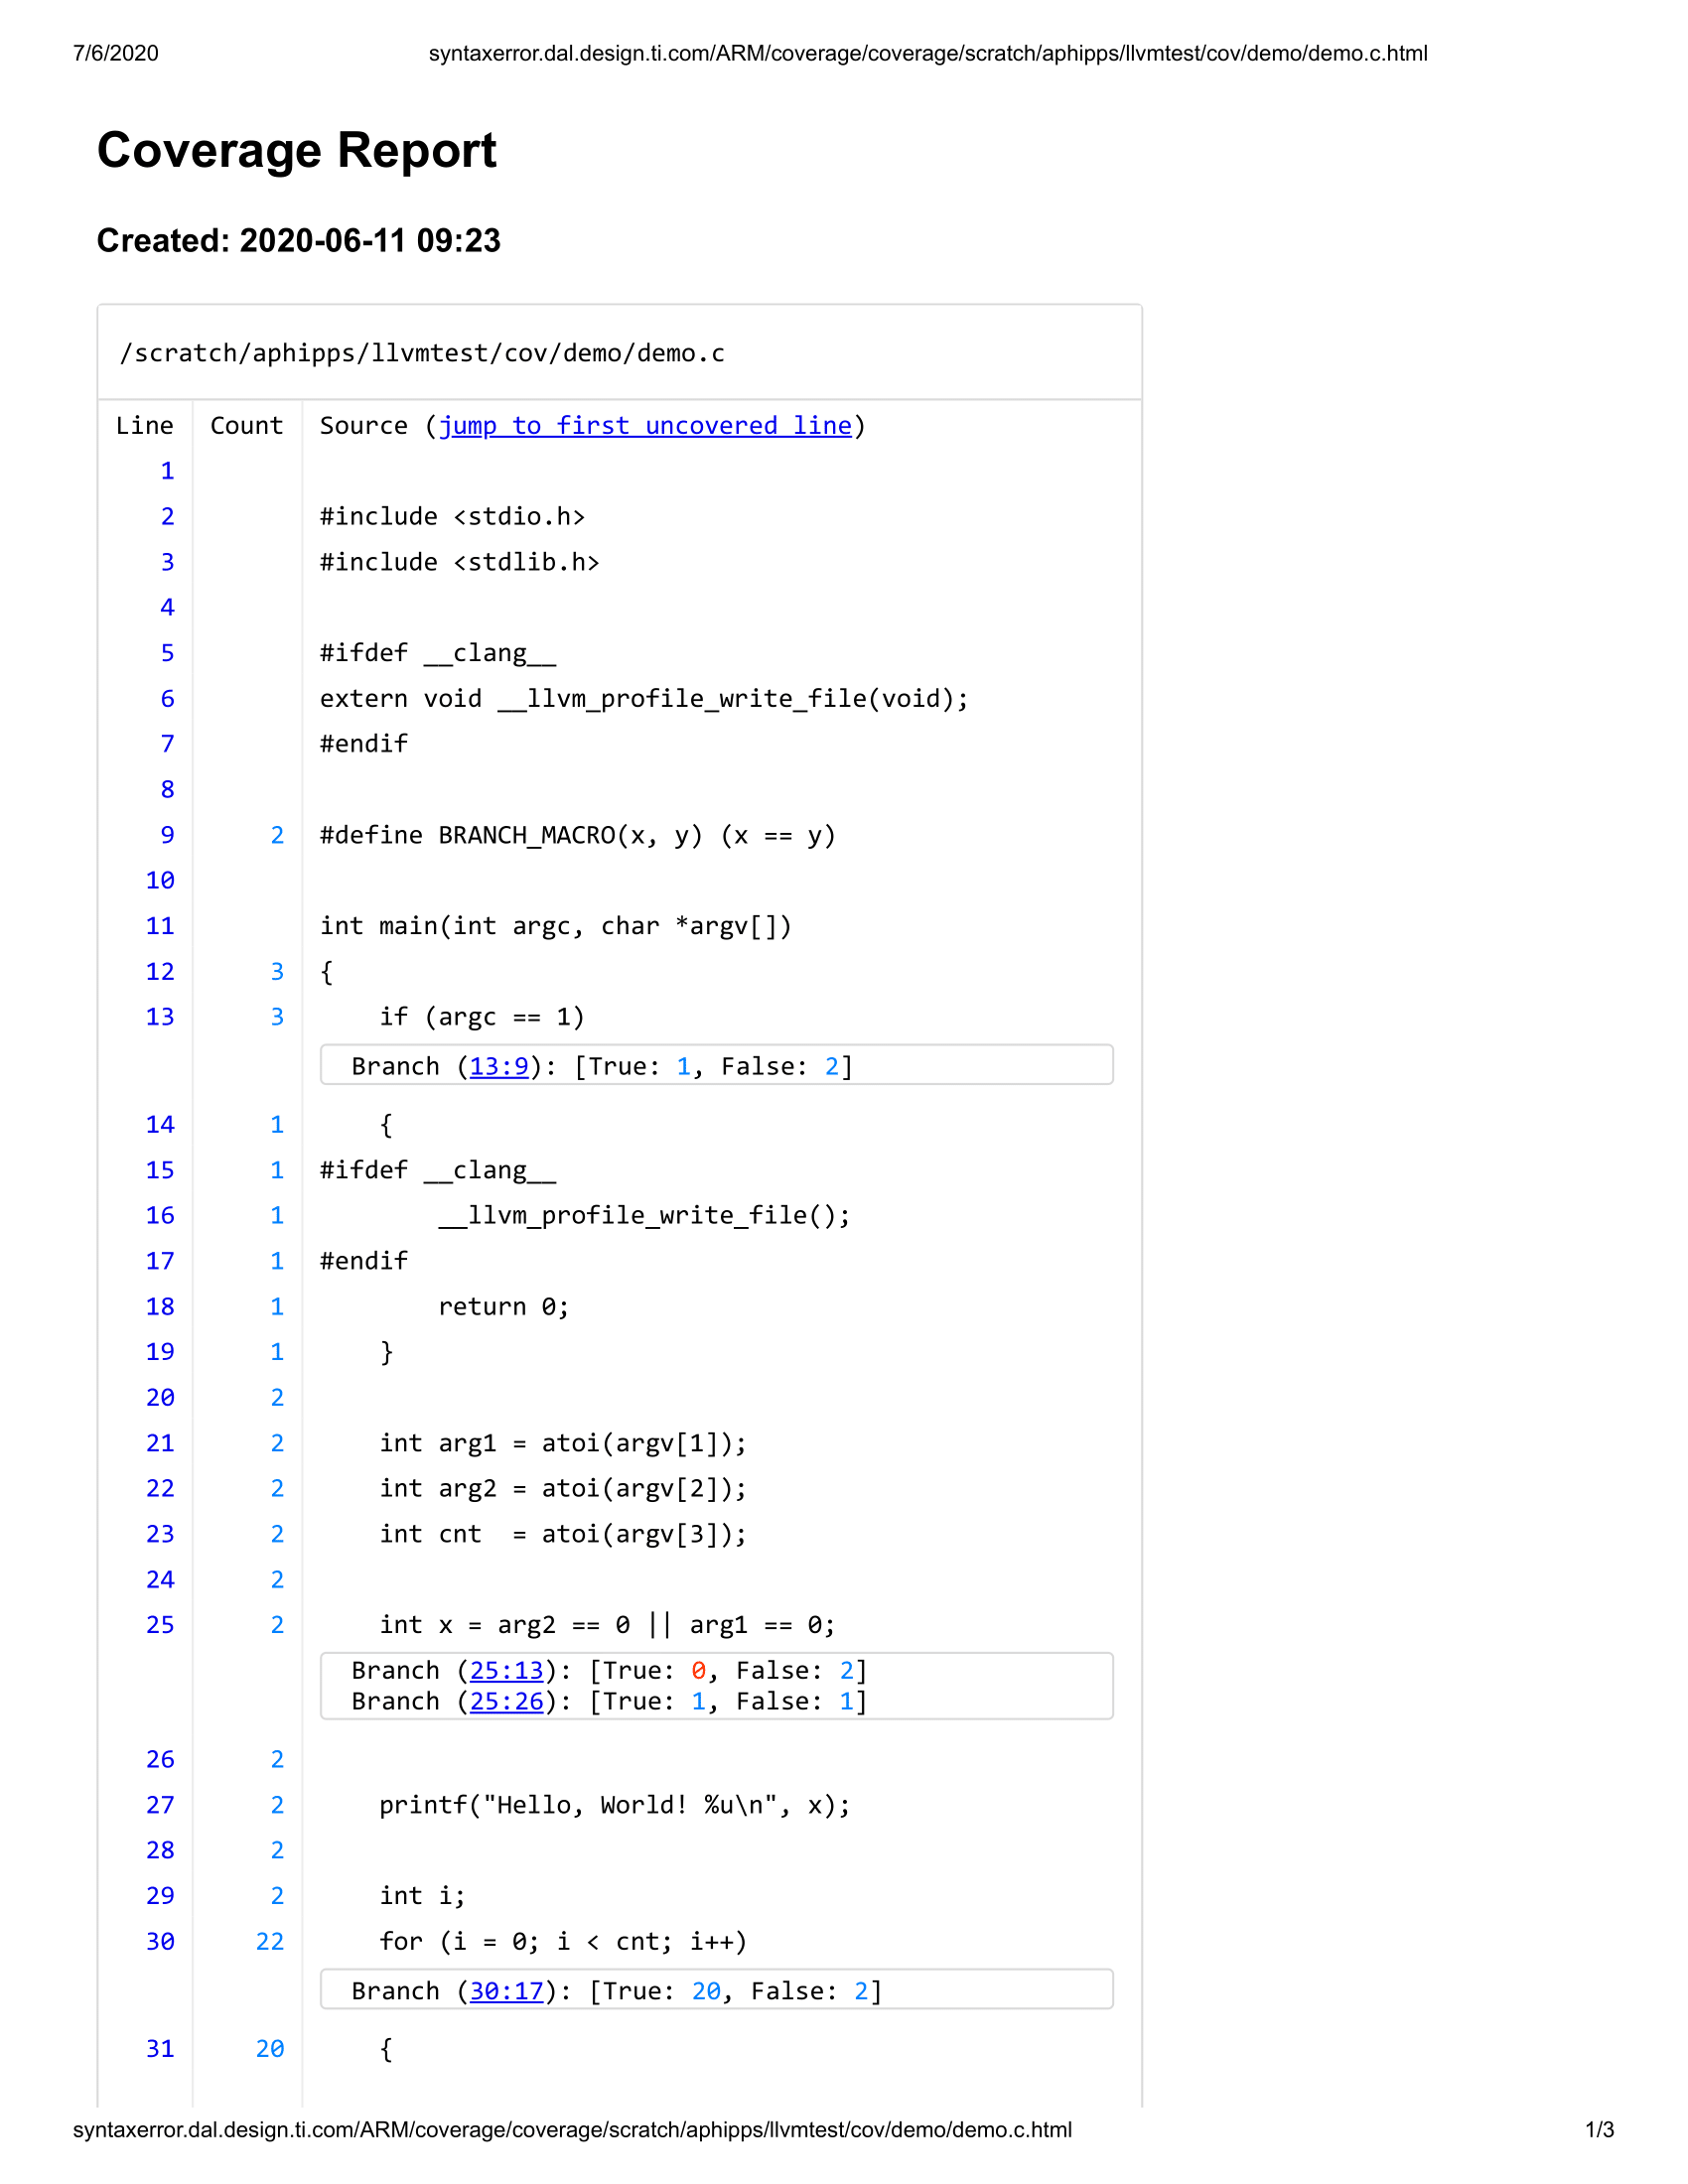

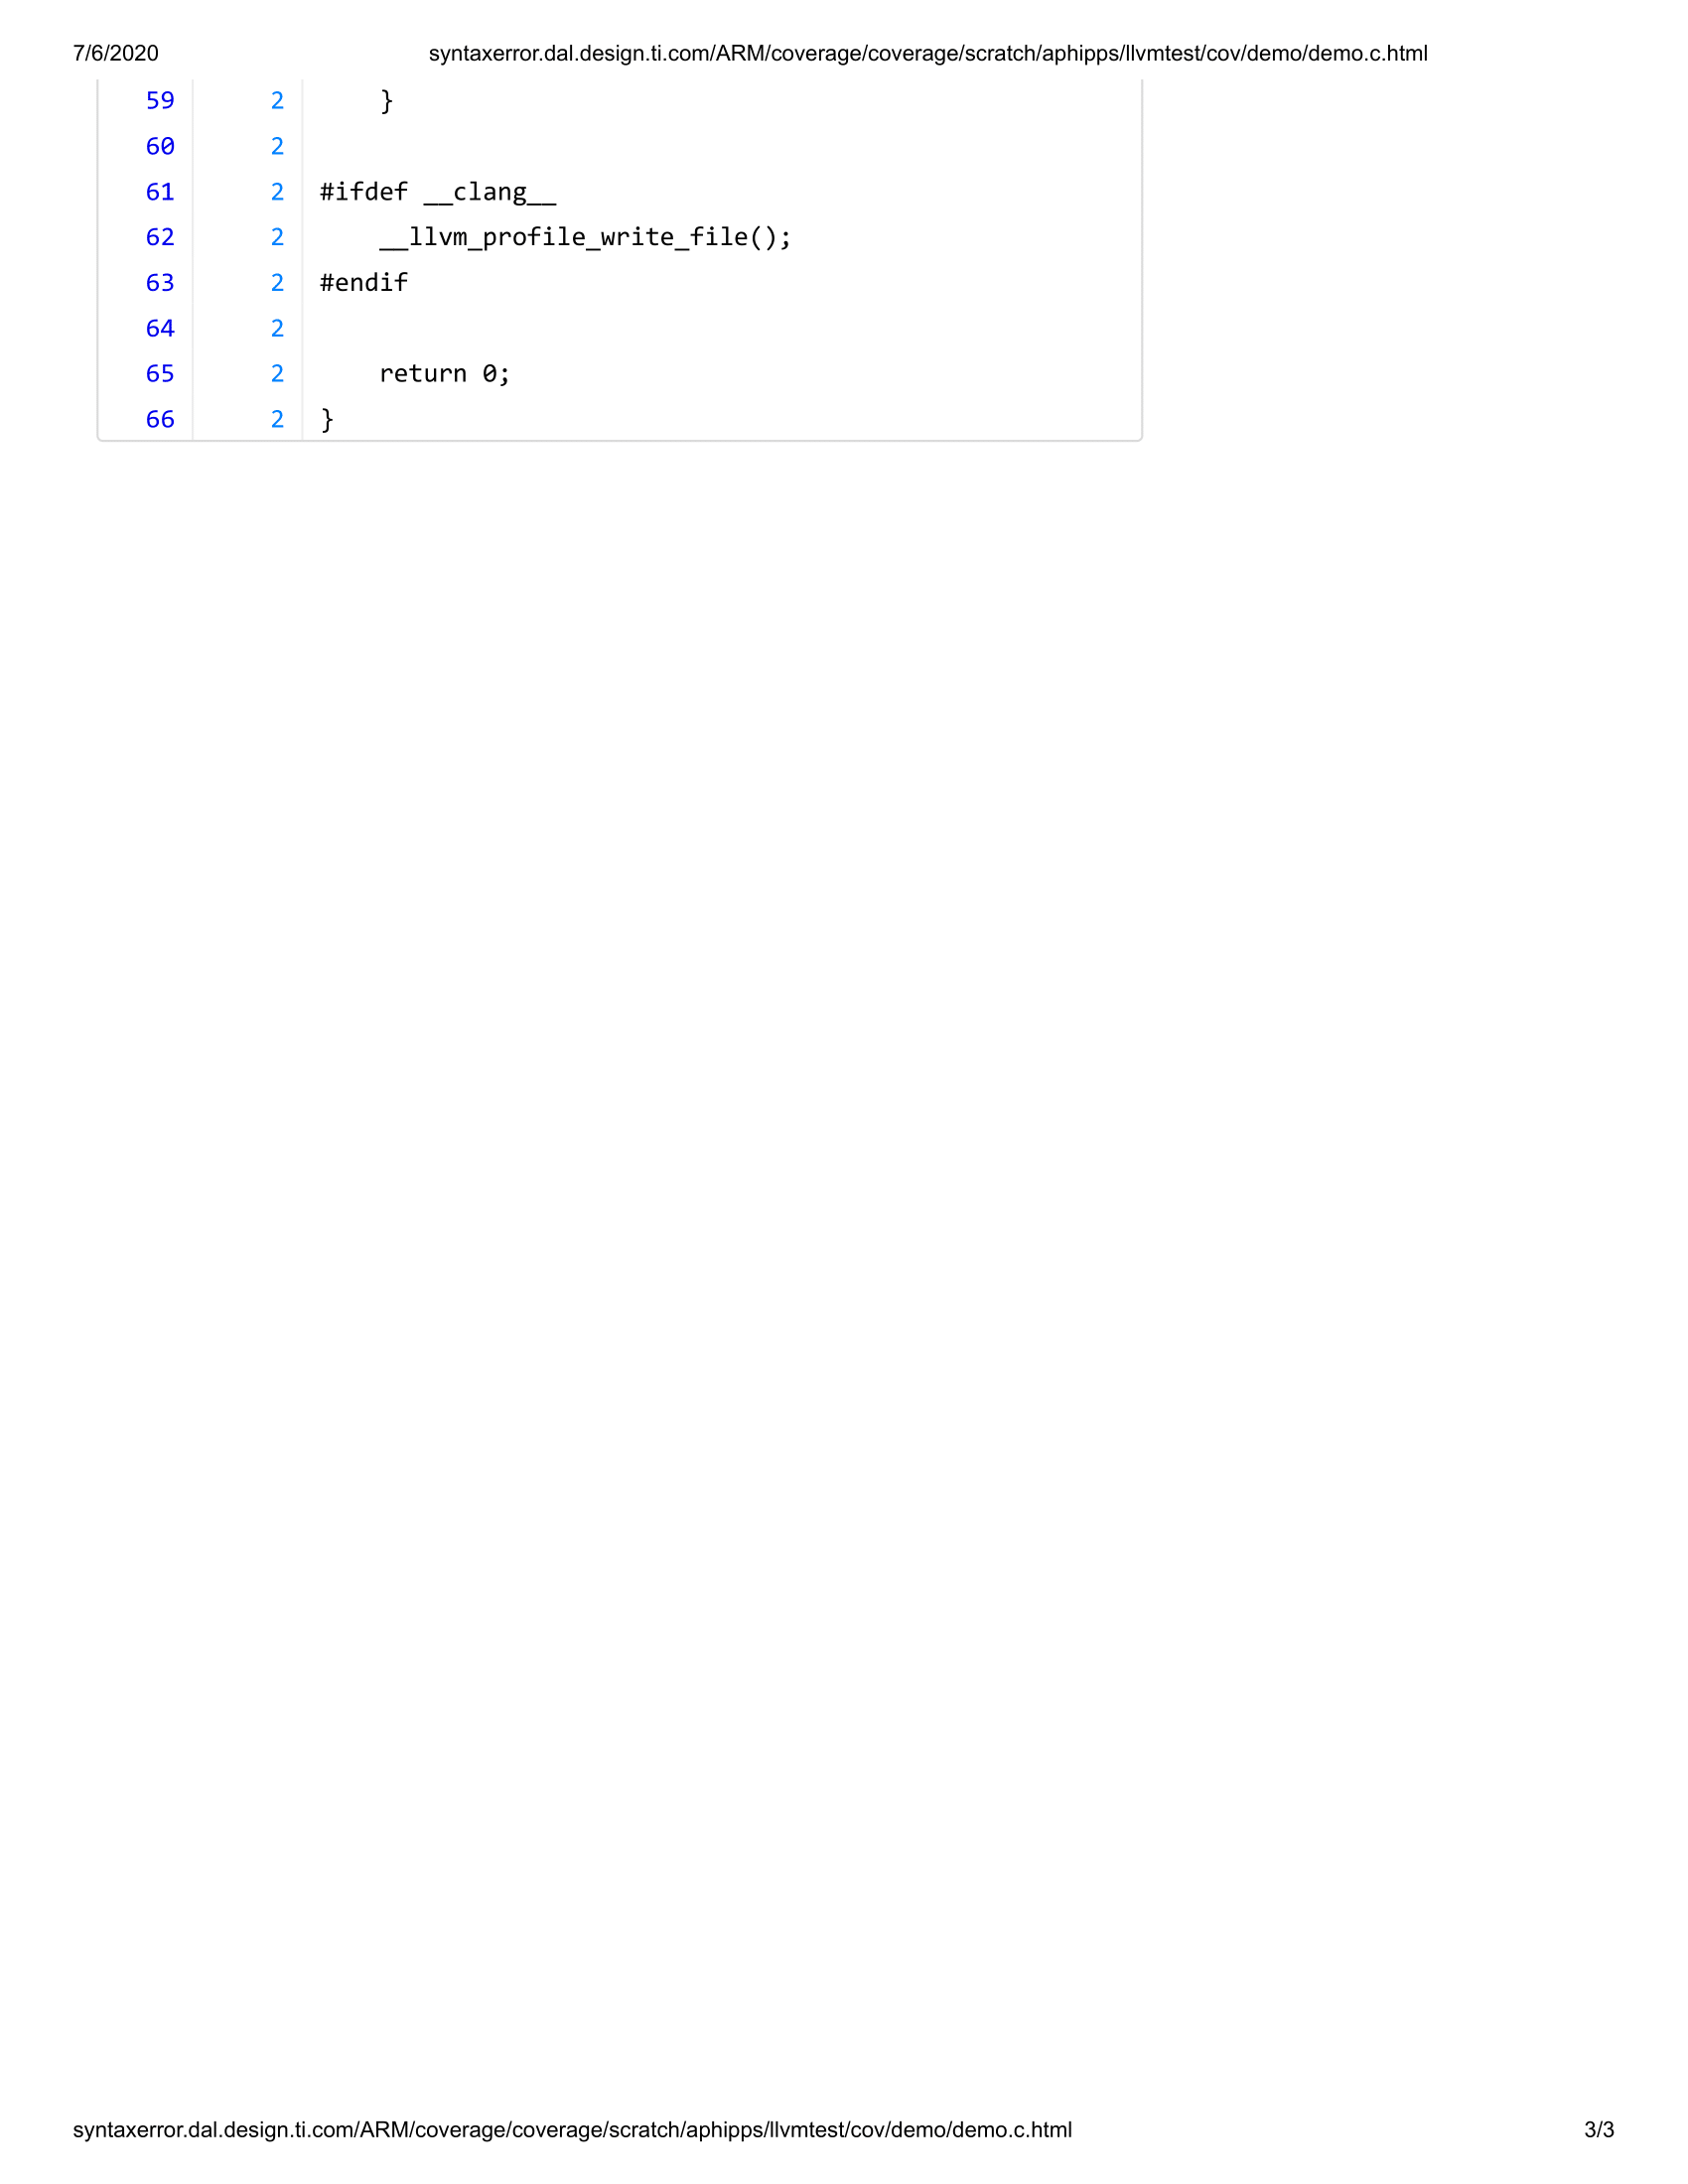

Figure 12.1 Code Coverage HTML Output Format
When generating HTML output with --show-mcdc-summary, the summary coverage report includes an additional column with the MC/DC coverage data.
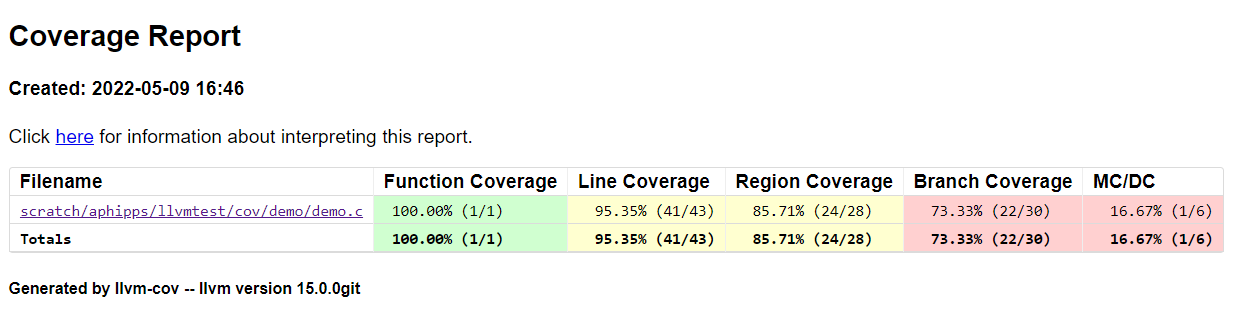
Figure 12.2 Code Coverage HTML Summary Report
12.1.7.2. Text Format
When generating Text output, the summary coverage report is generated using a separate tiarmcov report option. For example, to view the source-based coverage view:
tiarmcov show --show-expansions --show-branches=count --object=./app1.out --object=./app2.out --object=./app3.out -instr-profile=app-merged.profdata
Text Format Output Example

    2|       |
    2|       |#include <stdio.h>
    3|       |#include <stdlib.h>
    4|       |
    5|       |#ifdef __clang__
    6|       |extern void __llvm_profile_write_file(void);
    7|       |#endif
    8|       |
    9|      2|#define BRANCH_MACRO(x, y) (x == y)
   10|       |
   11|       |int main(int argc, char *argv[])
   12|      3|{
   13|      3|    if (argc == 1)
   ------------------
   |  Branch (13:9): [True: 1, False: 2]
   ------------------
   14|      1|    {
   15|      1|#ifdef __clang__
   16|      1|        __llvm_profile_write_file();
   17|      1|#endif
   18|      1|        return 0;
   19|      1|    }
   20|      2|
   21|      2|    int arg1 = atoi(argv[1]);
   22|      2|    int arg2 = atoi(argv[2]);
   23|      2|    int cnt  = atoi(argv[3]);
   24|      2|
   25|      2|    int x = arg2 == 0 || arg1 == 0;
   ------------------
   |  Branch (25:13): [True: 0, False: 2]
   |  Branch (25:26): [True: 1, False: 1]
   ------------------
   26|      2|
   27|      2|    printf("Hello, World! %u\n", x);
   28|      2|
   29|      2|    int i;
   30|     22|    for (i = 0; i < cnt; i++)
   ------------------
   |  Branch (30:17): [True: 20, False: 2]
   ------------------
   31|     20|    {
   32|     20|        if (arg1 == 0 || arg2 == 2 || arg2 == 34)
   ------------------
   |  Branch (32:13): [True: 10, False: 10]
   |  Branch (32:26): [True: 10, False: 0]
   |  Branch (32:39): [True: 0, False: 0]
   ------------------
   33|     20|        {
   34|     20|            printf("Hello from the loop!\n");
   35|     20|        }
   36|     20|    }
   37|      2|
   38|      2|    if ((arg1 == 3) && 1)
   ------------------
   |  Branch (38:9): [True: 0, False: 2]
   |  Branch (38:24): [Folded - Ignored]
   ------------------
   39|      0|      printf("This never executes\n");
   40|      2|
   41|      2|    if (BRANCH_MACRO(arg1, arg1))
   ------------------
   |  |    9|      2|#define BRANCH_MACRO(x, y) (x == y)
   |  |  ------------------
   |  |  |  Branch (9:28): [True: 2, False: 0]
   |  |  ------------------
   ------------------
   42|      2|      printf("This executes on a macro expansion\n");
   43|      2|
   44|      2|    // Explicit Default Case
   45|      2|    switch (arg2) {
   46|      1|      case 1: printf("Case 1\n");
   ------------------
   |  Branch (46:7): [True: 1, False: 1]
   ------------------
   47|      1|              break;
   48|      1|      case 2: printf("Case 2\n");
   ------------------
   |  Branch (48:7): [True: 1, False: 1]
   ------------------
   49|      1|              break;
   50|      0|      default: break;
   ------------------
   |  Branch (50:7): [True: 0, False: 2]
   ------------------
   51|      2|    }
   52|      2|
   53|      2|    // Implicit Default Case
   54|      2|    switch (arg2) {
   ------------------
   |  Branch (54:13): [True: 0, False: 2]
   ------------------
   55|      1|      case 1: printf("Case 1\n");
   ------------------
   |  Branch (55:7): [True: 1, False: 1]
   ------------------
   56|      1|              break;
   57|      1|      case 2: printf("Case 2\n");
   ------------------
   |  Branch (57:7): [True: 1, False: 1]
   ------------------
   58|      1|              break;
   59|      2|    }
   60|      2|
   61|      2|#ifdef __clang__
   62|      2|    __llvm_profile_write_file();
   63|      2|#endif
   64|      2|
   65|      2|    return 0;
   66|      2|}
To view the report:
tiarmcov report --object=./app1.out --object=./app2.out --object=./app3.out -instr-profile=app-merged.profdata
File '/scratch/aphipps/llvmtest/cov/demo/demo.c':
Name                        Regions    Miss   Cover     Lines    Miss   Cover  Branches    Miss   Cover
-------------------------------------------------------------------------------------------------------
main                             28       4  85.71%        55       2  96.36%        30       8  73.33%
-------------------------------------------------------------------------------------------------------
TOTAL                            28       4  85.71%        55       2  96.36%        30       8  73.33%
The overall MC/DC coverage percentage is also shown as part of the report if --show-mcdc-summary is used when generating it:
tiarmcov report --show-mcdc-summary --object=./app1.out --object=./app2.out --object=./app3.out -instr-profile=app-merged.profdata
File '/scratch/aphipps/llvmtest/cov/demo/demo.c':
Name                        Regions    Miss   Cover     Lines    Miss   Cover  Branches    Miss   Cover    MC/DC Conditions    Miss   Cover
-------------------------------------------------------------------------------------------------------------------------------------------
main                             28       4  85.71%        55       2  96.36%        30       8  73.33%                   6       5  16.67%
-------------------------------------------------------------------------------------------------------------------------------------------
TOTAL                            28       4  85.71%        55       2  96.36%        30       8  73.33%                   6       5  16.67%
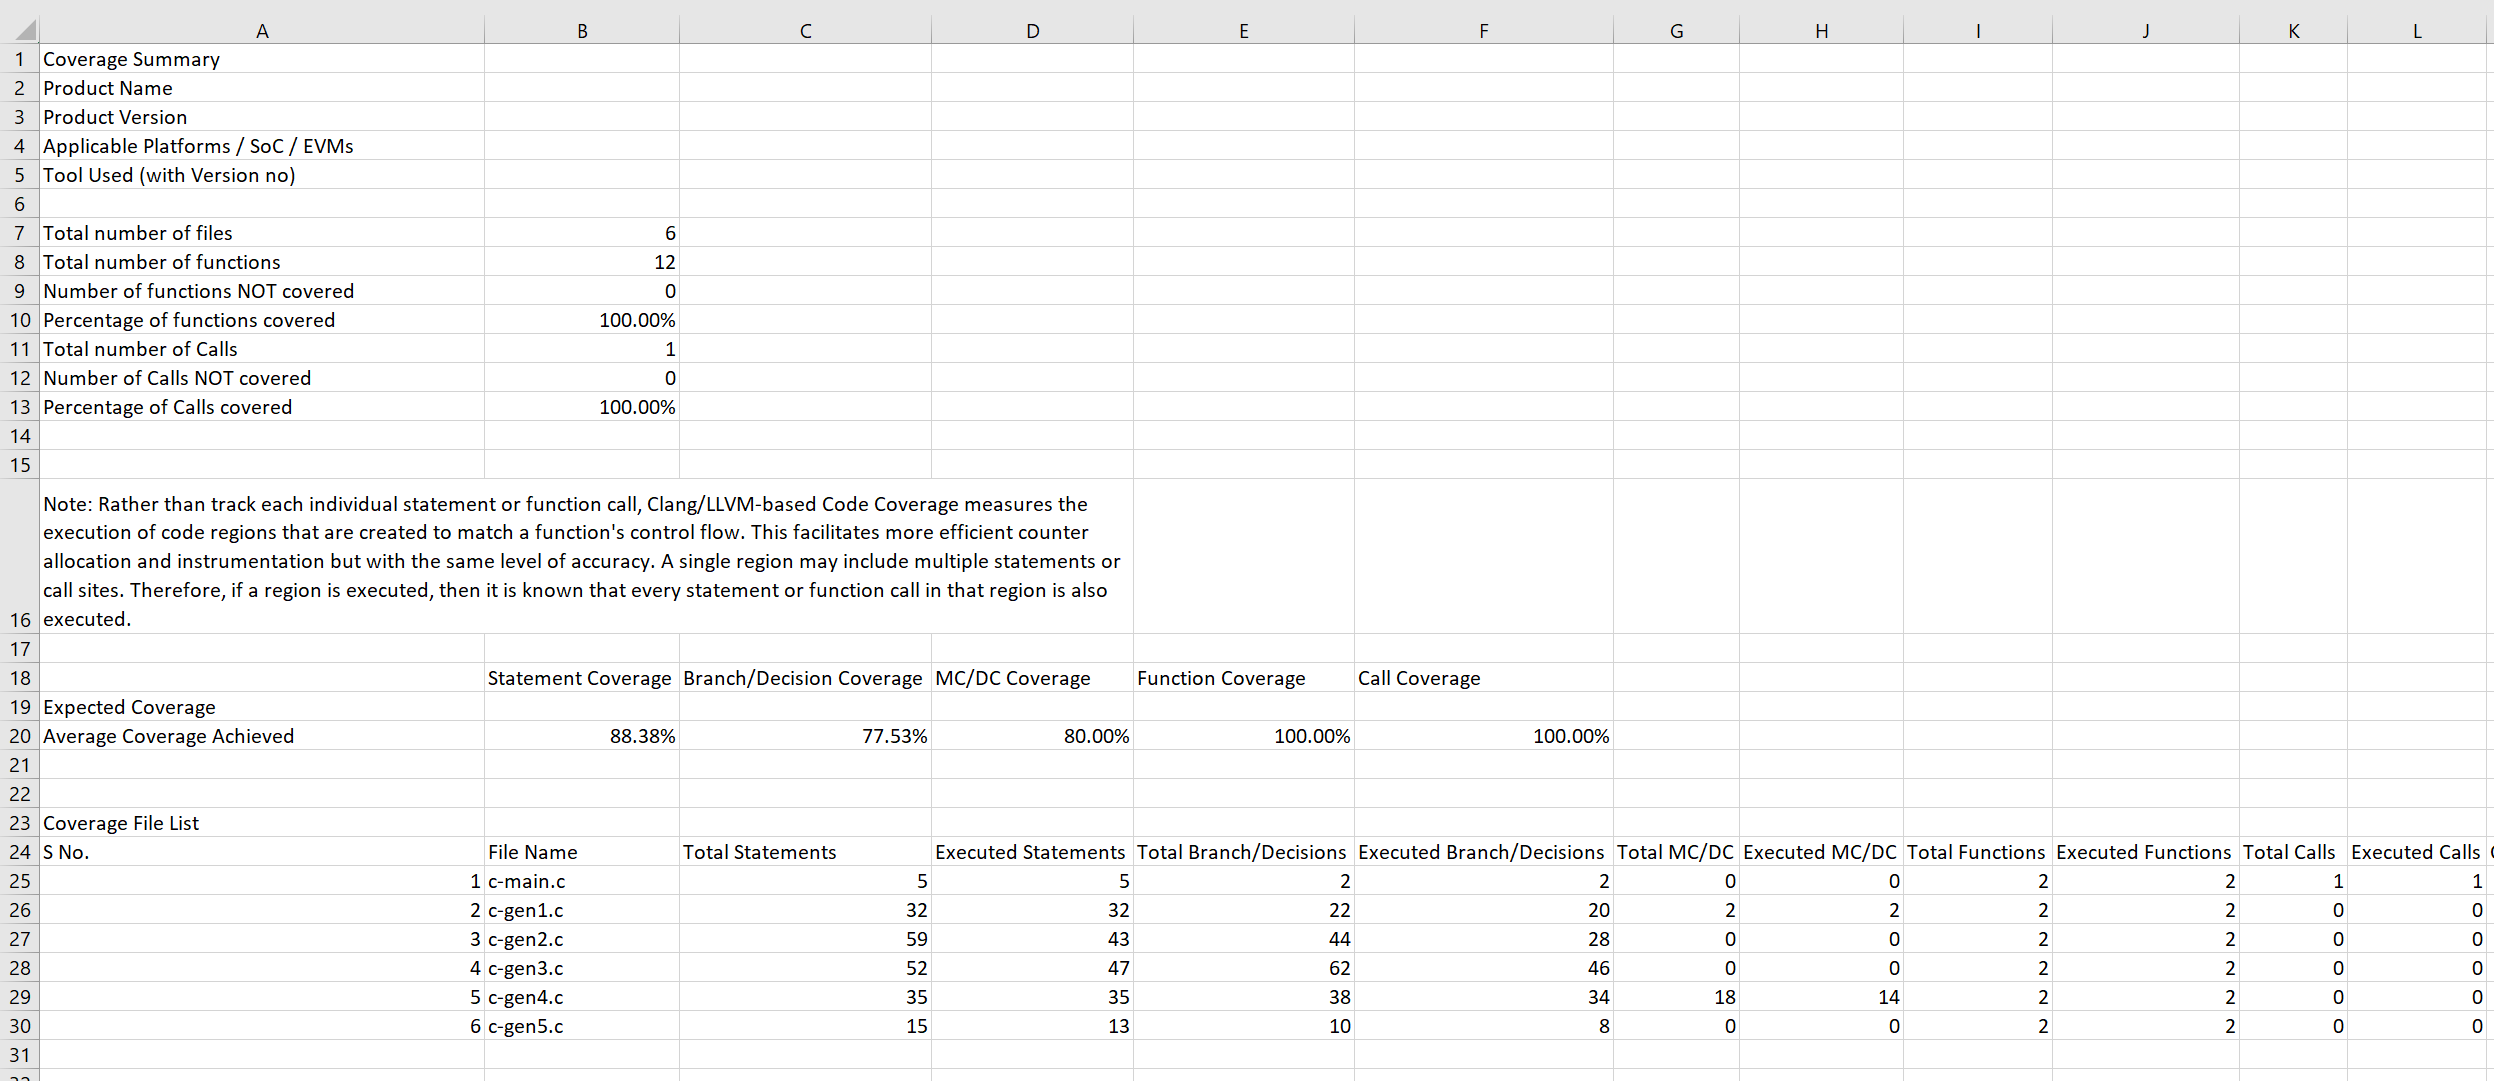
12.1.8. Visualization as TI CSV for Excel
The visualization capability supports exporting the data as a TI-specific CSV format that contains an aggregation of data corresponding to the TI-specified Dynamic Analysis Guidelines.
tiarmcov export --format=csv --object=./multidemo.out -instr-profile=default.profdata --sources c-main.c c-gen1.c c-gen2.c c-gen3.c c-gen4.c c-gen5.c > multidemo.csv
The output can be imported and saved as an Excel spreadsheet where it can be manually adjusted:
This corresponds to the TI-specified Coverage Report Excel Template (Dynamic Analysis Summary) produced by LDRA:
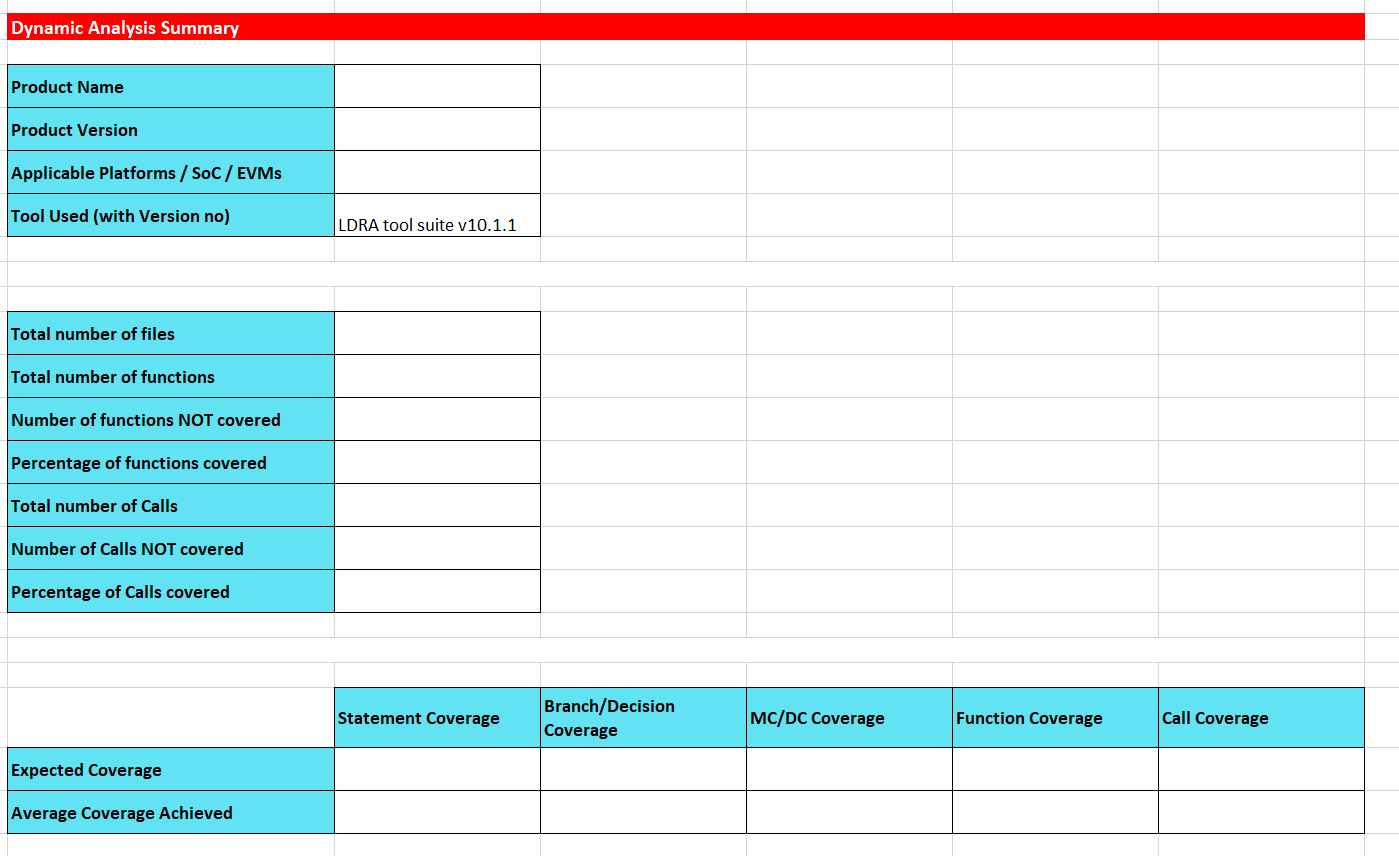
Because a CSV is generated, all of the metric categories are produced on the same sheet. This is different from the TI Excel template which separates data out across multiple sheets.
12.1.9. Important Considerations for MC/DC
MC/DC is a new feature added to Source-Based Code Coverage supported by the TI Arm Clang Compiler.
Boolean expressions with more than six individual conditions are not supported and will result in a compilation error when -fmcdc is used. This restriction is intended to keep the instrumentation footprint optimal.
Boolean expressions that include statements with additional nested Boolean expressions are not supported and will result in a compilation error when -fmcdc is used. For example, the Boolean expression “(x > 3) && my_func((y > 3) || (y < 10))” contains a nested Boolean expression as an argument to the function call to my_func() and is not supported.
Boolean expressions containing strongly-coupled conditions are not handled in a special manner. Each strongly-coupled condition is treated as an independent condition and must be rewritten in order to achieve full MC/DC. For example, “((x > 3) && (y > 2)) || ((x > 3) && (y < 10))” is a Boolean expression that is comprised of a condition “(x > 3)” that is strongly coupled. In order to achieve full MC/DC, the Boolean expression must be rewritten as “(x > 3) && ((y > 2) || (y < 10))”
Foldable constant conditions that comprise Boolean expressions are not counted as measurable conditions for MC/DC and are effectively ignored. Note that a condition that is always true or always false may impact your ability to achieve full MC/DC for other conditions that are not constant.
Some conditions may be unevaluatable due to short-circuit language semantics and don’t actually affect the decision outcome. They are masked by the tooling in the test vector and are considered to have an effective Boolean value of either True or False when compared against other test vectors.
When showing MC/DC data using --show-mcdc, each Boolean expression is annotated in a similar way to the example below. Each leaf-level condition is mapped to a “C” condition name (e.g. C1, C2, etc) for the purposes of visualizing the test vectors, and if it can be shown for a condition that changing its value independently affects the decision outcome while holding all other conditions fixed, the Independence Pair of test vectors that cover the condition is shown. Unevaluatable, short-circuited conditions are rendered using ‘ - ‘ in the test vector.
 12|      5|  if ((a && b) || (c && d))
|---> MC/DC Decision Region (12:7) to (12:27)
|
|  Number of Conditions: 4
|     Condition C1 --> (12:8)
|     Condition C2 --> (12:13)
|     Condition C3 --> (12:20)
|     Condition C4 --> (12:25)
|
|  Executed MC/DC Test Vectors:
|
|     C1, C2, C3, C4    Result
|  1 { F,  -,  F,  -  = F      }
|  2 { T,  F,  F,  -  = F      }
|  3 { T,  F,  T,  F  = F      }
|  4 { T,  T,  -,  -  = T      }
|  5 { T,  F,  T,  T  = T      }
|
|  C1-Pair: covered: (1,4)
|  C2-Pair: covered: (2,4)
|  C3-Pair: covered: (2,5)
|  C4-Pair: covered: (3,5)
|  MC/DC Coverage for Decision: 100.00%
|
------------------
12.1.10. Important Considerations for Branch Coverage
Some other vendors define Branch Coverage as only covering Decisions that may include one or more logical operators. However, Branch Coverage in the tiarmclang compiler supports coverage for all leaf-level Boolean expressions (expressions that cannot be broken down into simpler Boolean expressions). For example, “x = (y == 2) || (z < 10)” is a Boolean expression that is comprised of two conditions, each of which evaluates to either TRUE or FALSE. This support is functionally closer to GCC GCOV/LCOV support.
When showing branch coverage, each TRUE and FALSE condition represents a branch that is tied to how many times its corresponding condition evaluated to TRUE or FALSE. This can also be shown in terms of percentage.
44|      3|    if ((VAR1 == 0 && VAR2 == 2) || VAR3 == 34 || VAR1 == VAR3)
------------------
|  Branch (44:10): [True: 1, False: 2]
|  Branch (44:20): [True: 0, False: 1]
|  Branch (44:31): [True: 0, False: 3]
|  Branch (44:42): [True: 0, False: 3]
------------------
When viewing branch coverage details in a source-based visualization, it is recommended that users show all macro expansions (using option --show-expansions), particularly since macros may contain hidden Boolean expressions. In addition, macro expansions can be nested (macros are often defined in terms of other macros), as demonstrated in the following example. The coverage summary report always includes these macro-based Boolean expressions in the overall branch coverage count for a function or source file.
58|      3|        MACRO2;
------------------
|  |    7|      5|#define MACRO2( MACRO)
|  |  ------------------
|  |  |  |    6|      2|#define MACRO (MACRO_CONDITION ? VAR2 : VAR1)
|  |  |  |  ------------------
|  |  |  |  |  |    5|      2|#define MACRO_CONDITION (VAR1 != 9)
|  |  |  |  |  |  ------------------
|  |  |  |  |  |  |  Branch (5:16): [True: 2, False: 0]
|  |  |  |  |  |  ------------------
|  |  |  |  ------------------
|  |  ------------------
|  |  |  Branch (7:17): [True: 2, False: 0]
|  |  ------------------
------------------
Coverage is not tracked for branch conditions that the compiler can fold to TRUE or FALSE since for these cases, branches are not generated. This matches the behavior of other code coverage vendors. In the source-based visualization, these branches are displayed as [Folded - Ignored], so that users are informed about what happened.
38|      2|    if ((VAR1 == 3) && TRUE)
------------------
|  Branch (38:9): [True: 0, False: 2]
|  Branch (38:24): [Folded - Ignored]
------------------
Branch coverage is tied directly to branch-generating conditions in the source code. As such (unlike with GCOV), users should not see hidden branches that aren’t actually tied to the source code.
For switch statements, a branch region is generated for each switch case, including the default case. If there is no explicitly defined default case, a branch region is generated to correspond to the implicit default case that is generated by the compiler. The implicit branch region is tied to the line and column number of the switch statement condition (since no source code for the implicit case exists). In the example below, no explicit default case exists, and so a corresponding branch region for the implicit default case is created and tied to the switch condition on line 65.
65|      3|    switch (condition)
------------------
|  Branch (65:13): [True: 2, False: 1]
------------------
66|      3|    {
67|      1|        case 0:
------------------
|  Branch (67:9): [True: 1, False: 2]
------------------
68|      1|            printf("case0\n"); // fallthrough
69|      1|        case 2:
------------------
|  Branch (69:9): [True: 0, False: 3]
------------------
70|      1|                               // fallthrough
71|      1|
72|      1|        case 3:
------------------
|  Branch (72:9): [True: 0, False: 3]
------------------
73|      1|            printf("case3\n"); // fallthrough
74|      3|
75|      3|    }
12.1.11. Known Limitations
Counter Initialization After Some Startup Routines
For functions that are part of special boot/reset routines that get called prior to C runtime initialization, counter information for these functions are clobbered. If code coverage data is needed for functions like these, a special startup sequence may be required in your system to ensure the counters are properly initialized to zero and not re-initialized later unless the counter data can be extracted first.
Code Composer Studio Integration
Presently, CCS doesn’t have direct support for tiarmclang compiler Code Coverage, though support will be added soon. This support will make it very straightforward for users to build projects for code coverage, download counter data from memory, and visualize the data.
Counter Size
Counters are 64bits in size, which may be too large for some embedded use cases.
Counter size can be reduced to 32bits by compiling with -fprofile-counter-size=32.
Counters that have large counts may overflow either during execution or when counter data is merged together by the tiarmprofdata tool. When the counter data is merged, tiarmprofdata uses saturating addition, so the final value reflects the largest possible value. This affects the accuracy of the visualization.
Unexpected Function Instantiations of the Same Function
The tiarmcov tool uses a function hash to distinguish between functions. This hash is based on the function name, source filename, as well as all included header filenames as well as their filepaths. For functions that have the same name across multiple binaries, if any of the filepaths are different, then a different function hash is used, and functions that have the same name are treated by tiarmcov as separate function instantiations of the same function. In the source-based visualization, these instantiations show up as subviews preceded by a general summary view of the function.
If a build system regenerates the constituent header files for a source file across different builds such that the header filepaths end up being different from build to build, then even if the header files are identical across builds, the function is represented as multiple instantiations of the same function. If these functions are actually identical, then there will only exist one final set of merged counters for the function, and the coverage will be identical across all instantiations. This will not negatively impact the final coverage summary of covered lines, regions, or branches.
Line Coverage Summary Report shows more Executable Lines than are Actually Executable
Header files that define static inline functions are counted as separate function instantiations of those functions. If a header file is included and one or more of its static inline functions are not invoked, they will show up in the code coverage report as an unexecuted instantiation of the function. Because these functions are not invoked, they won’t be instrumented, and so the code coverage tooling only knows that they exist and how many lines in size they are. The tiarmcov tool will therefore assume that all lines in the function are potentially executable, even though they may contain blank lines or lines with comments that cannot be executed.
Because of this, an unexecuted instantiation that has blank lines and comments may appear to the coverage reporting tools as having more lines to cover than an executed instantiation has, and the line coverage will report less than 100%. While all that is necessary to cover a static inline function is a single executed instantiation, the presence of unexecuted instantiations can make it seem like a subset of lines are uncovered. Note that this is only true for line coverage and not region coverage, branch coverage, or MC/DC.
When this happens, the recommendation is to document the line coverage gap but ignore it, focusing on ensuring that function coverage, region coverage, branch coverage, and MC/DC (if applicable) are covered.
Function Differences
Different function definitions across multiple executables that have the same function name will likely be reported as having “mismatched data”. This is a known issue in code coverage for common function names like main(). Care should be taken to filter out cases like this using the tiarmcov filtering mechanism since each instance clearly represents a different function.
Two or more functions that have the same code base but built different such that they contain different macro expansions will be visualized as multiple instantiations of the same function. This doesn’t impede coverage.
Visualization Tool unable to find Source Code
When a project is built with code coverage enabled, paths to the source code are embedded within the executable file and are extracted by the tiarmcov visualization tool in order to locate the source files. If the system or machine used to build the project is different from what is used to run the visualization tool, the tool will not be able to locate the source files, and it will behave as though no source code is specified.
You can change the embedded source code paths using the --path-equivalence=<from>,<to> option, which will enable the visualization tool to find the source files are a new location. This option allows you to map the paths in the coverage data to local source file paths. This allows you to generate the coverage data on one machine, and then use tiarmcov on a different machine where you have the same files on a different path.
Source Filtering
The source filtering facility implemented by tiarmcov isn’t as fully featured as it is for other vendors, like LCOV. Specifically, embedded filter tags aren’t supported (e.g. LCOV_EXCL_[START|STOP]). Please see the filtering options for more information (tiarmcov --help).
Branch Coverage
Future compiler enhancements will likely be implemented to minimize the number of counters actually used in nested Boolean expressions like “((A || B) && C)”, for example.