
Overview
This workshop provides an introduction to the Code Composer Studio integrated development environment. It will cover how to get started using the environment on a MSP430 LaunchPad.
Requirements
Software:
- Code Composer Studio v7 or greater
- With all MSP430 components installed
Hardware:

Connect the LaunchPad to the Computer via micro-USB cable
Note
This workshop is designed to work with different MPS430 devices and LaunchPads. Thus in the instructions when you see a reference to a specific device or Launchpad, you can replace it with the specific device or LaunchPad that you are using.
LAB 1 - Getting Started
Key Objectives
- Import an example program that blinks the LED
- Start a debug session and load/flash the program to the target
- Run the program
Tools and Concepts Covered
- Eclipse Concepts (Workspace, Workbench, Perspectives, Views, Projects)
- Resource Explorer
- Importing/Building/Running an example project/program
Launch Code Composer Studio (CCS) and Open Resource Explorer
-
Launch CCS with the Code Composer Studio desktop icon
-
Specify a location for your workspace when prompted. This is where your projects will be located. Use a path that does NOT use spaces or any non-alphanumeric characters, with the exception of the underscore character
-
Select Browse Examples in the Getting Started page or go to the menu View -> Resource Explorer
Resource Explorer: Examples
Displays all example projects available under the Resource Explorer. This includes all available content on the remote TI server, in addition to any content you may have installed locally
-
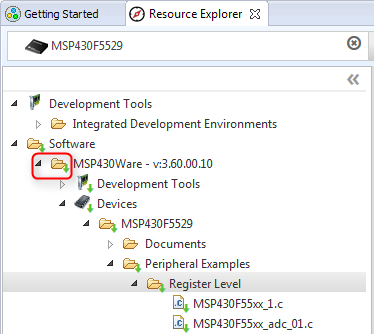
Select the device or board you are working with in the Select a device or board filter box. For this workshop, we select MSP430F5529. You can also select MSP-EXP430F5529LP if working with the Launchpad
-
Select the Register Level examples under Software -> MSP430Ware -> Devices -> MSP430F5529 -> Peripheral Examples (or under Software -> MSP430Ware -> Development Tools -> MSP-EXP430F5529LP -> Peripheral Examples)
-
Click the Install on Desktop icon and select the option to Make Available Offline. This will make a copy of the MSP430Ware package that is on the Cloud onto your local machine. This is required to import any examples into your local CCS environment

A prompt will appear, asking for confirmation. After agreeing to the prompt, the MSP430Ware will start downloading. Once the download and installation to the local environment is completed, MSP430Ware will appear in the Resource Explorer, highlighted with green arrows, indicating that it is available locally (offline) on your machine.
-
Select the MSP430F55xx_1.c example and click the Import to IDE icon

This will create the example project and import it into your workspace. The project will appear in the Project Explorer view if the import is successful

-
Select menu Run -> Debug to build/load/run the project. Alternatively you can click the bug button on the toolbar
Several actions are done automatically
- Prompt to save source files (if necessary)
- Build the project (incrementally)
- Start the debugger (CCS will switch to the CCS Debug perspective)
- Connect CCS to the target
- Load (flash) the program on the target
- Run to main
Don’t want it to do all of the above at once? You can configure it to skip some steps (Debugger Options)
When the project build completes, a message highlighting the ULP Advisor may appear. The ULP advisor checks the project for ultra-low power best practices and provides remarks/advice for improving power consumption. You can click Proceed to ignore the message for now. You can also check the box Do not show this message again if you do not wish to see this message again.
For more information on ULP Advisor, please refer to the ULP Advisor training module

CCS will switch to the CCS Debug perspective and be halted at main()

-
Select menu Run -> Resume or click the Resume button on the toolbar to run the program
Program will run and blink the LED on the Launchpad

-
Click the Suspend button on the toolbar to halt the program
Summary
In this lab we completed the following:
- Imported an example that blinks the LED from MSP430Ware via the Resource Explorer
- Built and ran the example
LAB 2 - Basic Debug Concepts
Key Objectives
- Learn the basics of debugging using the Blink LED example
- Basic Profiling
- Debug code that is already flashed to device
Tools and Concepts Covered
- Basic Debug Concepts
- Breakpoints/Watchpoints
- Profile Clock
- Loading symbols
Breakpoints
Note
Both software breakpoints and hardware breakpoints are available for use. A hardware breakpoint uses debug resources on the device as compared to a software breakpoint which is typically an opcode replacement. A hardware breakpoint is required when setting a breakpoint in Flash, while a software breakpoint can be used in RAM. While the number of software breakpoints available is practically limitless, the number of hardware breakpoints is typically small in number and varies per device
-
If the program is still running click the Suspend button to halt it
-
Go to menu View -> Breakpoints to open the Breakpoints view
-
Double-click in the left selection margin of the editor beside line 75 in MSP430F55xx_1.c. This will set a hardware breakpoint. An icon will appear in the selection margin indicating the location of the breakpoint. It will also be listed in the Breakpoints view.
Different icons are used for hardware and software breakpoints. As the location where this breakpoint is set is in flash memory a hardware breakpoint will automatically be used.

-
Click the Resume button. The program will halt at the breakpoint. Note that the breakpoint that triggered the halt will be indicated in the Breakpoints view by arrows at the bottom of the icon.

-
Remove the breakpoint by selecting the breakpoint in the Breakpoints view and clicking the Remove button.

Watchpoints
A watchpoint is a type of breakpoint that monitors activity on a memory address
-
In the Breakpoints view click the down arrow beside the New Breakpoint button and select Watchpoint

-
Enter i as the location. Click OK.

-
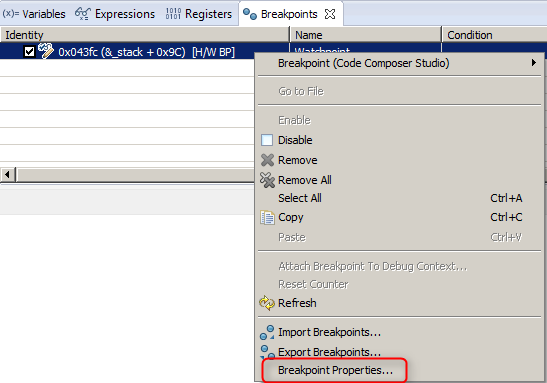
In the Breakpoints view, right-click on the watchpoint and select Breakpoint Properties in the context menu
-
Modify the properties so that the Trigger 0 field is set to Memory Data Bus and the Value field is set to 0x100

Click OK to apply changes
-
Click the Resume button to run the target. Check the value of i in the Expressions view when the program is halted. Note that it should be the same value that was entered in the Value field for the watchpoint properties, in this case 256

-
Remove the watchpoint using the Remove All Breakpoints button in the Breakpoints view
Profile Clock
The profile clock can be used to count clock cycles
-
Restart the program by going to menu Run -> Restart or clicking the Restart button in the Debug view
-
Enable the clock by going to menu Run -> Clock -> Enable

The clock will be displayed in the CCS status bar at the bottom right
-
Double-click in the left selection margin of the editor beside line 75 in MSP430F55xx_1.c. This will set a hardware breakpoint.

-
Click the Resume button
The program will halt at the breakpoint. The Clock will show the number of cycles it took to execute to that point (~7 cycles)
-
Double-click on the Clock icon to reset the count to 0
-
Click the Resume button again
The Clock will show the number of cycles to execute from the previous breakpoint to the current breakpoint (~550011 cycles)

-
Click the Resume button several times and note that the clock cycles increment by about 550011 cycles each time
-
Disable the clock by going to menu Run -> Clock -> Disable
-
Remove the breakpoint by selecting the breakpoint in the Breakpoints view and clicking the Remove button.
Disassembly View
-
Restart the program by going to menu Run -> Restart or clicking the Restart button in the Debug view. The program will be at the start of main()
-
Open the Disassembly view by going to View -> Disassembly. By default it will show the disassembly of the current location in the code. The location of the Program Counter is indicated with a small blue arrow. You can enter in an address or symbol in the location box to change the address that disassembly starts at.
-
Click the Show Source button in the Dissassembly view to toggle interleaving of source code with the assembly code.

Other Views
Several other views are available under the View menu. Experiment with the various views
Registers view
The Registers view is used to display and edit the values of core and memory mapped (peripheral) registers

Modules view
The Modules view enables browsing of loaded debug symbols. This can be especially useful in project-less debug sessions as it provides file and function listings

Loading symbols for flashed program
If a program is already flashed to the device and you wish to just debug the existing code in flash without reloading the code every time, you can configure CCS to debug the program by only loading the symbols
-
Terminate the current debug session by going to menu Run -> Terminate or by clicking the Terminate button in the Debug view
-
In the CCS Edit perspective, select the drop-down menu next to the bug button and select Debug Configurations

Debug configuration contains information about various debug settings. This information is created when a debug session is first launched for a project or target configuration and is cached for future use
More information on debug configurations can be found here
-
Select MSP430F55xx_1.c in the left pane and Program tab in the right pane. Under Loading options select Load symbols only

-
Click Apply and then Debug
The debugger will start up, connect to the target, and load only the symbols for the program (no code is loaded/flashed on the target)
Note that the Program Counter is set to the entry point of the code and not at main()
-
Go to menu Run -> Go Main to run the target to main()

Target is now halted at main()

-
Click the Resume button. Verify that the LED blink program works as expected
-
Terminate the debug session by going to menu Run ->Terminate or by clicking the Terminate button in the Debug view
Summary
In this lab we completed the following:
- Covered the basics of Debugging
- Learned how to use breakpoints and watchpoints
- Learned how to count cycles using profile clock
- Became familiar with several debug views
- Learned how to debug code that is already in flash by loading symbols