3.6.7. SOC Performance monitoring tools on AM5 Devices
3.6.7.1. Introduction
The SOC Performance monitoring tools are a set of tools that are included in the default filesystem that allow the user to visualize various SOC parameters real-time on the screen. Currently, there are two tools and a suite of scripts and utilities to use them.
- soc-performance-monitor
- soc-ddr-bw-visualize
Both these applications are Wayland applications and need to be invoked after running Weston.
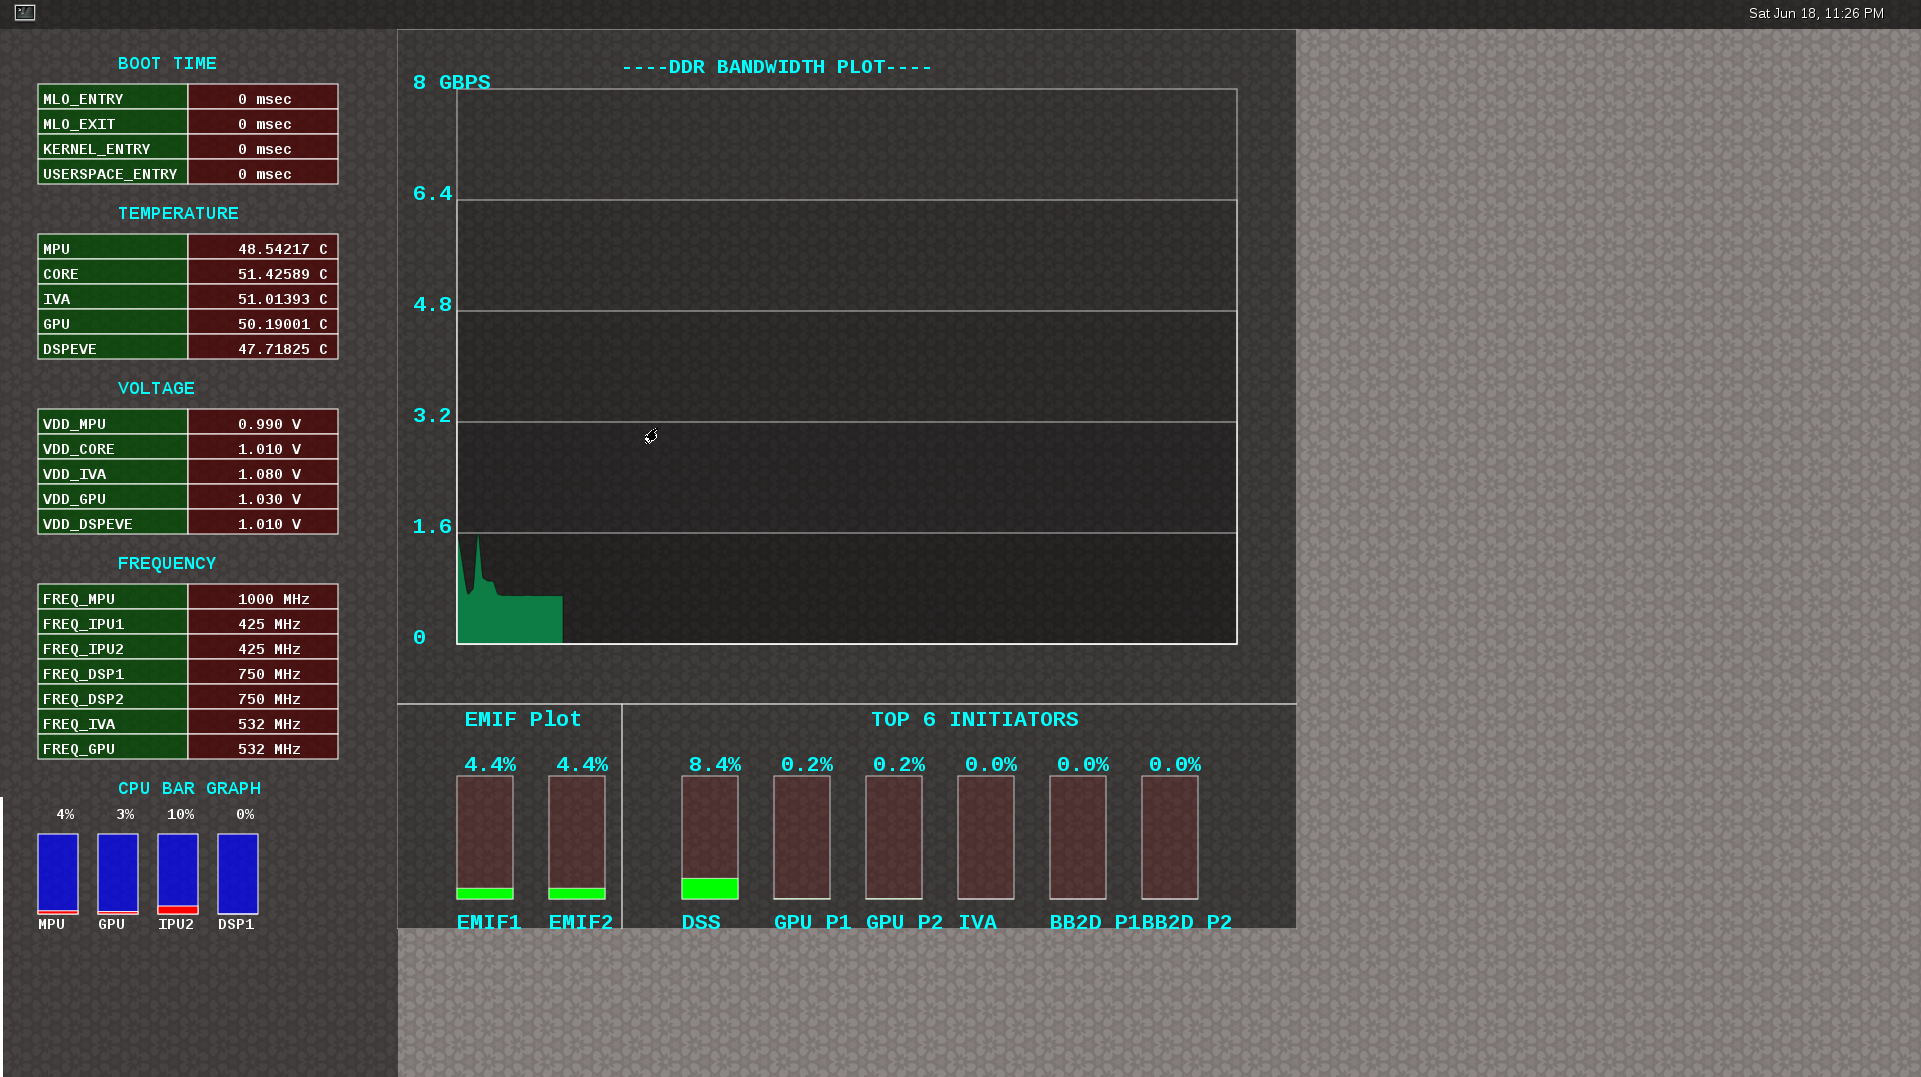
These tools bring in the capability to visualize the following:
- DDR BW Utilization
- Overall DDR BW Usage
- Split of the traffic between the two EMIF’s
- A real time “top” like functionality that depicts the list of “Top 6” initiators generating the traffic.
- Voltage of the various rails
- Frequency of the various cores
- Temperature (read from on-die temperature sensors)
- CPU Load information of the various processor cores, including the GPU and DSP
- Boot time results, which requires rebuild of u-boot and kernel (refer instructions below)
- Power plot (Will be available soon. Note that this requires board modification on the EVM)
3.6.7.2. Getting started
- Prepare the card with PLSDK 3.0.0 or later.
- Boot up
- Start Weston
target # /etc/init.d/weston start
- Copy the required scripts into a temporary folder (this is to allow you to experiment with the settings later)
target # mkdir temp
target # cd temp
target # cp /etc/glsdkstatcoll/* .
target # cp /etc/visualization_scripts/* .
- You should see the following file in the directory after the above operation.
target # ls -al
drwxr-xr-x    2 root     root          4096 Mar 22 18:01 .
drwxr-xr-x    3 root     root          4096 Mar 22 18:01 ..
-rw-r--r--    1 root     root           114 Mar 22 18:01 config.ini
-rw-r--r--    1 root     root           265 Mar 22 18:01 dummy_boot_time_results.sh
-rw-r--r--    1 root     root           419 Mar 22 18:01 dummy_cpu_load.sh
-rw-r--r--    1 root     root           899 Mar 22 18:01 getFrequency.sh
-rw-r--r--    1 root     root          2293 Mar 22 18:01 getTemp.sh
-rw-r--r--    1 root     root           371 Mar 22 18:01 getVoltage.sh
-rw-r--r--    1 root     root           254 Mar 22 18:01 initiators.cfg
-rw-r--r--    1 root     root           143 Mar 22 18:01 list-boot-times.sh
-rw-r--r--    1 root     root           367 Mar 22 18:01 send_boot_times_to_monitor.sh
-rw-r--r--    1 root     root           496 Mar 22 18:01 soc_performance_monitor.cfg
-rw-r--r--    1 root     root           133 Mar 22 18:01 start_visualization_test.sh
- Running the soc-performance-monitor, this tool has two pre-requisites.
- The name of the fifo configured in the file soc_performance_monitor.cfg needs to be created.
- The file soc_performance_monitor.cfg should be present in the current directory. This should be done in the above steps.
- Creating the fifo (mentioned in the soc_performance_monitor.cfg)
target # mkfifo /tmp/socfifo
- Run the tool for various performance metrics
target # soc-performance-monitor &
- Run the tool for DDR BW visualization
target # mkfifo /tmp/statcollfifo
target # soc-ddr-bw-visualizer &
The following sections will talk about the how to populate the data into tools and further controls that are possible.
3.6.7.3. Quick guide to available plugins
Plugins are the entities (scripts/native binaries) that can be used to send commands to the SOC Performance Monitoring tools.
The main intent of this is to separate the visualization engine from the data collection part and allow full configuration of the application.
When the application (soc-performance-monitor) is invoked, it starts up with the default data, which is set to zero. To populate the real values, the user can use the scripts provided in the prebuilt filesystem.
3.6.7.3.1. Temperature data
The temperature data is read from the on-die temperature registers and sent to the visualization tool. The file system comes with a script that does this functionality.
target # sh getTemp.sh
Invoking the above command will populate the temperature table with the current temperature.
3.6.7.3.2. Voltage data
The voltage data is read from the omapconf utility and then parses out the required information to be later sent to the visualization tool. The file system comes with a script that does this functionality.
target # sh getVoltage.sh
Invoking the above command will populate the temperature table with the configured voltage for the various rails.
3.6.7.3.3. Frequency data
The frequency data is read from the omapconf utility and then parses out the required information to be later sent to the visualization tool. The file system comes with a script that does this functionality.
target # sh getFrequency.sh
Invoking the above command will populate the frequency table with the configured frequency for the various cores.
3.6.7.3.4. CPU Load information
The CPU load information needs individual plugin modules for each of the cores. This is envisioned to be different for different systems. The default filesystem contains the plugins required for reading the MPU and the GPU. Other plugins for measuring the loads for the IPU1, IPU2, DSP1 and DSP2 will be available at a later time.
3.6.7.3.4.1. Measuring the MPU load
The filesystem is populated with a binary which is called “mpuload” that reads the /proc/stat interface and derives the load. The user can run the utility in the background with the following commands:
target # mpuload FIFO

Example usage:

target # mpuload /tmp/socfifo 1000 &
After running this binary, the MPU load in the bar graph of the CPU load will be updated dynamically at an interval of 1 second.
3.6.7.3.4.2. Measuring the GPU load
The filesystem is populated with a binary called “pvrscope” that reads the SGX registers via a library called libPVRScopeDeveloper.a. This utility invokes the APIs provided by IMG as part of the Imagination PowerVR SDK and then populates the required FIFO.
Usage instructions:
target # pvrscope <option> <time_seconds>

options:
          -f    write into the FIFO (/tmp/socfifo)
          -c    output to console

time:
          1-n   specified in seconds
          0     run forever
After running this utility, the GPU load in the bar graph of the CPU load area will be updated at an interval of 1 second.
3.6.7.3.4.3. Measuring the DSP load
The filesystem is populated with a binary which is called “dsptop” that collects DSP usage information and then populates the required FIFO.
The user can run the utility in the background with the following commands:
target # dsptop -r <plot_resolution> -f fifo -o /tmp/socfifo -d <refresh_resolution> -n <# of updates>

Example usage:

target # dsptop -r 1 -f fifo -o /tmp/socfifo -d 1 -n 100  &
After running this binary, the DSP load in the bar graph of the CPU load will be updated at an interval specified by the -r and -d directives. As an example, “-r 1 -d 1” means at an interval of 1 second.
3.6.7.3.5. Boot time measurement
This feature will be provided in a future release.
3.6.7.4. Order of execution
The performance visualization tools have to be executed in the following order.
- Launch Weston
- Create required FIFOs
- Configure the .cfg file to suit the required settings
- Run the soc-performance-monitor and/or soc-ddr-bw-visualizer
- Run the plugins to populate data
3.6.7.5. Config file format
The config file has the following format. There are 3 different kinds of sections that can be defined. Please refer to the particular section for more details.
The generic format is:
[SECTION_NAME]
VALUE_1
VALUE_2
..
..
VALUE_N
SPECIAL VALUE
<blank line>
Types of sections
- GLOBAL
- TABLE
- BAR GRAPH
3.6.7.5.1. GLOBAL section
The SECTION_NAME is specified as GLOBAL followed by a sequence of key value pairs.
[GLOBAL]
KEY_1=VALUE_1
KEY_2=VALUE_2
..
..
KEY_n=VALUE_n
<blank>
Global configurations
The list of recognized global values are:
- REFRESH_TIME_USECS
- FIFO
- MAX_HEIGHT
- MAX_WIDTH
- X_POS
- Y_POS
REFRESH_TIME_USECS:
- This will dictate the interval at which the utility is going to run.
- The value is specified in micro seconds
- This value decides a major trade-off, lower rate will increase the CPU load and GPU load.
- The ideal value is about 100000 usecs
FIFO:
- The value of this field is the named pipe or fifo that can be used to communicate with the application.
- User would need to create a fifo (application will prompt if it doesn’t exist)
MAX_HEIGHT, MAX_WIDTH:
- The width and height of the application.
- This can be adjusted based on the number of tables and bar graph entities.
X_POS, Y_POS:
- Decide the starting offset of the application.
- Note that there are commands to move the application (Refer to the commands section).
3.6.7.5.2. TABLE section
The section name can be one of the following:
- BOOT_TIME
- TEMPERATURE
- VOLTAGE
- FREQUENCY
[TABLE_NAME]
 VALUE_1
 VALUE_2
 ..
 ..
 VALUE_N
TITLE="TABLE TITLE",UNIT="unit to be displayed"
<blank line>
Note
The TITLE=list is a list of comma separated values, and TITLE and UNIT are the only supported values.
3.6.7.5.3. BAR GRAPH section
[GRAPH_NAME]
 VALUE_1
 VALUE_2
 ..
 ..
 VALUE_N
 TITLE OF THE GRAPH
 <blank line>
3.6.7.6. Commands
The FIFO can be used to communicate with the soc-performance-monitor application and pass data from the command line or from other applications. There are a few commands that have been implemented to aid in modifying the running application via the FIFO.
The commands in general have the following format:
"INSTRUCTION: DATA_1 ... DATA_N"
and they can be sent to the soc-performance-monitor by simply doing an echo:
echo "INSTRUCTION: DATA_1 ... DATA_N" > FIFO
The currently supported list of supported commands are:
- TABLE
- CPULOAD
Note
To execute a sequence of commands in a sequence, it is advised that a delay of REFRESH_TIME_USECS be inserted between two commands.**
3.6.7.6.1. TABLE command
The format of the TABLE command is:
"TABLE: ROW_NAME value unit"
When this command is issued, the tool will find a table entry with the ROW_NAME in Column 0 and then update the Column 1 of the table with “value unit”.
If the ROW_NAME is not found, then this command will have no effect. Please note that this brings in a restriction that all the tables rows will need to have a unique name. In order to ensure this, the soc_performance_monitor.cfg file will have to be reviewed to ensure unique names.
Example: To update the FREQUENCY table for MPU, the user can send the following command:
echo "TABLE: FREQ_MPU 1500 MHz" > /tmp/socfifo
3.6.7.6.2. CPULOAD command
The format of the CPULOAD command is:
"CPULOAD: CORE_NAME value" > FIFO

 CORE_NAME has to be one of the names specified in the soc_performance_monitor.cfg.
 value is in the range 0 to 100
Usually, the CPULOAD command is invoked through an application monitors the load of a specific core.
In each system, the mechanism to retrieve the CPULOAD of a particular core can vary and it is for this reason that several plugins have been provided and serve as an example for further extension.
Example: To update the CPULOAD table for GPU, the user can send the following command:
echo "CPULOAD: GPU 87" > /tmp/socfifo
3.6.7.7. Executing in debug mode
To launch the application in debug mode for very verbose data on the internal working of the tool, launch the tool with the following option:
# soc-performance-monitor 1
3.6.7.8. Build instructions
The full source of the tool is available and the required recipes have been updated as part of the recipes and upstreamed to meta-arago.
Essentially, if the user builds the Yocto filesystem as documented in the SDG, the tool will get recompiled as part of it.
3.6.7.9. Configuration of the soc-ddr-bw-visualizer
There are two levels of configuration that the tool allows:
- The total time that the tool runs is configured using config.ini.
- To allow finer granularity of control to choose the initiators of interest, the user will have to modify the initiators.cfg.
The tool will have to relaunched for the new settings to take effect.
Footnotes