|
FlowESI GUI
1.01.00.04
|
|
FlowESI GUI
1.01.00.04
|

The File menu allows the user to execute the following action:
Allows the user to print current design. Clicking "Print" will bring up a print dialog.

Allows the user to open a FlowESI GUI project that is within the current workspace.

Saves current state of project.
Allows the user to save current design with different project name.
Allows the user to create or change current workspace.


The edit menu allows user to perform the following operations on the components that have been places in the design area.
Under Options menu the user can:

Allows customizing of Design Area. The following customizations are available:
This options will auto connect all components available in the Design Area.
NOTE: FlowESI GUI only supports 3 LC sensor. Attempting to connect more than 3 LC sensors will pop up a error message.

This menu allows the user to:
Displays FlowESI GUI help documentation.

Displays the following information:

The Flow ESI Design Area allows the user to place and connect an MSP component and up to three LC sensors. Currently the only valid connections are:
| MSP Connection | LC Sensor Connection | |
|---|---|---|
| ESICH0 - ESICH3 | –> | ESICHx |
| ESICOM | –> | ESICOM |
The connection between components can be modified by clicking on the connection and dragging the connection to the desired position.
NOTE: Rearranging components in the Design Area will modify the components connections.

The Design Area can be customized using the Display options under "Options" menu. The table below shows all customization available.
| Customization Option | Description |
|---|---|
| Show connection fly lines | Allows you to hide/show component connections |
| Grid style | Allows to switch between None, Dots, and Lines |
| Colors | Allows to change grid and design area background color |

The following section describes all available configurations options under MSP Properties.

FlowESI GUI allows you to customize the name of the each component. This name is only for identification purposes. The only requirement is that each component have a unique name.

This section allows you to make a device and package selection. For device package information please consult your device specific erratasheet.

ESI High Speed Clock is sourced by ESIOSC by default.
ACLK must be sourced by a high precision crystal oscillator. By default it is expected that a 32768 Hz crystal is used by the application. If a different crystal frequency is used the user must provide this information.

Enabling DAC auto calibration allows the activates auto calibration using the analog front end (AFE2). Auto calibration can run at different intervals. The table below shows the different calibration interval options.
| Auto calibration Options |
|---|
| Every Minute |
| Hourly |
| Every 12 hrs |
| Daily |
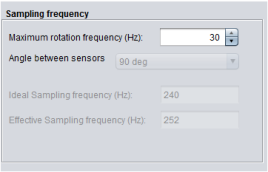
This section allows you to select the desired sampling frequency. The "angle between sensor" is automatically selected based on the number of LC sensors which are correctly connected to the MSP component. The predefined angle between sensors are related to LC Sensor configuration. The table below shows the angle between sensor for each LC Sensor configuration.
| LC Sensor Configuration | Angle Between Sensors |
|---|---|
| 1 LC Sensor Configuration | 360 deg |
| 2 LC Sensor Configuration | 90 deg |
| 3 LC Sensor Configuration | 120 deg |
Ideal sampling frequency is calculated using the following equation where  is the angle between sensors and
  is the maximum rotation frequency.
![\[sampleRate_{min} = 2*\frac{360}{\alpha}*rotation_{max}\]](form_2.png)
The "Number of sensors connected" is automatically selected based on the number of LC sensors which are correctly connected to the MSP component.
Time State Machine (TSM) and Processing State Machine (PSM) are automatically generated based on your sensor configuration. The TSM and PSM tables cannot be modified. However, the tables have the following properties:
Clicking "View TSM Table" will display the TSM table used for the current LC sensor configuration.
Clicking "View PSM Table" will display the PSM table used for the current LC sensor configuration.
This section allows you select the type of board you will use to load the code. Currently two boards are supported:
Allows you to select between available board selections.

Based on the selected board, different options are enabled. The next table provides a description for each output options.
| Output Option | Description | Requirement |
|---|---|---|
| Toggle LED every time a rotation is detected | Toggles every time bit Q6 is set | Board must have "Rotation LED" enabled |
| Turn ON LED during recalibration | LED is turned ON while auto calibration routine is running |
-Board must have "Calibration LED" enabled -DAC auto calibration must be enabled in "ESI Config" Tab |
| Display rotations on LCD | Updates LCD counter every time a complete clockwise rotation is detected |
-Board must have same 24 segment LCD as EVM430-FR6989 -Enable LCD option in the board configuration file |
| Enable Target Communication via HID/UART communication bridge | Enabling this option allows you to perform the following actions: Start auto calibration routines, send ESI counters information, send debug information |
-Board must have a HID/UART communication bridge same as EVM430-FR6989 -Enabled target communication in the board configuration file |
This section allows you to enable various ESI interrupt sources. The following table list all available interrupts and describes its source.
| ESI Interrupt Service Routine Options | Interrupt Description | Default action |
|---|---|---|
| Handle "clockwise" rotation counter increments | Interrupt occurs every time ESICNT0 increments |
|
| Handle "counter clockwise" rotation counter increments | Interrupt occurs every time ESICNT2 decrements |
|
| Handle "bidirectional" rotation counter updates | Interrupt occurs every time ESICNT1 updates |
|
| Handle rotation "errors" | Interrupt occurs every time Q7 bit is set |
None |
| Handle "rotation detection" | Interrupt occurs every time Q6 bit is set |
|
This section allows you to generate:
IMPORTANT: If updating a project via ESI Configuration files only resulted in compilation errors. It is recommended to use the Full Project.
Output Directory always point to directory which contains the current FlowESI GUI project.
IMPORTANT: To update the output location you must create a new FlowESI GUI project (File –> Save As)
Generates a full CCS project using projecspec file. For more information on how to import, compile and load CCS project please refer to Loading and Running Generated Projects
Generates a full IAR project files (.eww, .ewp, and .ewd). For more information on how to import, compile and load IAR projects please refer to Loading and Running Generated Projects
Using this code generation option will ask you to provide the path to the CCS project location. Once you provide the path to the CCS project location only ESI configuration will be updated.


Updated ESI Configuration files in IAR project.
This section allows you to control the following actions on your board via FlowESI GUI:
Connects/Disconnects to HID/UART Bridge. Connecting to the HID/UART bridge will enable all "Control Panel" options.

The control panel allows you to control all target communication actions. This panel is only enabled after a valid HID/UART bridge communication is established. Th available actions are:

This section allows you to track the initial calibration process. For more information regarding the calibration process please refer to Loading and Running Generated Projects section.

This panel provides information regarding TSM delay settings for each ESI channel. The each delay measurement is displayed in micro seconds  . For more information regarding the calibration process please refer to Loading and Running Generated Projects section.
This panel provides information regarding initial DAC calibration. After DAC calibration process is completed this section will display the DAC values found for each ESI channel. The DAC values are in Volts (V).

This section is enabled by clicking on "Send counters info". This section provides transmission status, rotation direction (clockwise or counterclockwise), and ESI counters information (ESICNT0, ESICNT1, ESICNT2). In addition, the Status Log allows you to monitor HID/UART bridge status, active transmissions (e.g. transmitting counters info or debug info) and recalibration using AFE2 status.
This panel will display a "Transmitting... " message while an "Send counters info" is enabled.
This panel will display a "Clockwise" or "Counter Clockwise" message while an
"Send counters info". The direction is determined based on the ESICNT information received from the target board.
This panel display the current ESICNT, ESICNT1 and ESICNT2 information in the target board. The format to display the counters values is uint16_t data type.
This panel provides the following information:

This panel provides basic debug information.
NOTE: In order to properly visualize debug information it is recommend that a low sampling rate is used while using this feature.
This information is obtained from bit 6-0 in ESIDEBUG1 register.
This information is obatined form bits 7-0 in ESIDEBUG2 register.

This panel allows you to visualize the theoretical LC Sensor Oscillation. The equation used to generate the oscillation graph is shown below.
![\[v(t) = 1.5*cos(\omega t)*e^{-\delta t}+1.5\]](form_4.png)
NOTE: The only purpose of the LC sensor properties is to allow users the analyze the effect of inductance,  , and capacitance changes. Inductance, , and capacitance values are not use during code generation.
Allows user to set inductor values in  and in
Allows user to set capacitance value in pF.
The LC Sensor Oscillation graph is automatically updated when any of the inductor or capacitance parameters are modified.
The default x-axis unit are  . The axis units can be observed when graph is horizontally scrolled.
To Auto-Scale the graph Right-click on any section of the graph.

To zoom-in in on the top left corner of the region to be zoom in and drag the mouse to the bottom right corner of the zone to be zoom in.

Click and drag the mouse in a motion as shown in the picture above.