- Note
- The screen shots shown on this page are for AM64x MCU+ SDK v8.0.0. You would see your specific SOC and SDK version that is installed. However the instructions and steps mentioned remain the same, unless mentioned otherwise.
Introduction
CCS Cloud is a web-based IDE which can be used to edit, build or even debug (limited to single stepping, adding breakpoints and watch expressions) applications running on an EVM/LaunchPad connected to the PC all from just the browser. While this is a great tool for starting evaluation and development on a particular EVM/LaunchPad, it is recommended to make a switch to the Desktop version of CCS for advanced debugging capabilities.
Importing an example project to CCS Cloud
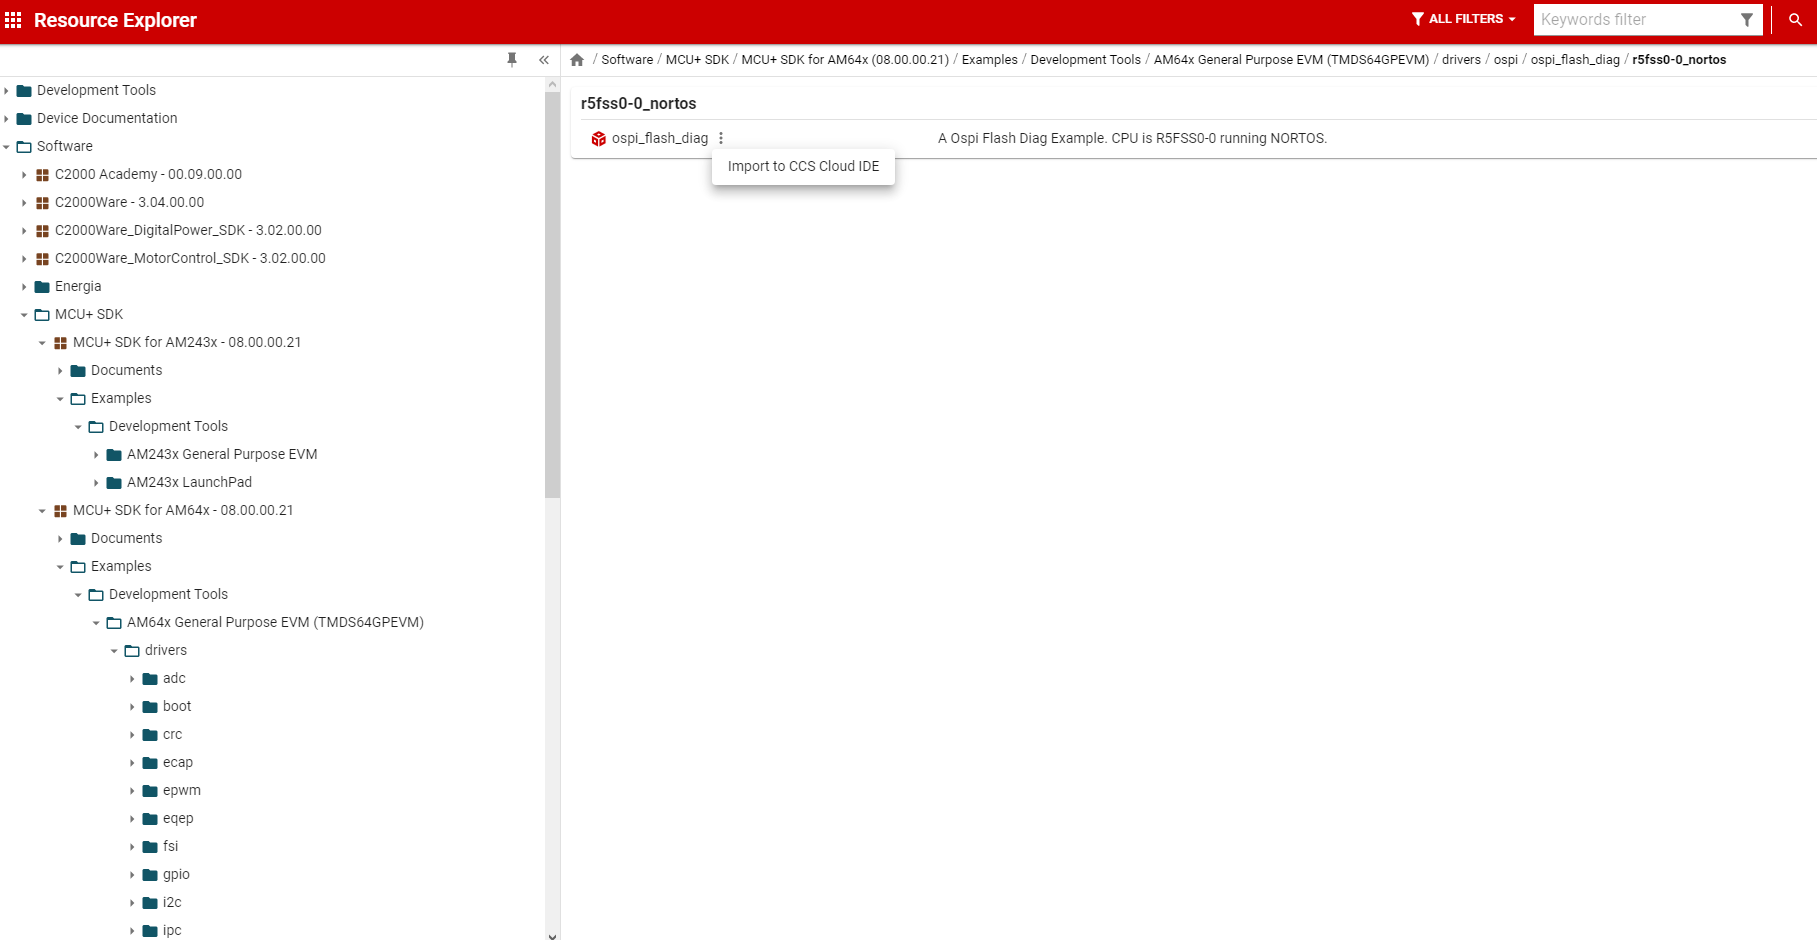
- The recommended way to start using MCU+SDK with CCS Cloud is to start with an example project. You can import example projects from TI Resource Explorer which is another web-based tool for hosting and exploring TI packages like SDKs. Refer Using TI Resource Explorer from Browser to see how to open TI Resource explorer in web browser and browse through the latest MCU+SDK package. Once you navigate to example project, you can click on the three dots next to the example and click
Import to CCS Cloud IDE as shown in the picture.
Import from TIREX
- It might take a while to open the CCS Cloud IDE. If you're opening the IDE for the first time, there might be some one time initializations required. Wait for this to complete. Once all this is done, you should be able to see the example project imported to the CCS Cloud workspace as shown below.
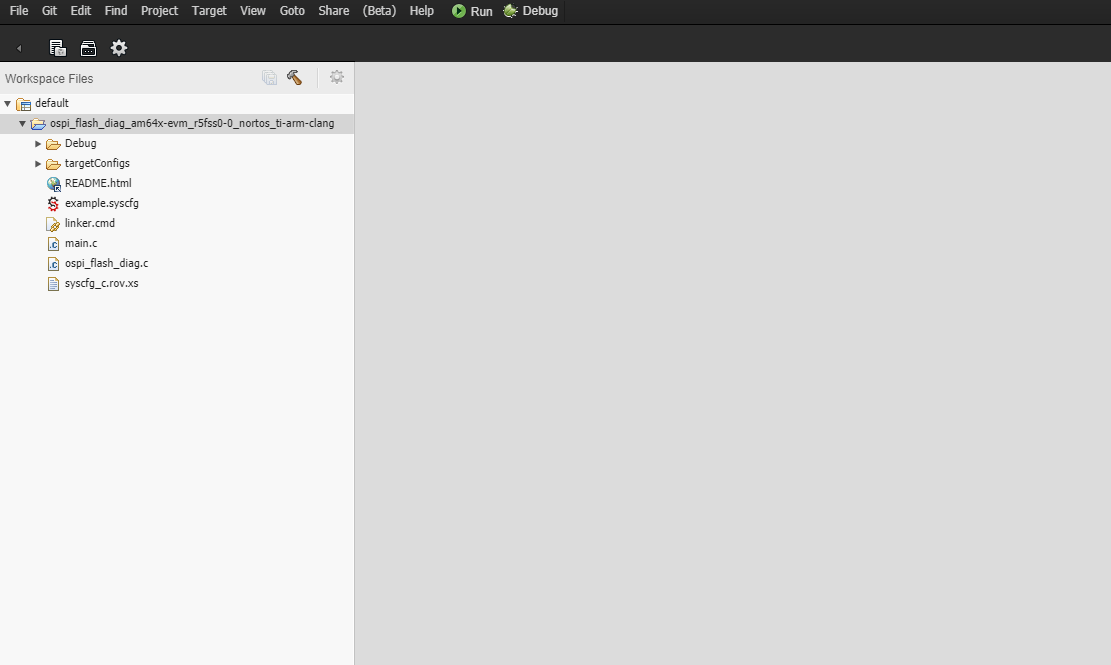
Project imported
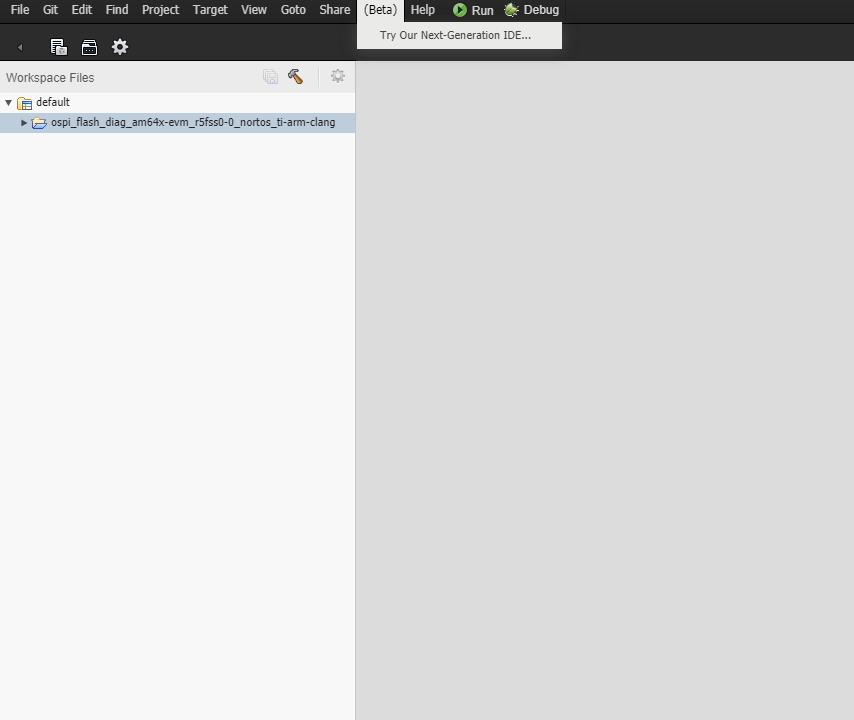
- MCU+SDK examples can be run/debugged only on the next generation beta version of the IDE. So if you're on the official IDE, click on the
(Beta) menu item and say Try Our Next-Generation IDE as shown below.
Switch to Next-Gen IDE
- CCS Cloud will restart to the new IDE. The workspace is preserved, so the imported example will be there as shown below.
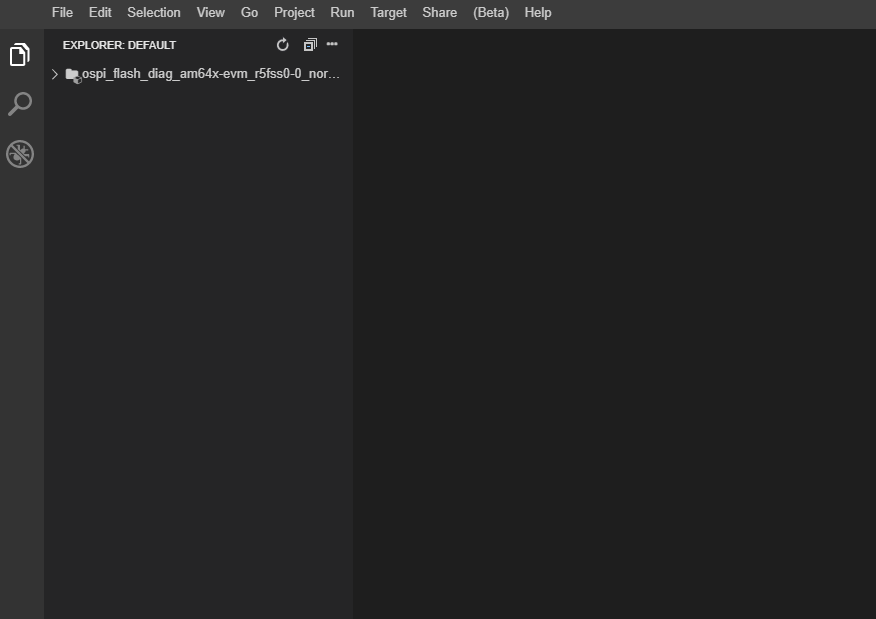
Workspace in new IDE
Building an example project
- Building an example is simple enough, you can either right click on the project and choose
Build Project(s) or goto Project->Build Project(s) in the menu bar as shown below.
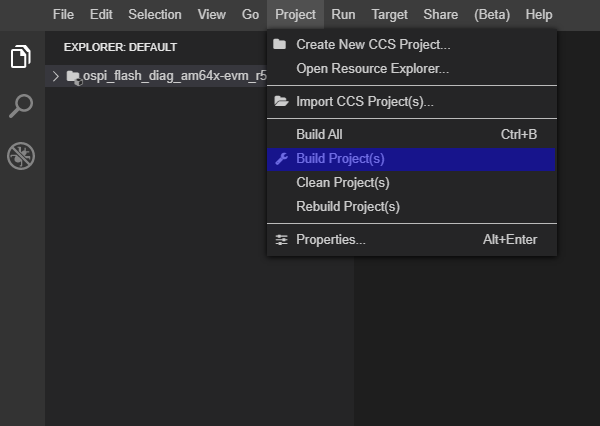
Example Project Build
- Build logs will be shown in the
Output panel in the bottom. Once the example builds successfully, it should say Build Finished
Running an example on the EVM/LaunchPad connected to the PC
- EVM should be connected to the PC properly and an SOC initialization binary should be flashed on to the board. Follow the steps in SOC Initialization using the Binary Flashed in QSPI memory to do this.
- Power on the EVM, this should have ideally started SOC initialization and made the board ready to load application binaries.
- To load the application, go to
Run -> Debug Selected Project in the menu bar. It might take a while to load the debugger for the first time. Once its done, the application should ideally halt in main() as shown below.
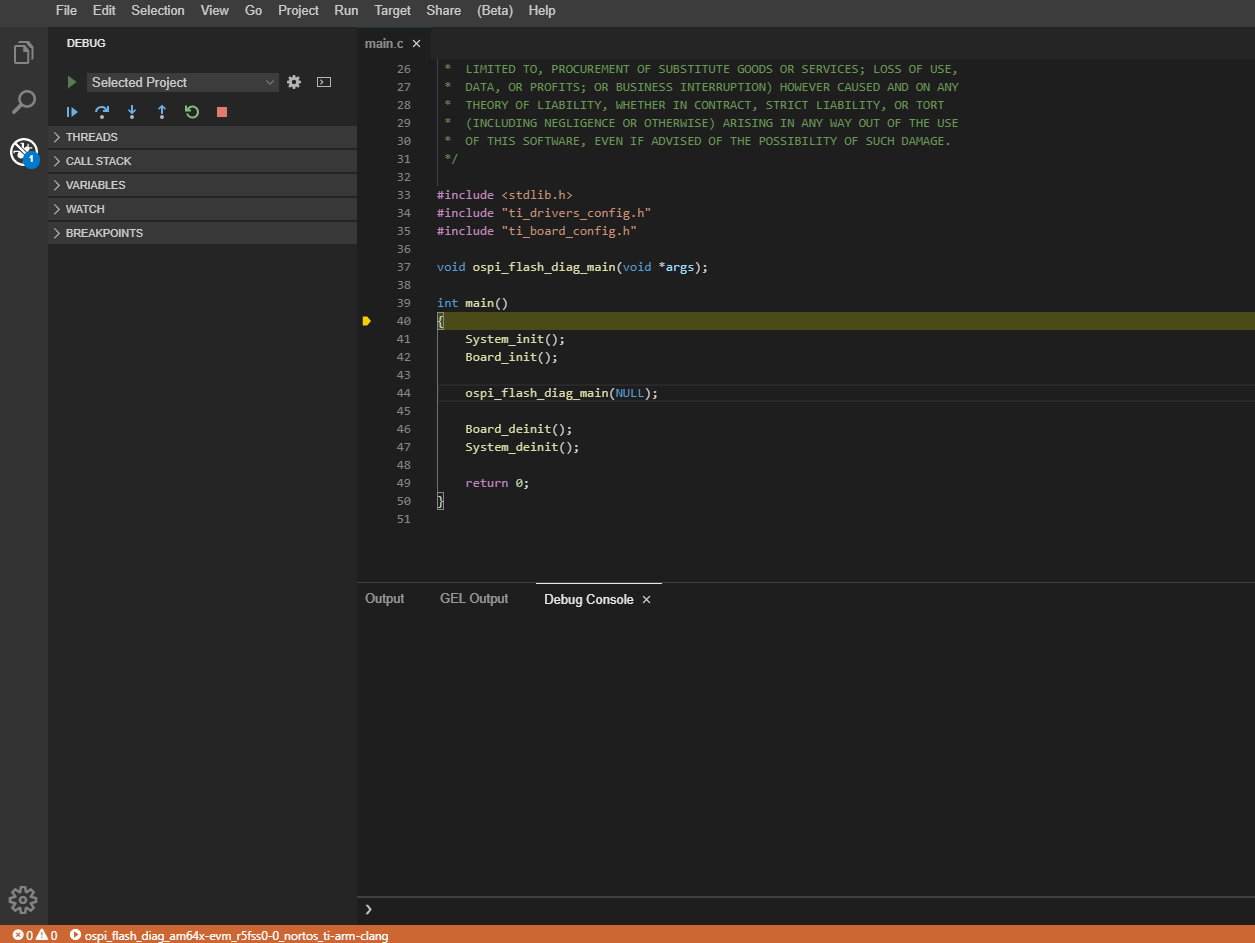
Running Example
- At this point, you can just free-run the example or single step using the various control buttons shown in the debug panel on the left. The buttons available from left to right indicate
Continue, Step Over, Step Into, Step Out or Step Return, Restart and Stop for stopping the debugger. These options are also available from the Run option in the top menu bar.
Debugging the example
- While single stepping through the example, various aspects of the debugger like the Call Stack, Variables, Watch Expressions are available on the debug panel on the left. Most of these are intuitive, still a few are explained below.
- To add a breakpoint, place the cursor on the line where the breakpoint is needed and do
Run -> Toggle Breakpoint in menu bar or press F9 on keyboard as shown below. You can do the same for removing the breakpoint.
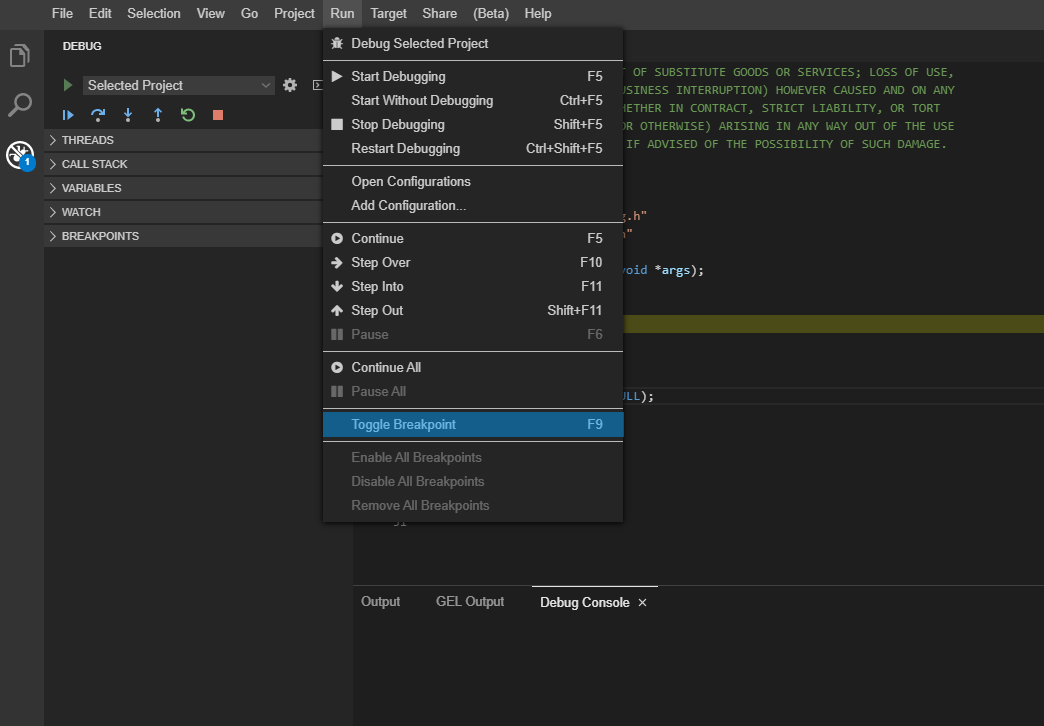
Toggling Breakpoint
- To add a watch expression, click on the
+ sign which appears on the watch drop-down in the debug panel as shown below. Type in the expression in the box that appears and the expression should be added to the Watch drop-down.
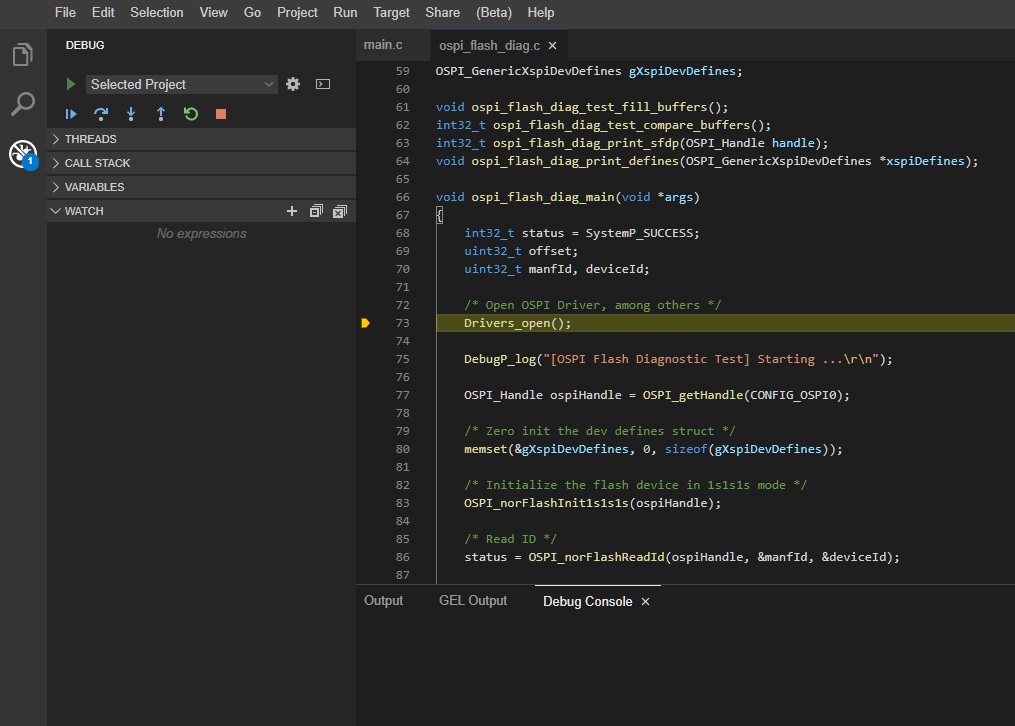
Adding watch expression
Example Logs
- If CCS logging is enabled in the syscfg of the example, any example logs should get printed in the CIO console which will show up in the bottom pane.
- If only UART logging is enabled, you can view these logs by opening the appropriate COM port in the CCS Cloud IDE. To open a COM port goto
Target -> Connect COM port in the menu bar. Give the correct COM port number and the baud rate. Baud rate is usually 115200.


 1.8.20