7. Measuring performance
The performance visualization tool can be used to view all the performance statistics recorded when running the Edge AI C++ demo application. This includes the CPU and HWA loading, DDR bandwidth, Junction Temperatures and FPS obtained.
7.1. Logging device metrics
Each log file contains real-time values for some performance metrics, averaged over a 2s window. The temperature sensor values are sampled in real time, every 2s. The performance visualization tool then parses these log files one by one based on the modification timestamps.
The Edge AI C++ demo will automatically generate log files and store them in the directory
../perf_logs, that is, one level up from where the C++ app is run. For
example, if the app is run from edgeai-gst-apps/apps_cpp, the logs will be
stored in edgeai-gst-apps/perf_logs.
Similarly, there is a binary executable that can be compiled that does the same logging
standalone. The source for this is available under edgeai-gst-apps/scripts/perf_stats/.
The README.md file has simple instructions to build and run this standalone logger binary.
After building it, use following command to print the statistics on the terminal as well
as save them in log files that can be parsed.
/opt/edgeai-gst-apps/scripts/perf_stats/build# ../bin/Release/ti_perfstats -l
7.1.1. Available metrics
Average frames per second (FPS) recorded by the application is displayed by default. Using the checkboxes in the sidebar, one can select which performance metrics to view. There are 14 metrics available to be plotted, as seen from the above image:
CPU Load: Total loading for the A72(mpu1_0), C7x(c7x_0/1/2/3) DSPs
HWA Load: Loading (percentage) for the various available hardware accelerators
DDR Bandwidth: Average read, write and total bandwidth recorded in the previous 2s interval
Junction Temperatures: The live temperatures recorded at various junctions
Task Table: A separate graph for each cpu showing the loading due to various tasks running on it
Heap Table: A separate graph for each cpu showing the heap memory usage statistics
For the first three metrics, there is a choice to view line graphs with a 30s history or bar graphs with only the real-time values. The remaining eleven have real-time bar graphs as the only option.
7.2. Reporting tools
There are simple tools to get the perf numbers like core loadings, DDR bandwidths, junction temperatures, GStreamer element latencies etc.. on the bash terminal.
7.2.1. tiperfoverlay GStreamer plugin
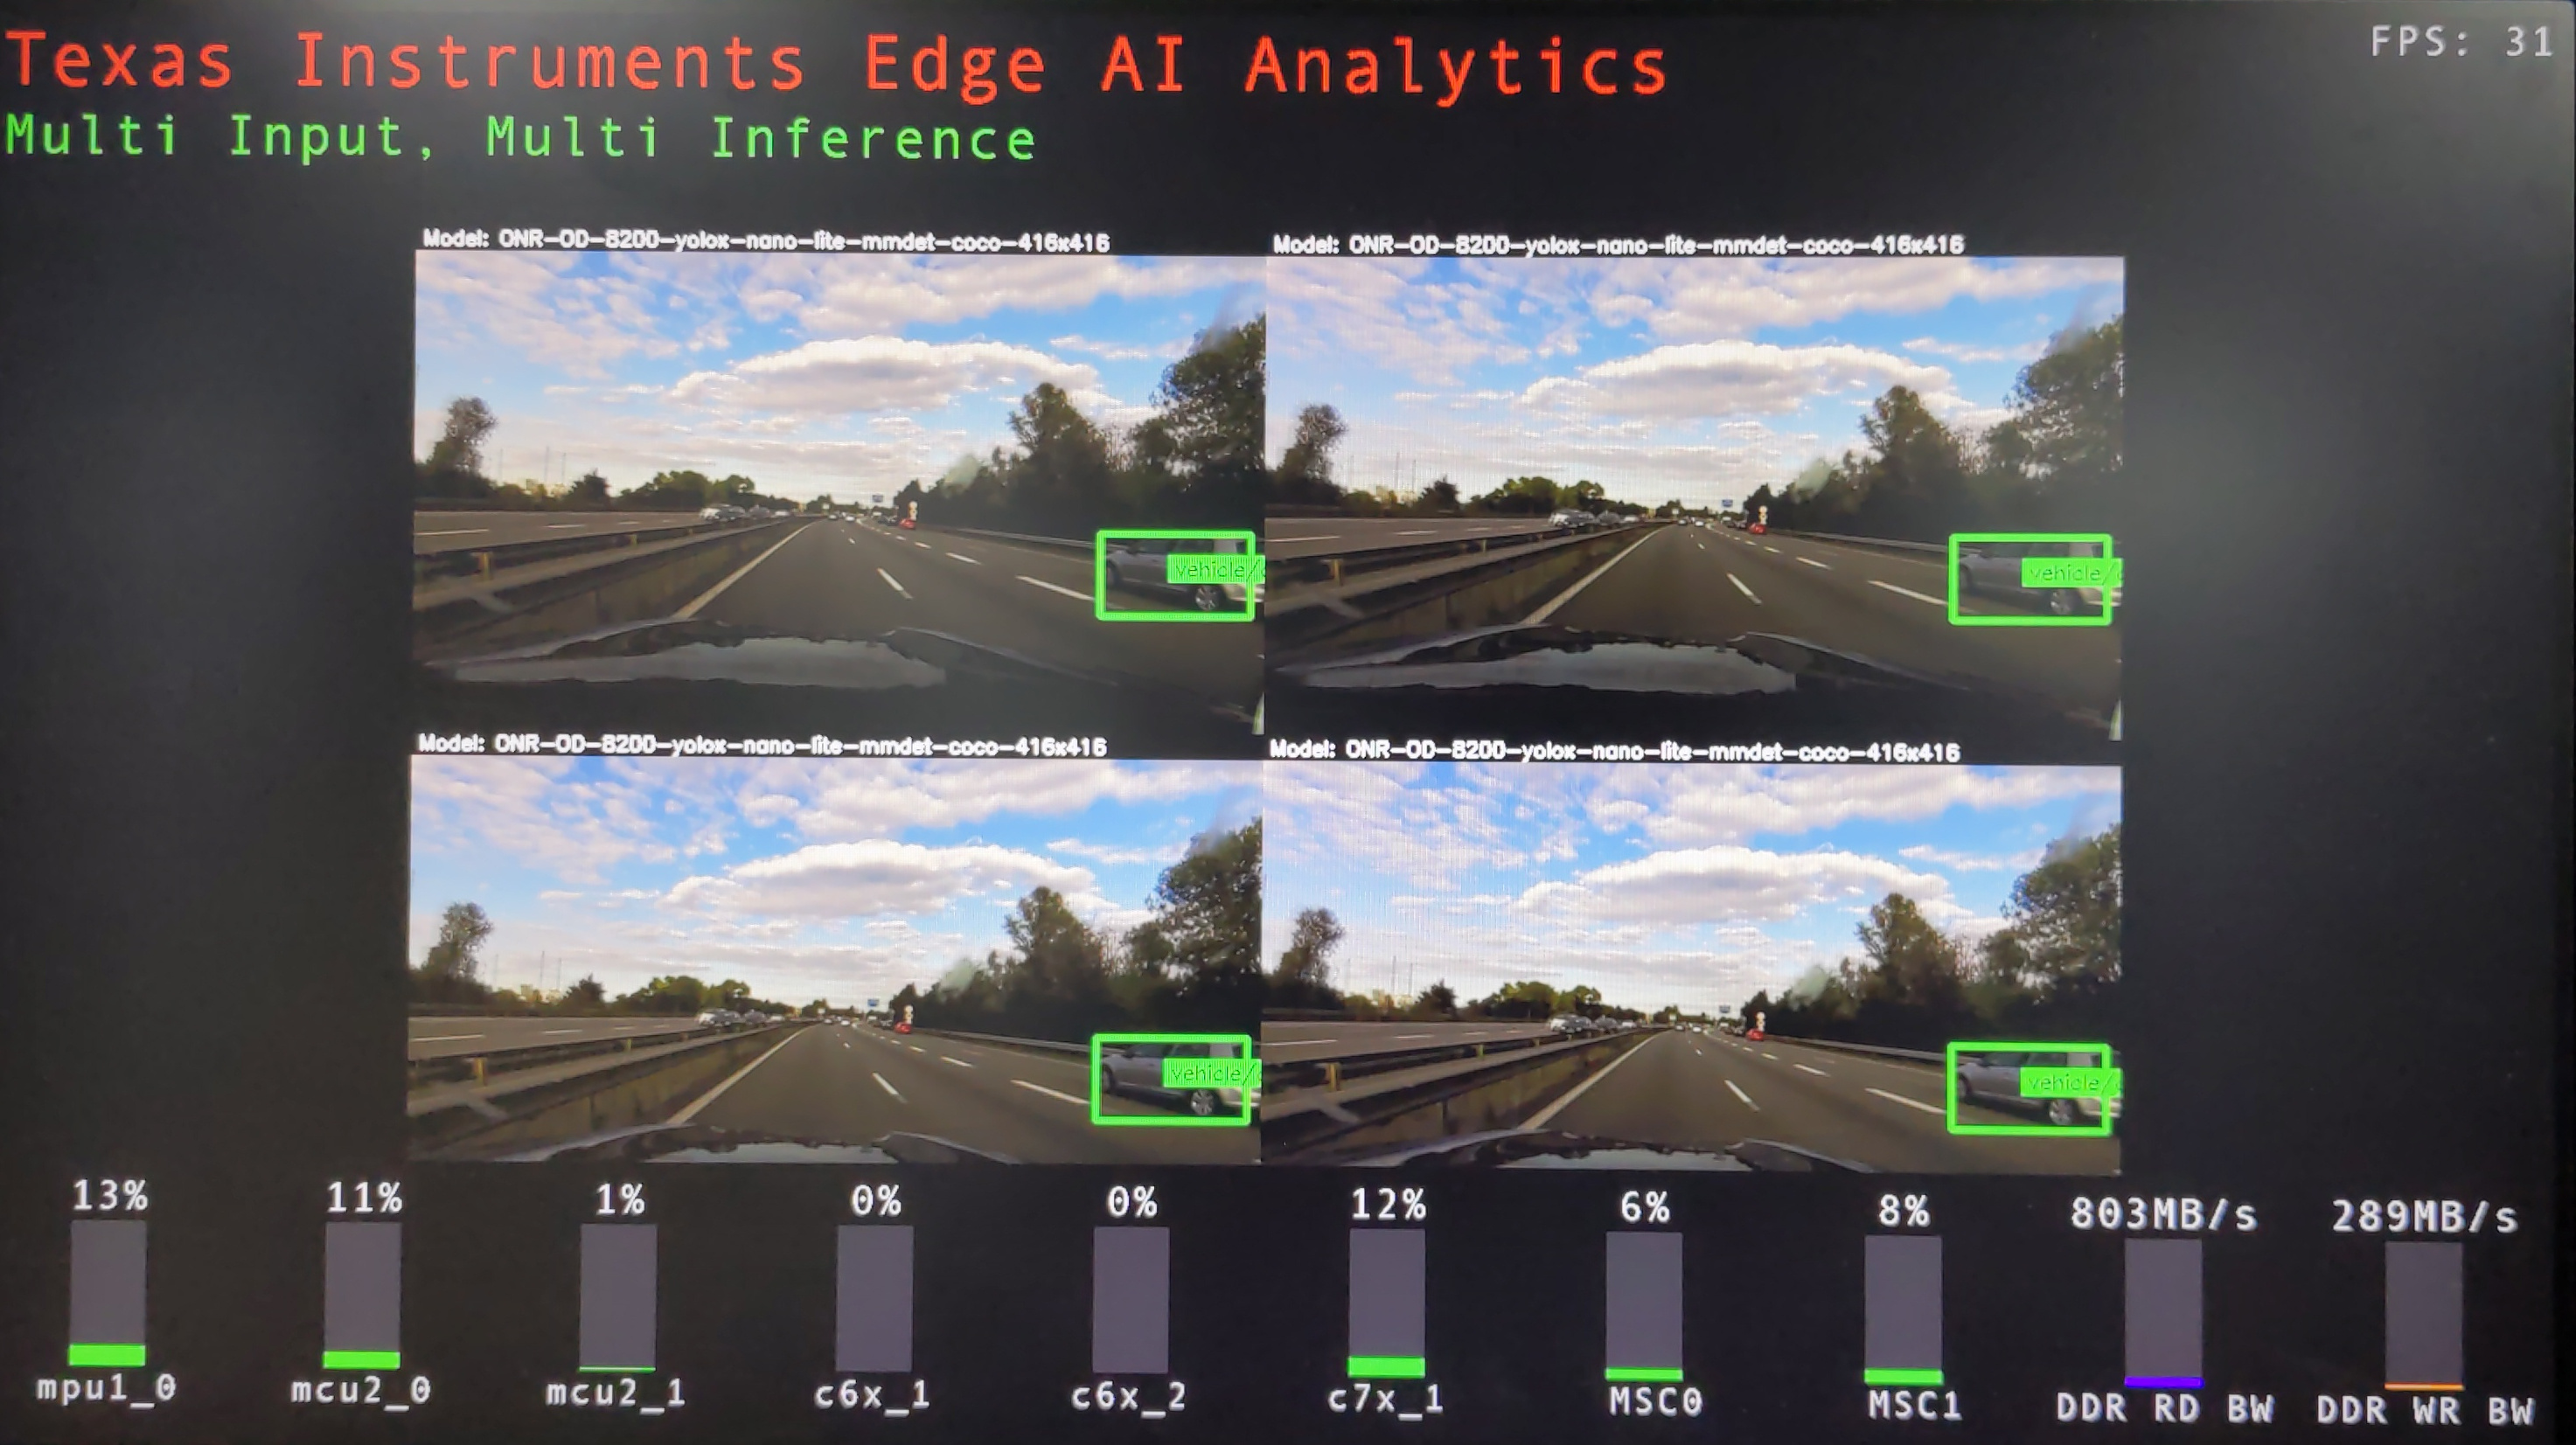
This custom GStreamer plugin allows users to include these non-intrusive elements in the pipeline which overlays the performance information directly on the output image displayed on the screen. The entire processing, is done on native NV12 format which makes it convenient to use along with opTIFlow pipelines. A preview of performance overlay on the display is as shown,
7.2.2. Perf-stats tool
Perf-stats tool is a simple cpp application which prints stats on the terminal
and updates it every second. To use this tool, it needs to be compiled and
run in a parallel ssh terminal along with the application. For detailed
instructions please refer to edgeai-gst-apps/scripts/perf_stats/README.md
below is the sample output of the tool
Summary of CPU load,
====================
CPU: mpu1_0: TOTAL LOAD = 43.81 % ( HWI =  0.74 %, SWI =  0.24 % )
CPU: c7x_1: TOTAL LOAD = 12. 0 % ( HWI =  0. 0 %, SWI =  0. 0 % )

HWA performance statistics,
===========================
HWA:  MSC0: LOAD =  6.93 % ( 45 MP/s )
HWA:  MSC1: LOAD =  6.93 % ( 60 MP/s )

DDR performance statistics,
===========================

DDR: READ BW: AVG =  1455 MB/s, PEAK =  6140 MB/s
DDR: WRITE BW: AVG =   332 MB/s, PEAK =  2138 MB/s
DDR: TOTAL BW: AVG =  1787 MB/s, PEAK =  8278 MB/s
7.2.3. Parse GST Tracers
GStreamer has a feature called tracers to get useful statistics like element wise
latency, cpu loading, etc. as a part of GST debug logs. These logs are very
verbose and very difficult to interpret in the raw format. We provide a simple
python script to parse these logs on the fly and display the stats on the
terminal. For detailed instructions to use the script please refer to
edgeai-gst-apps/scripts/gst_tracers/README.md
below is the sample output of the script
+------------------------------------------------------------------------------+
|element                      latency     out-latancy     out-fps    frames    |
+------------------------------------------------------------------------------+
|h264parse0                   1.72        6580.05         0          3         |
|v4l2h264dec0                 329.79      33.29           30         886       |
|tiovxmemalloc0               0.11        33.29           30         886       |
|capsfilter0                  0.08        33.29           30         886       |
|split_01                     20.37       16.65           60         1770      |
|queue0                       0.31        33.30           30         885       |
|capsfilter1                  0.16        33.30           30         885       |
|queue1                       0.22        33.30           30         885       |
|capsfilter3                  0.07        33.30           30         885       |
|tiovxdlpreproc0              1.63        33.30           30         885       |
|capsfilter2                  0.43        33.30           30         885       |
|tidlinferer0                 7.28        33.30           30         885       |
|post_0                       2.57        33.30           30         885       |
|queue2                       0.18        33.30           30         885       |
|mosaic_0                     51.00       33.30           30         883       |
|capsfilter4                  0.14        33.30           30         883       |
|queue3                       30.80       33.34           30         882       |
|tiperfoverlay0               3.40        33.34           30         882       |
+------------------------------------------------------------------------------+