From RTSC-Pedia
 | [printable version] [offline version] | offline version generated on 04-Aug-2010 21:08 UTC |  |
XDCscript Debugging
Overview of script debugging techniques
Contents |
Script debugging
This topic summarizes a variety of script debugging techniques. This content is aimed at package consumers. For package producers who want to enable trace support in their packages, and for more elaborate filtering of trace output, please see Trace Support.
"printf" Debugging
It is possible to easily print scaler and array values via the print() method. For example,
|
|
Using JavaScript's reflection capabilities, it is also possible to display objects with named properties.
|
|
The xdc.bld.Utils capsule provides a utility function to recursively display the value of an object.
|
|
Trace Debugging
Many of the modules and capsules included with XDCtools have embedded "trace" statements that may be optionally enabled. These trace statements are printf-like statements that output informational messages about what a tool is currently doing.
This section outlines how to enable these statements and shows examples of useful traces. For more elaborate filtering of trace output, please see Trace Support.
Tracing everything
Tracing everything. The easiest way to enable all trace statements is to set the environment variable XDC_TRACE_ENABLE to all.
| | xdc XDC_TRACE_ENABLE="all" |
Normally this environment variable names specific capsules containing traces statements that should be enabled. But in this case, all is a special token that enables trace for all capsules.
Tracing package loads
Tracing package loads. To enable tracing of package loads, set the XDC_TRACE_ENABLE environment variable as follows
|
|
Tracing the configuration process
Tracing the configuration process. To enable tracing during configuration, set the XDC_TRACE_ENABLE environment variable as follows
|
|
Tracing more than one thing
Tracing more than one thing. It's also possible to enable more than one trace at a time. For example, to trace the configuration process and package loads at the same time, set the XDC_TRACE_ENABLE environment variable as follows
|
|
The use of quotes (") in the definition of XDC_TRACE_ENABLE is important on Unix systems because ';' is used to separate commands. Similarly, it is important to not use quotes on Windows systems because the quotes will be treated as part of the file name to be traced.
Tracing the XDCspec file re-compilation
Tracing the XDCspec file re-compilation. If XDC_TRACE_ENABLE is defined to include "xdc/services/spec", messages indicating the re-compilation of spec files it occurring. Suppose, for example, you set XDC_TRACE_ENABLE to the "xdc/services/spec".
|
|
Notes similar to the following will be displayed.
Note: BrowserSession compiling ...; could not find .ccs file
- This message indicates that you are using a version of the XDCtools whose IDL processor is not compatible with the IDL processor used to originally build the package whose base directory is named in the message. This message is informative only; the only problem with recompiling the .xdc files is that the tools will take longer to complete.
Enabling trace from within scripts
Enabling trace from within scripts. In addition to enabling trace on the command line as shown above, it is also possible to enable trace from within a script
| | xdc.traceEnable("xdc/xdc.tci"); |
For more information about using tracing within scripts see xdc.traceEnable reference documentation. For information about adding tracing to your modules see the XDCscript reference documentation of the $trace function.
Single-step Debugging
The underlying JavaScript engine for XDCscript is Rhino; a Mozilla open source implementation written entirely in Java. This engine is supported by a GUI debugger that allows one to single step debug any script.
This section shows how to enable this debugger for a variety of scripts in the RTSC environment.
xs Scripts
You can run the Rhino GUI debugger directly from the xs command line via the -g option.
| | xs -g -f myscript.xs |
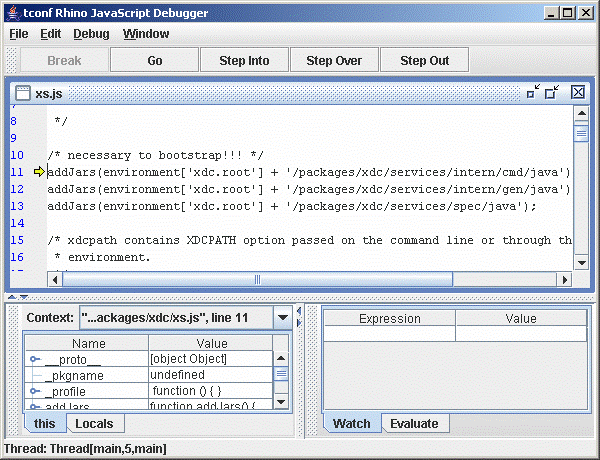
When the debugger window appears, it will look something like the following figure.
You will notice that you are stopped in a file that is not related to your script. The debugger initially stops in xs.js, a top-level script that parses the xs command-line arguments and calls your script. To single step your script you should:
- open the Debug menu and un-select "Break on Function Enter"
- single step-over through the xs.js file until your script is about to be loaded
- single step-into your script
 It's currently not possible to set a breakpoint in a file that has not already been loaded. You must single step until the file of interest is loaded and only at that point can you set breakpoints. Once a file has been loaded you can set a breakpoint as follows.
- open the Window menu, locate your script file (you may need to select the "More Windows ..." item), and select it
- set a breakpoint in your script by clicking in the left-most column
- click the Go button
Build Scripts
You can run the Rhino GUI debugger directly from the xdc command line by adding -g to the XDCOPTIONS settings.
| | xdc XDCOPTIONS=-g .make |
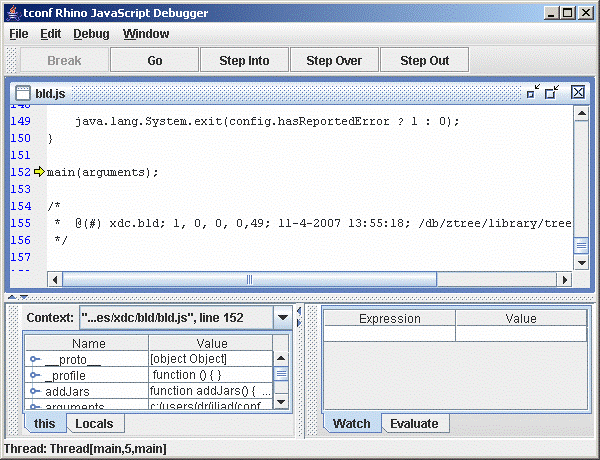
When the debugger window appears, it will look something like the following figure.
You will notice that you are stopped in a file that is not related to your script. The debugger initially stops in bld.js, a top-level script that runs both the config.bld and package.bld scripts. To single step your script you should:
- open the Debug menu and un-select "Break on Function Enter"
- single step through the bld.js file until your script is about to be loaded
- single step-into your script
 Alternatively, you can set a breakpoint in the utils.tci file at the utils.load() function and repeatedly click the Go button watching for your package.bld (or config.bld) script to be loaded.
Config Scripts
NOTE: to be written
 | [printable version] [offline version] | offline version generated on 04-Aug-2010 21:08 UTC |  |


