
Overview
This workshop provides an introduction to the Code Composer Studio integrated development environment. It will cover how to get started using the environment on a TM4 LaunchPad.
Requirements
Software:
- Code Composer Studio v7 or greater
- With all TM4 components installed
Hardware:
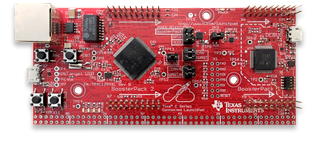
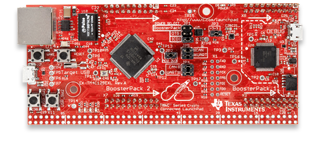
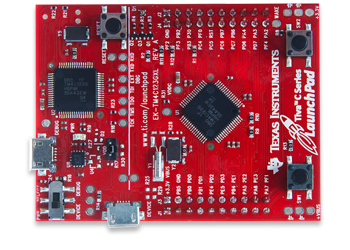
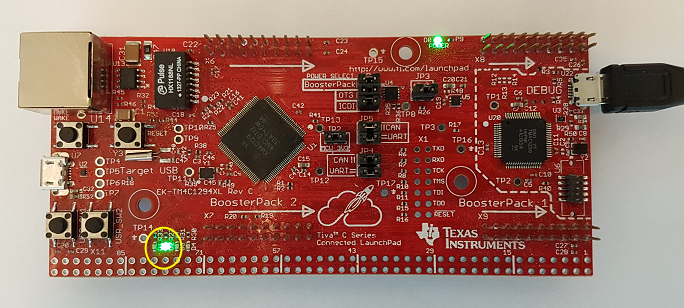
Connect the LaunchPad to the Computer via micro-USB cable
Note
These materials are designed to work with a number of different LaunchPads. Thus in the instructions when you see a reference to <LaunchPad> replace this with the specific LaunchPad that you are using.
LAB 1 - Getting Started
Key Objectives
- Import and build the blinky example program
- Start a debug session and load/flash the program to the device
- Run the program
Tools and Concepts Covered
- Eclipse Concepts (Workspace, Workbench, Perspectives, Views, Projects)
- Resource Explorer
- Importing/Building/Running an example project/program
Launch Code Composer Studio and Open Resource Explorer
-
Double click on the Code Composer Studio desktop icon
-
Specify a location for your workspace. This is where your projects will be located. Please ensure not to include any special characters in the workspace path such as %$&!^.
-
Select Browse Examples on the Getting Started page or go to the View menu and select Resource Explorer.
Resource Explorer: Examples
Displays all example projects available under the Resource Explorer. This includes all available content on the remote TI server, in addition to any content you may have installed locally
-
Select your LaunchPad in the Select a Device or Board filter box
-
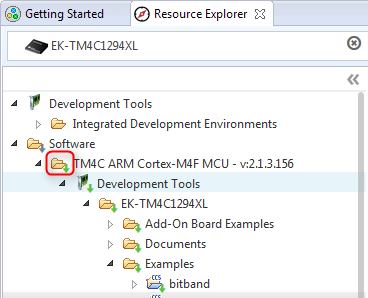
Select the blinky example under Software -> TM4C ARM Cortex-M4F MCU -> Development Tools ->
-
Click the Install on Desktop icon and select the option to Make Available Offline. This will make a copy of the TM4C ARM Cortex-M4F software package on your local machine. This is required to import any examples into your local Code Composer Studio environment
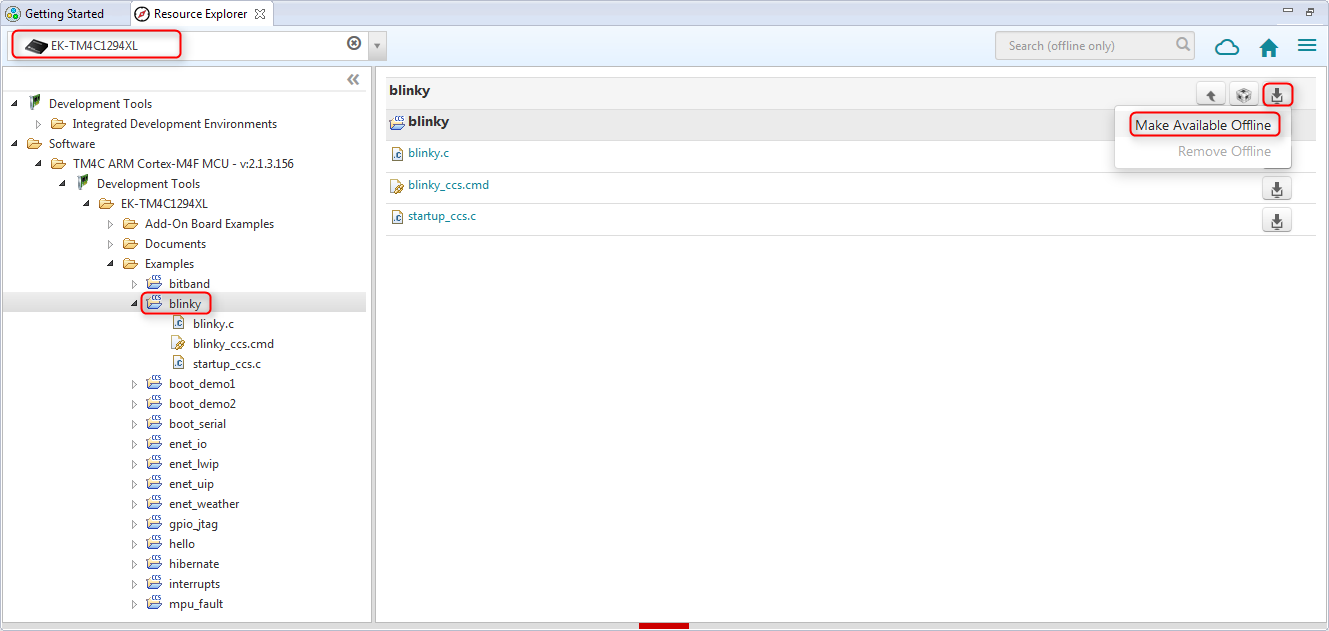
A prompt will appear, asking for confirmation. After agreeing to the prompt, the TM4C ARM Cortex-M4F software package will start downloading. Once the download and installation to the local environment is completed, TM4C ARM Cortex-M4F will appear in the Resource Explorer, highlighted with green arrows, indicating that it is available locally (offline).
-
Press the Import to IDE icon for the blinky example and agree to the license agreement.
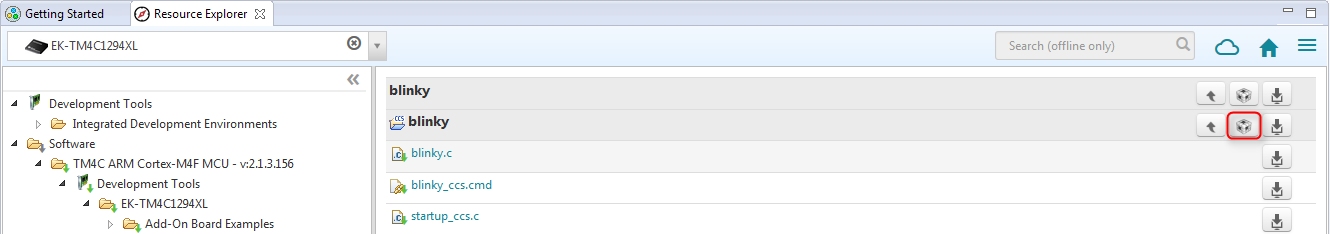
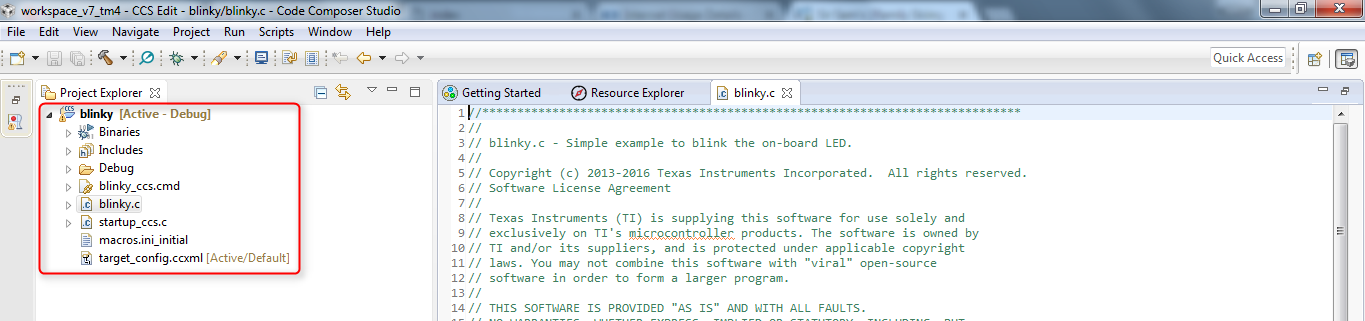
This will import both the blinky example project into your workspace. The project will appear in the Project Explorer if the import is successful
-
From the Run menu select Debug to build/load/Run the project. Alternatively you can click the bug button on the toolbar.
Several actions are done automatically
- Prompt to save source files (if necessary)
- Build the project (incrementally)
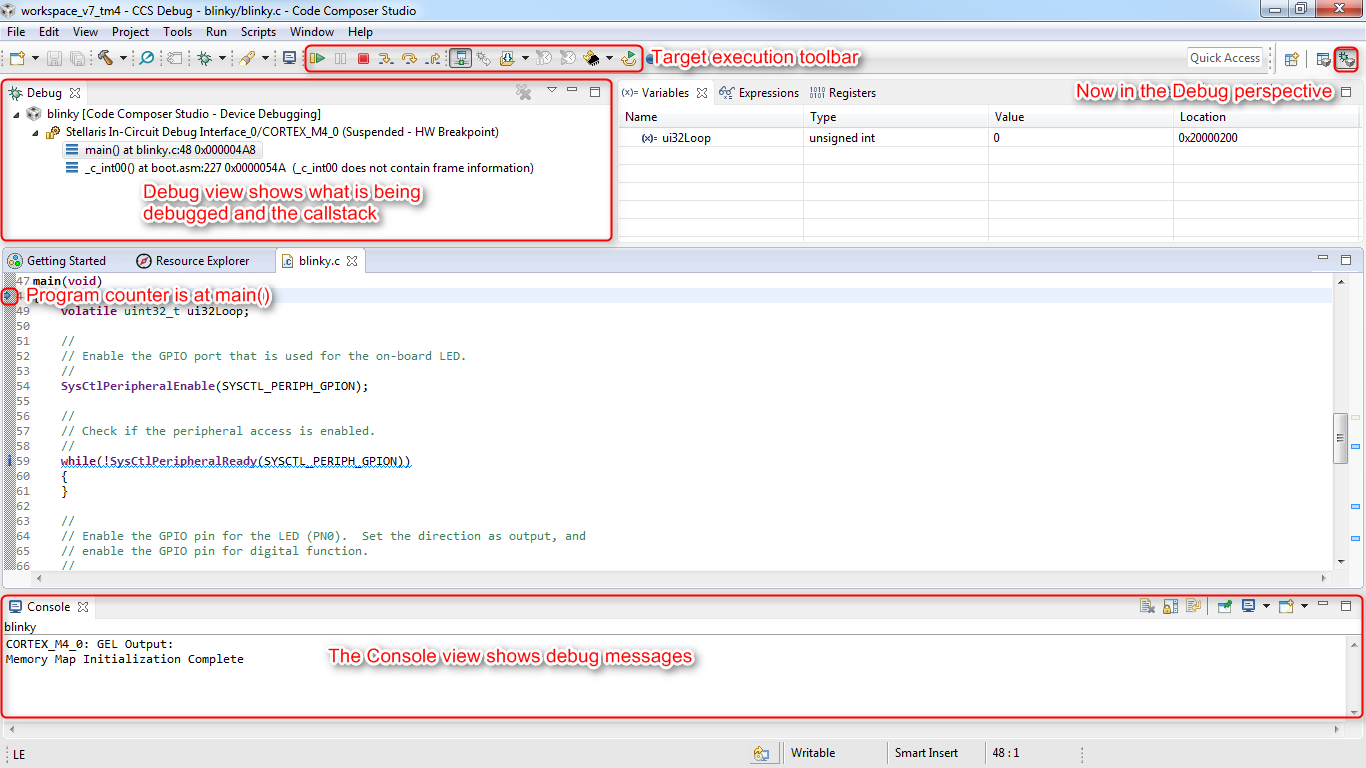
- Start the debugger (Code Composer Studio will switch to the CCS Debug perspective)
- Connect to the target
- Load (flash) the program on the target
- Run to main()
If you don’t want all of those actions performed? You can configure Code Composer Studio to skip some steps (Debugger Options)
The build Console view will appear along the bottom with build messages as the project builds.
Note
When you connect to your LaunchPad for the first time it may prompt you to update the firmware. This step is recommended.
-
Click the Resume button on the toolbar to run the program and an LED will blink on the LaunchPad. The same command is also available from the Run menu.
-
Click the Suspend button on the toolbar to halt the program.
Summary
In this lab we completed the following:
- Imported the blinky project from TM4C ARM Cortex-M4F software package via the Resource Explorer
- Built and ran the blinky example
LAB 2 - Basic Debug Concepts
Key Objectives
- Learn the basics of debugging with the blinky example
- Basic Profiling
Tools and Concepts Covered
- Basic Debug Concepts
- Breakpoints/Watchpoints
- Event Counters
- Real-time Memory Access
Breakpoints
Both software breakpoints and hardware breakpoints are available for use. A hardware breakpoint uses debug resources on the device as compared to a software breakpoint which is typically an opcode replacement.
- If the program is still running click the Suspend button to halt it.
- Open the Breakpoints view via View -> Breakpoints
-
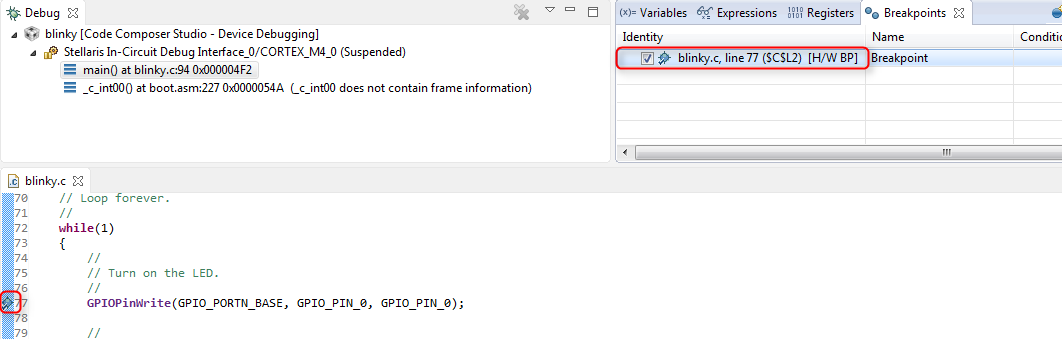
Double-click in the left selection margin of the editor beside line 77 in blinky.c. This will set a hardware breakpoint. An icon will appear in the selection margin indicating the location of the breakpoint. It will also be listed in the breakpoints view. Different icons are used for hardware and software breakpoints. As the location where we will be setting the breakpoint is in flash memory a hardware breakpoint will automatically be used.
-
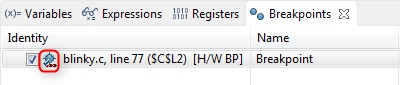
Click the Resume button. The program will halt at the breakpoint. Note that the breakpoint that triggered the halt will be indicated in the Breakpoints view by arrows at the bottom of the icon.
-
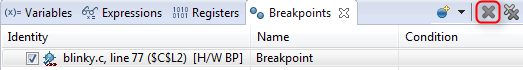
Remove the breakpoint by selecting the breakpoint in the Breakpoints view and clicking the Remove button.
Watchpoints
A watchpoint is a type of breakpoint that monitors activity on a memory address or range of addresses.
-
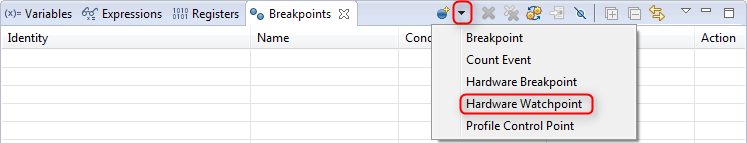
In the breakpoints view click the down arrow beside the new breakpoint button and select Hardware Watchpoint.
-
Enter &GPIO_PORTN_GPIO_DATA as the location. Memory should be set to Write. Click OK.
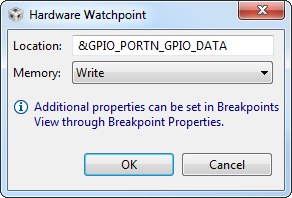
A hardware breakpoint will be set on the GPIO_PORTN_GPIO_DATA register location which will trigger a halt when it is written to.
-
Click the Resume button to run the target. The program will halt when the LED is toggled as the memory mapped register is written to. Continue clicking the Resume button to observe this.
-
Remove the watchpoint by selecting the watchpoint in the Breakpoints view and clicking the Remove button.
Counters
-
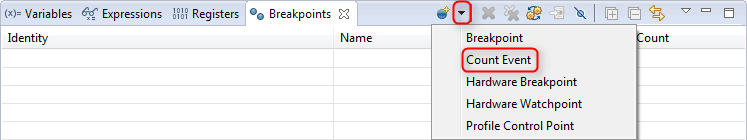
In the Breakpoints view click the down arrow beside the new breakpoint button and select Count Event.
-
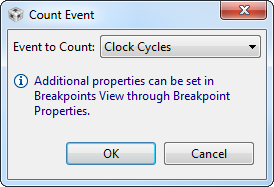
Set the event counter to count Clock Cycles and press OK
-
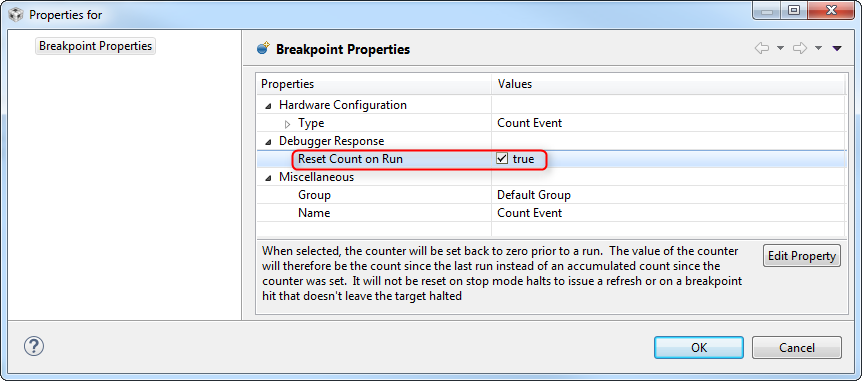
Right-click (control-click on Mac) on the event counter in the Breakpoints view and select Breakpoint Properties in the context menu.
-
Enable the Reset Count on Run option in the properties dialog and click OK. This will reset the counter each time the target is executed.
-
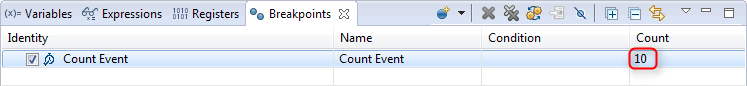
The program counter should currently be at a call to GPIOPinWrite(). Click on the Step Over (F6) button to step over the function. Look at the value of the counter in the Breakpoints view. This will show how many cycles it took to execute the function (~10 cycles).
Similarly you could set breakpoints and use the counter to count the cycles between breakpoints.
-
Remove the counter by selecting the counter in the Breakpoints view and clicking the Remove button.
Continuous Refresh and Real-Time Memory Access
It is possible to read memory will the device is running without interrupting the execution of the program.
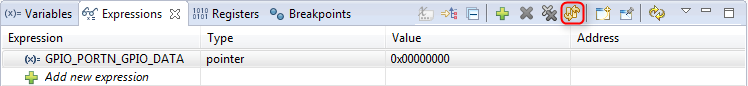
- In the Expressions view click on "Add new expression" and enter GPIO_PORTN_GPIO_DATA.
-
Click the Continuous Refresh button to enable continuous refreshing.
-
Click the Resume button to run the program. Notice how the value for the register is changing in the Expressions view while the target is running.
Disassembly View
-
Click the Suspend button to halt the program.
-
Click the Restart button to restart the program at the beginning of main().
-
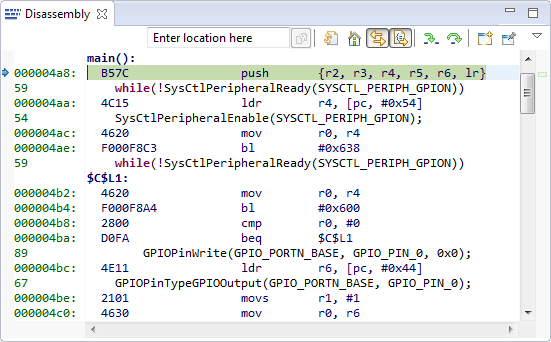
Open the Disassembly view by going to View -> Disassembly. By default it will show you the disassembly of the current location in the code. The location of the Program Counter is indicated with a small blue arrow. You can enter in an address or symbol in the location box to change the address that disassembly starts at.
-
Click the Show Source button in the Dissassembly view to toggle interleaving of source code with the assembly code.
Other Views
Several other views are available under the View menu. Experiment with the various views.
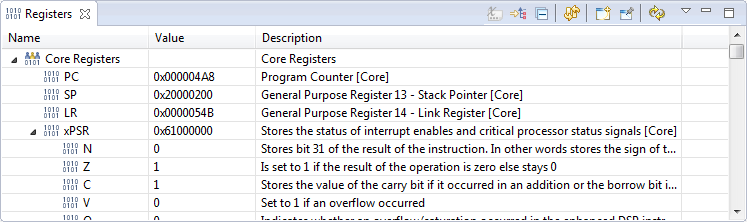
Registers view
The Registers view is used to display and edit the values of core and memory mapped (peripheral) registers.
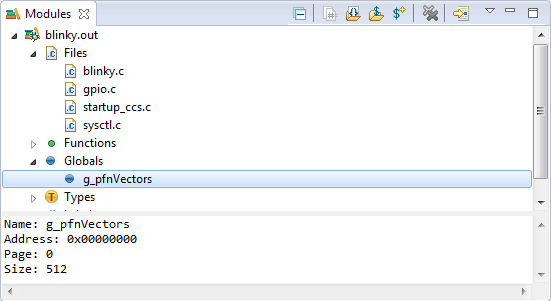
Modules view
The Modules view enables browsing of loaded debug symbols. This can be especially useful if projects are not being used as it provides file and function listings.
Summary
In this lab we completed the following:
- Covered the basics of Debugging
- Learned how to use breakpoints and watchpoints
- Learned how to count events (cycles)
- Became familiar with the Disassembly view
- Real-time memory accesses with CCS
- How to enable Continuous Refresh in a view