
Overview
This workshop provides an introduction to the Code Composer Studio integrated development environment. It will cover how to get started using the environment on a MSP432 LaunchPad.
Requirements
Software:
- Code Composer Studio v7 or greater
- With all MSP432 low power + performance MCUs components installed
Hardware:
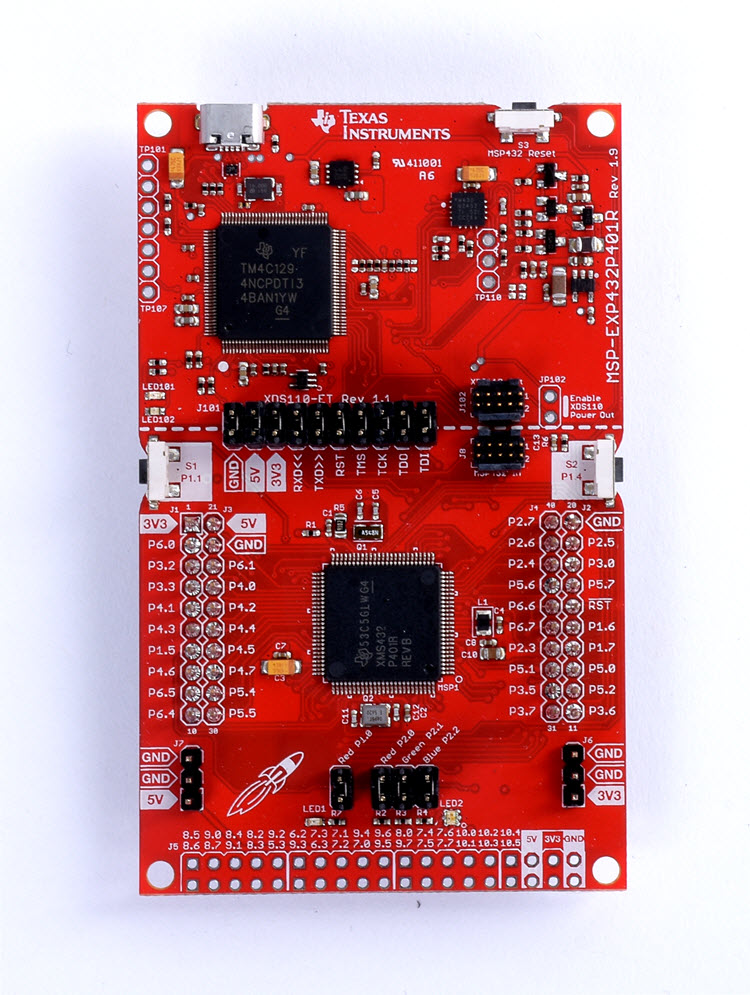
Connect the LaunchPad to the Computer via micro-USB cable
LAB 1 - Getting Started
Key Objectives
- Import and build the gpiointerrupt example program
- Start a debug session and load/flash the program to the target
- Run the program
Tools and Concepts Covered
- Eclipse Concepts (Workspace, Workbench, Perspectives, Views, Projects)
- Resource Explorer
- Importing/Building/Running an example project/program
Launch Code Composer Studio (CCS) and Open Resource Explorer
-
Launch CCS with the Code Composer Studio desktop icon
-
Specify a path for the workspace location when prompted. Use a path that does NOT use spaces or any non-alphanumeric characters, with the exception of an underscore character.
-
Select Browse Examples in the Getting Started page
Resource Explorer: Examples
Displays all example projects available under the Resource Explorer. This includes all available content on the remote TI server, in addition to any content you may have installed locally
-
Select the MSP-EXP432P401R - Rev 2.x (Red) in the Development Tools / Devices filter field
This will filter all the content to just those that apply to the MSP-EXP432P401R - Rev 2.x (Red)
-
Select the msp432p401x_1 example under Software -> SimpleLink MSP432 SDK -> Examples -> Development Tools -> MSP-EXP432P401R - Rev 2.x (Red) -> TI Drivers -> gpiointerrupt -> TI-RTOS -> CCS Compiler -> gpiointerrupt
-
Press the Install on Desktop icon and select the option to Make Available Offline. This will make a copy of the SimpleLink MSP432 SDK package on your local machine. This is required to import any examples into your local CCS environment
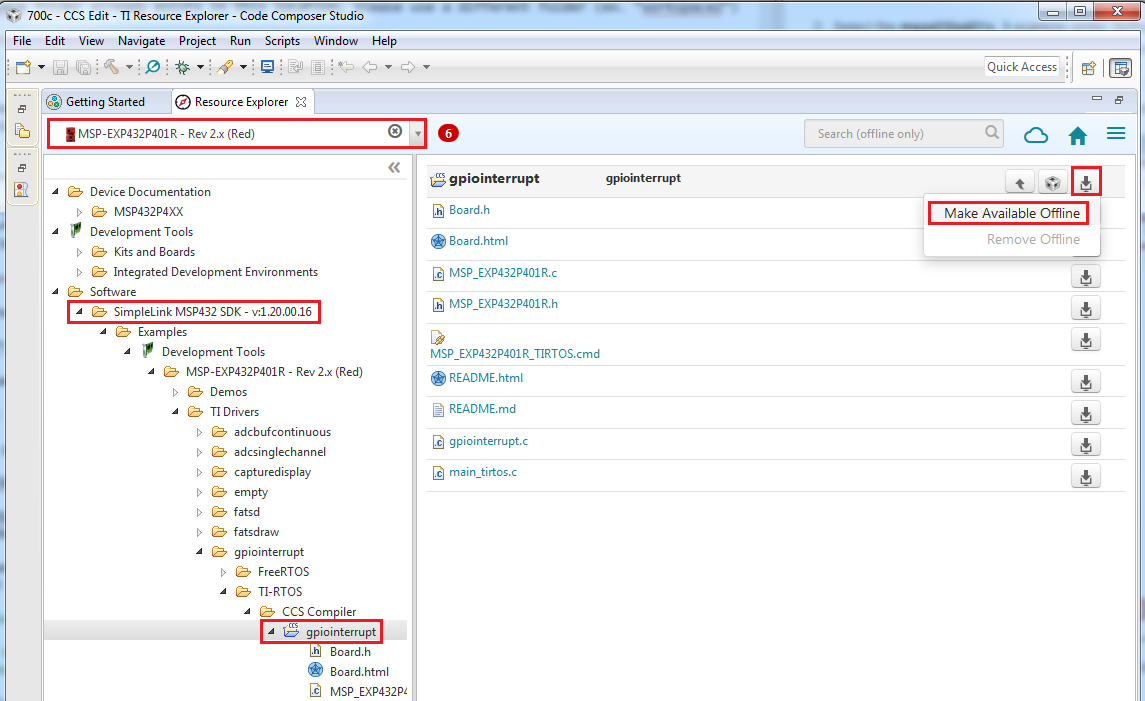
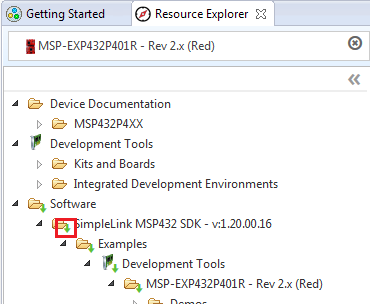
A prompt will appear, asking for confirmation. After agreeing to the prompt, the SimpleLink MSP432 SDK will start downloading. Once the download and installation to the local environment is completed, the SimpleLink MSP432 SDK will appear in the Resource Explorer, highlighted with green arrows, indicating that it is available locally (offline).
-
Press the Install to IDE icon for the gpiointerrupt example
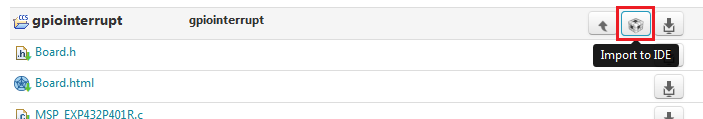
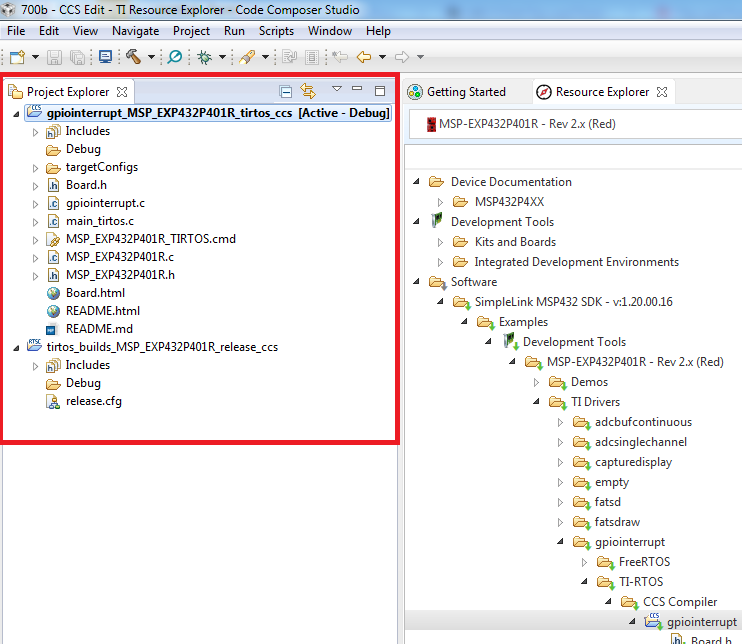
This will import both the gpiointerrupt example and the dependent configuration TI-RTOS project tirtos_builds. The projects will appear in the Project Explorer if the import is successful
-
Make sure the gpiointerrupt project is in context (in bold) and select Run -> Debug to build/load/Run the project
Several actions are done automatically
- Prompt to save source files
- Build the project (incrementally)
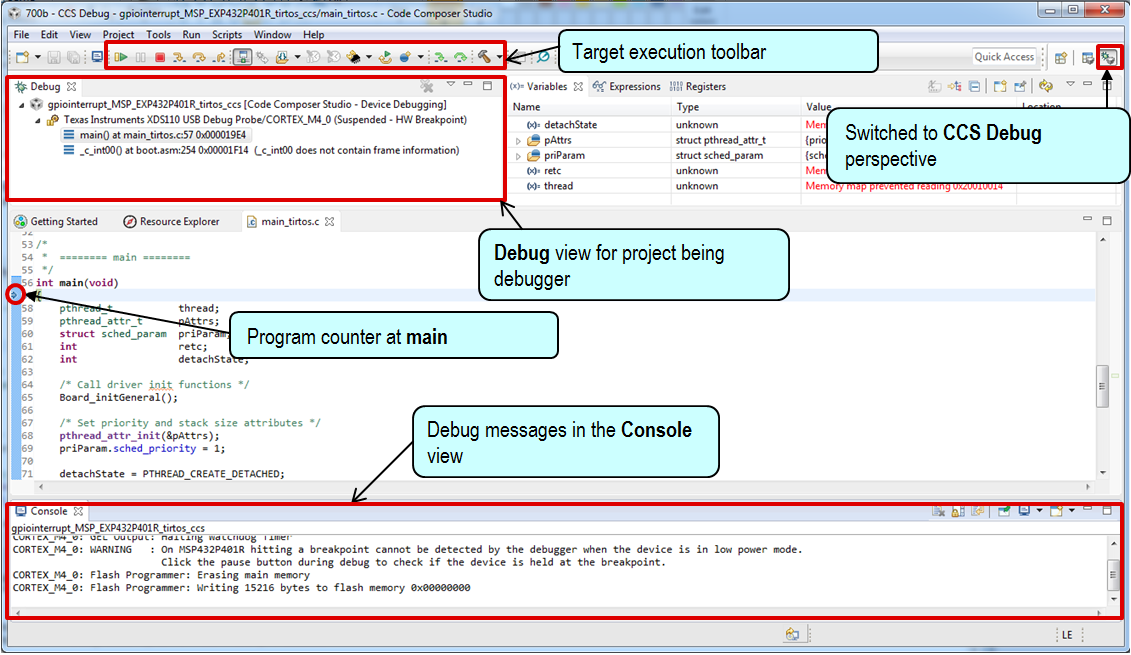
- Start the debugger (CCS will switch to the CCS Debug perspective)
- Connect CCS to the target
- Load (flash) the program on the target
- Run to main
Don’t want it to do all of the above at once? You can configure it to skip some steps (Debugger Options)
The build Console view will appear along the bottom with build messages as the project builds
Note
When you connect to your LaunchPad for the first time it may prompt you to update the firmware. This step is recommended
-
Select Run -> Resume to run the program
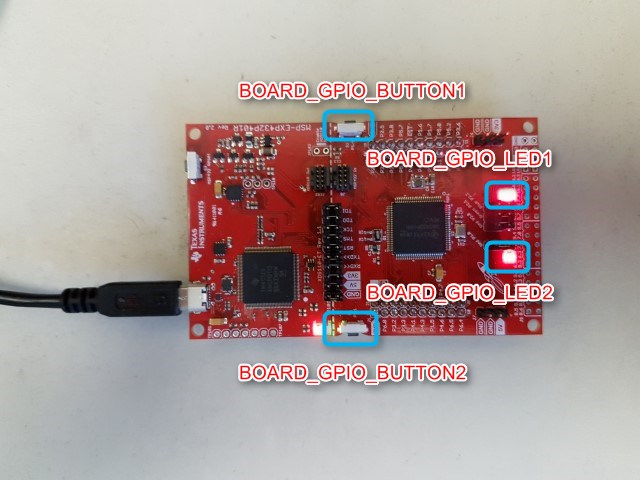
Program will run. Pressing the side buttons (BOARD_GPIO_BUTTON0 and BOARD_GPIO_BUTTON1) will toggle the respective LEDs (BOARD_GPIO_\LED0 and BOARD_GPIO_LED1).
Leave the target running for the next lab
Summary
In this lab we completed the following:
- Imported the gpiointerrupt project from SimpleLink MSP432 SDK via the Resource Explorer
- Built and ran the gpiointerrupt example
LAB 2 - Basic Debug Concepts
Key Objectives
- Learn the basics of debugging with the gpioButtonFxn0 example
- Basic Profiling
Tools and Concepts Covered
- Basic Debug Concepts
- Breakpoints/Watchpoints
- Event Counters
- Real-time Memory Access
Breakpoints
Hardware vs Software Breakpoints
Both software breakpoints and hardware breakpoints are available for use. A hardware breakpoint uses debug resources on the device as compared to a software breakpoint which is typically an opcode replacement. A hardware breakpoint is required when setting a breakpoint in Flash, while a software breakpoint can be used in RAM. While the number of software breakpoints available is practically limitless, the number of hardware breakpoints is typically small in number and varies per device
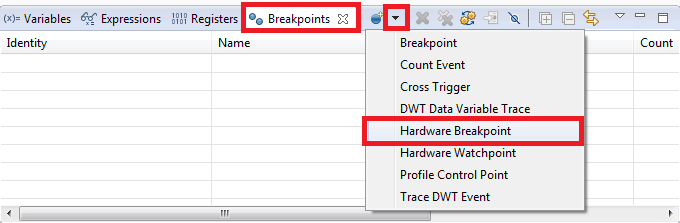
- Open the Breakpoints view via View -> Breakpoints
-
Select Hardware Breakpoint in the dropdown menu list for New Breakpoints
-
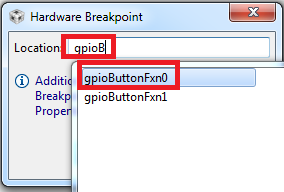
Start typing gpioButtonFxn0 in the Location field in the Hardware Breakpoint dialog. Note how a list of available symbols will appear, and get filtered, as the symbol name is typed. Select gpioButtonFxn0 in the filted list. and select OK.
-
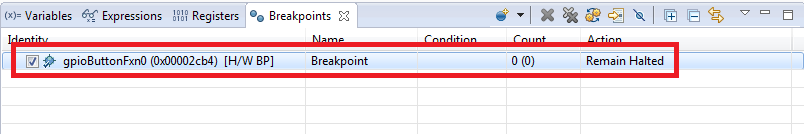
A hardware breakpoint will be set at the start of the gpioButtonFxn0 function. This function is called when BOARD_GPIO_BUTTON0 is pressed.
-
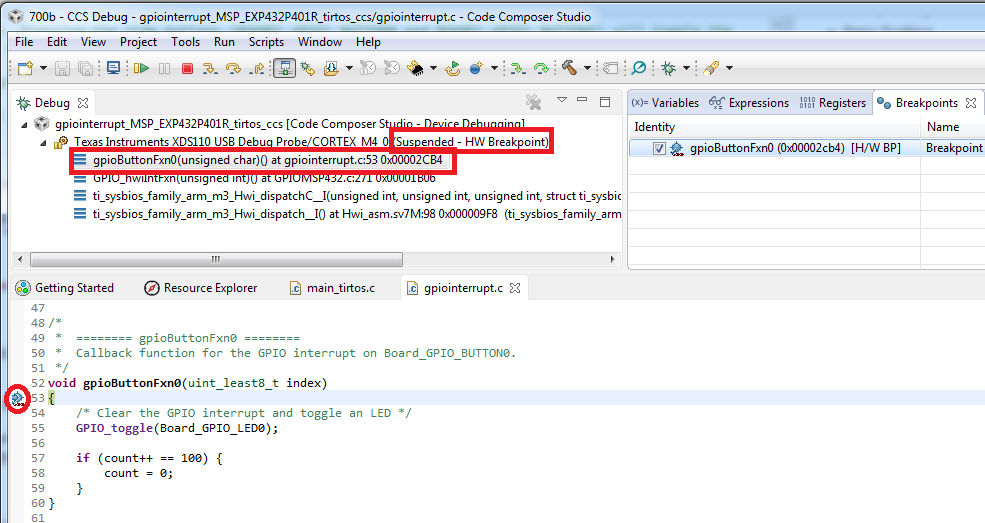
Press BOARD_GPIO_BUTTON0 on the LaunchPad. The target will halt at the start of gpioButtonFxn0 (line 53 of gpiointerrupt.c)
Resume execution of the target. Press BOARD_GPIO_BUTTON1 and then BOARD_GPIO_BUTTON0. The target will halt only when BOARD_GPIO_BUTTON0 is pressed.
Counter
-
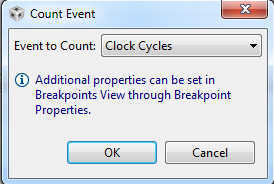
Go to the Breakpoints view and select Count Event in the dropdown menu list for New Breakpoints
-
Set the event counter to count Clock Cycles and press OK
-
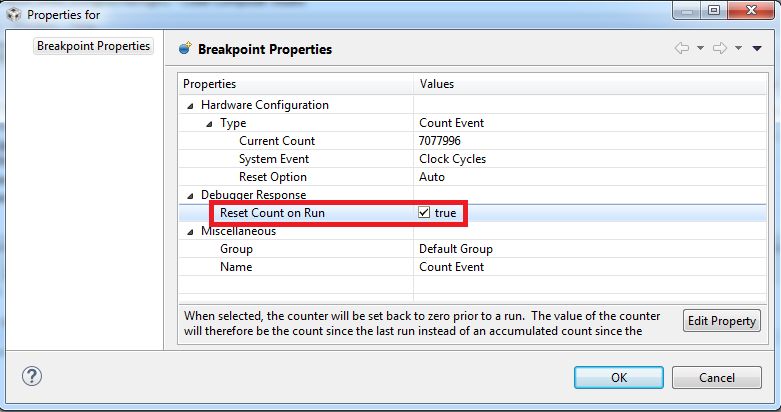
Right-click (or press the Control key and the mouse button simultaneously on Mac) on the event counter in the Breakpoints view and select Breakpoint Properties in the context menu
-
Enable the Reset Count on Run option in the properties dialog and press OK. This will reset the counter each time the target is executed.
-
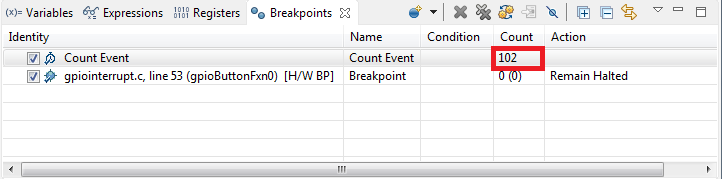
Single Step Over (F6) the GPIO_toggle() function (line 55) and check the counter, in the Breakpoints view, to see how many cycles it took to call the function (~100 cycles)
-
Remove both breakpoint and counter by right-clicking in the Breakpoints view and selecting Remove All in the context menu
Note
The counter uses a hardware breakpoint resource.
Watchpoints
A watchpoint is a type of breakpoint that monitors activity on a memory address or range of addresses. Like the counter, it can use one (or more) hardware breakpoint resources
-
Go to the Expressions view and enter the global variable count to the view
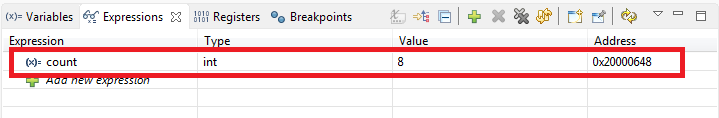
Note the value of count.
-
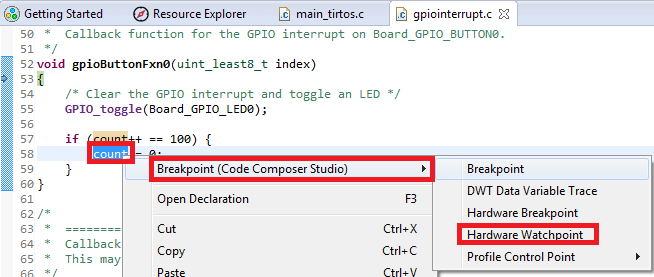
Highlight the variable count, right-click and select Breakpoint -> Hardware Watchpoint in the context menu
-
Right-click on the watchpoint in the Breakpoints view and select Breakpoint Properties in the context menu
-
Modify the properties so that the With Data field is set to Yes set the Data Value to a value to be 4 or 5 greater than the current value of count
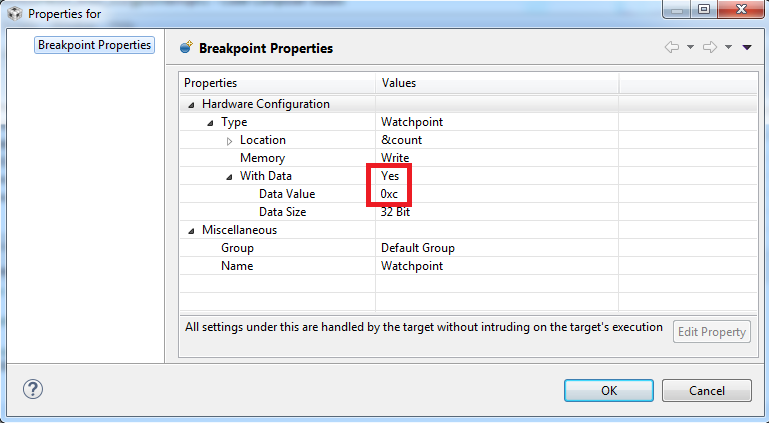
Hit OK to apply changes
-
Resume execution of the target. Press BOARD_GPIO_BUTTON1 and BOARD_GPIO_BUTTON0 until the target halts. Check the value of count in the Expressions view. Note that it should be the same value that was entered in the Data Value field for the watchpoint properties.
-
Remove the watchpoint using the Remove All Breakpoints button in the Breakpoints view.
Continuous Refresh and Real-Time Memory Access
Traditional debugging require the processor to be completely halted to access memory. ARM Cortex-M based devices support "real-time" memory access (via the DAP) which allows you to examine and modify contents of memory locations non-intrusively while the CPU is running and executing code
-
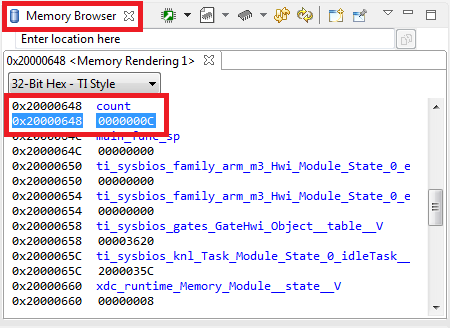
Right-click on count in the Expressions view and select View Memory in the context menu
The Memory Browser view will open to the address of count:
-
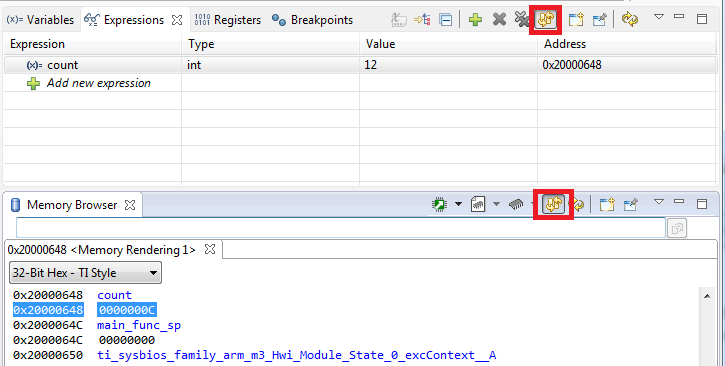
Enable Continuous Refresh in both the Expressions view and Memory Browser view. This will enable constant periodic refresh the views vs the default behavior to refresh on target halt
-
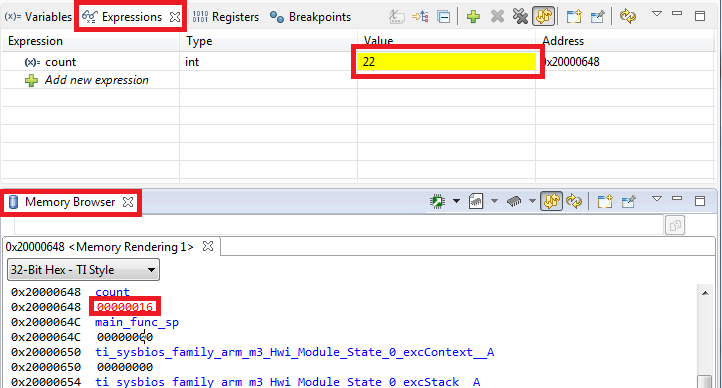
Resume execution of the target. Press BOARD_GPIO_BUTTON1 and BOARD_GPIO_BUTTON0. Notice how the value for count in the Expressions view and the Memory view will change while the target is running:
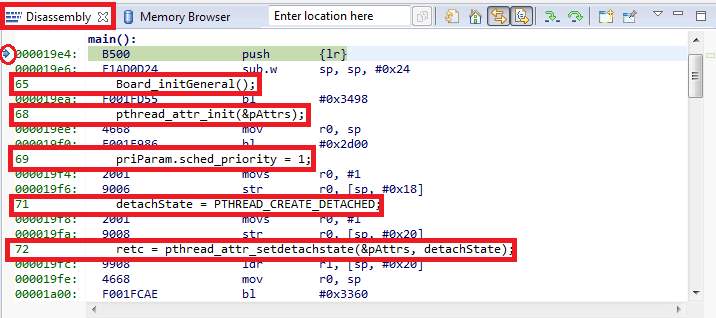
Disassembly View
-
Suspend the target (Run -> Suspend)
-
Restart the target (Run -> Restart). The program will be at the start of main
-
Open the Disassembly view by going to View -> Disassembly. You can see the current location of the PC (small blue arrow)
-
Toggle the Show Source button. Note the toggling of interleaved source with the disassembly
Other Views
Several other views are available under the View menu. Experiment with the various views.
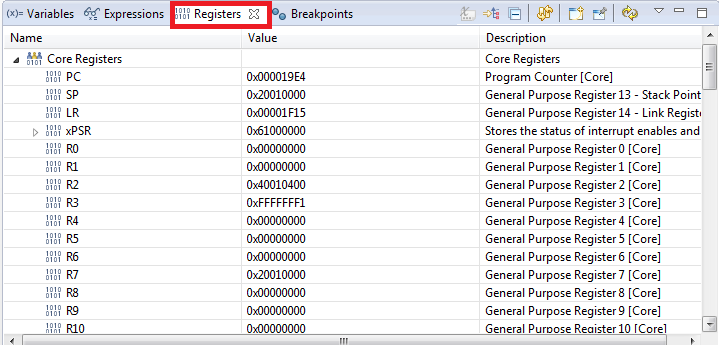
Registers view
The Registers view is used to display and edit the values of core and memory mapped (peripheral) registers
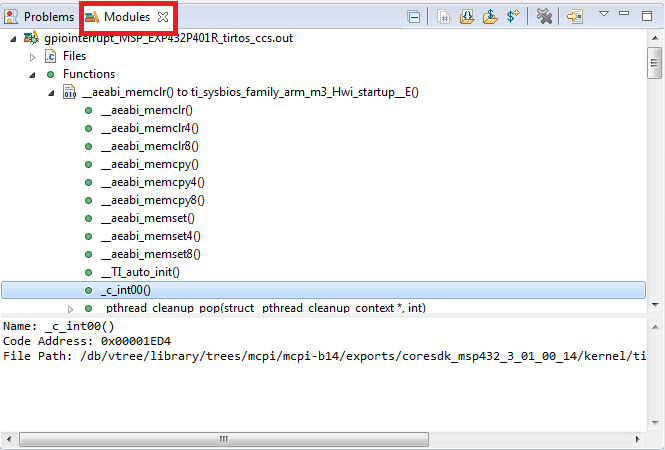
Modules view
The Modules view enables browsing of loaded debug symbols. This can be especially useful if projects are not being used as it provides file and function listings
Summary
In this lab we completed the following:
- Covered the basics of Debugging
- Learned how to use breakpoints and watchpoints
- Learned how to count events (cycles)
- Became familiar with the Disassembly view
- Real-time memory accesses with CCS
- How to enable Continuous Refresh in a view