Setting Up the Integrated Development Environment
All embedded software for Z-Stack is developed either using TI’s CCS or in IAR on a Windows® 7 or later PC. Path and file references in this document assume that the SimpleLink™ CC26x2R1 SDK has been installed to the default path, hereafter referred to as <INSTALL_DIR>. Projects do not build properly if paths below the top-level directory are modified. It is important to note that all source files are copied into the workspace folder for CCS users, while IAR workspaces are referring to the SDK source files. For this reason, IAR users are highly recommended to use version control if working with multiple projects from the same SDK is intended.
While Z-Stack supports CC26X2R1, CC1352R1 and CC1352P2 platforms, the following sections will describe the process for CC26X2R1. If other platforms are intended to be used a similar process can be followed just replacing the platform naming in the paths or files.
The following sections will address setting the SimpleLink™ CC26x2R1 SDK and Z-Stack resources as this is a common process for both CCS and IAR.
Installing the SDK
To install the SimpleLink™ CC26x2R1 SDK, run the installer: simplelink_cc26x2_sdk_2_20_00_xx.exe
Note
The xx indicates the SDK build revision number at the time of release.
The default SimpleLink™ CC26x2R1 SDK install path is:
C:\ti\simplelink_cc26x2_sdk_x_xx_xx_xx
Note
The ‘xx’ indicate version numbers.
Installing the SDK installs the TI-RTOS kernel, and XDC tools if not already installed.
Installing the Z-Stack Plugin
Download the Zigbee SDK Plugin and run the installer. The default installation path is: C:\ti\simplelink_zigbee_sdk_plugin_2_20_00_xx
Setting Up CCS Integrated Development Environment
To browse through the SDK projects and view the code as it is referenced in this document, it is necessary to install and set up the CCS integrated development environment (IDE). This section provides information on where to find this software and how to properly configure the workspace for the IDE.
Installing Code Composer Studio
Code Composer Studio (CCS) provides a suite of tools that are used to develop applications that run on TI’s MCUs and embedded processors. Code Composer Studio™ contains many features that go beyond the scope of this documention, more information can be found on the CCS website. Check the CC26X2R1 SimpleLink SDK release notes to see which Code Composer Studio™ version to use.
The following describes installing and configuring the correct version of CCS and the necessary tools.
- Download CCS 8.1.0.00011 from the Download CCS wiki page.
- Launch the CCS installer.
- On the Processor Support menu (see Figure 59.), expand SimpleLink Wireless MCUs and select SimpleLink CC13xx and CC26xx Wireless MCUs

Figure 59. Processor Support Menu Selections
- Click the Next button, then click the Finish button.
- Open CCS 8.1.0.00011 to a new workspace.
- Apply all available updates by selecting
Help→Check for Updates.
Note
This step may require restarting CCS as each update is applied.
Importing SDK Projects
Launch the CCS IDE and prepare to import the Z-Stack projects from the installed SDK:
Select Project → Import CCS Projects
Select Select search-directory: and click the Browse… button.
Navigate to
C:\ti\simplelink_zigbee_sdk_plugin_2_20_00_xx\examples\rtos\CC26X2R1_LAUNCHXL\zstack
select zc_light folder and click the OK button (see Figure 60.).

Figure 60. Import SDK Projects Menu Selection
- The Discovered projects box now lists the projects that have been found. Select the Copy projects into workspace checkbox, click the Select All button, and last click the Finish button to import a copy of each SDK project into the workspace (see Figure 61.).

Figure 61. CCS Project Import Pane
Workspace Overview
The workspace now contains all the files needed by the projects selected in the section above to build downloadable images. The following examples build a Light image, to produce a functional Light device.
In the Project Explorer pane, click on the zc_light_cc26x2lp project to make
it active. Click on the arrow to the left of the project to expand its contents,
as shown in Figure 62..

Figure 62. CCS Project Explorer Pane
In Figure 62., all folders (under the
zc_light_cc26x2lp project) except for zc_light_cc26x2lp can be
considered input folders, which contain source code files, header files, and
configuration files used to compile and link the application. The
zc_light_cc26x2lp folder contains output files, which include programmable
images and the linker map.
Compiling and Linking
All example projects in the SDK are ready to build out-of-the-box meaning they are preconfigured for use with a specific target board, in this case the CC26x2R1 LaunchPad™. To build a Light Application image that is ready to program onto a LaunchPad board, select Project → Rebuild Project. The Console pane of the IDE displays the individual results of source file compilations, followed by the linker results, as shown in Figure 63..

Figure 63. CCS Project Console Pane
In Figure 63., the output folder
zc_light_cc26x2lp is populated with results from a successful build of the
Light Application. Two programmable output files have been produced,``zc_light_cc26x2lp.out`` and zc_light_cc26x2lp.hex, along with a detailed
linker map file, zc_light_cc26x2lp.map.
Debugging
When debugging is necessary, .out files produced by the linker are downloaded and run from the CCS IDE. The following procedure would typically be used to debug the program.
Continuing with the Light example project, the compiled program can be downloaded to the target and a debug session initiated by selecting: Run → Debug on the IDE, as shown in Figure 64..

Figure 64. Debugging light Application
In Figure 64., the IDE has switched from the CCS
Edit perspective to CCS Debug and shows the program counter stopped at main().
From this starting point, the developer can single-step through source
code, set and run-to breakpoints, and run the program using icons at the top of
the display. During a debug session, the user can switch between the CCS Edit
and CCS Debug perspectives, as necessary, to view project files and perform
debugging operations.
Useful CCS IDE Settings
The CCS provides a large number of configurable settings that can be used to customize the IDE and individual projects. The following examples do not alter the generated program code, but they can improve the developer’s experience when working with CCS projects. The CCS can reduce project compilation time by taking advantage of multiple processor cores on the development computer.
To use this feature, navigate to Project → Properties → Build → Builder and select Enable parallel build, as shown in Figure 65..

Figure 65. Properties for zc_light_cc26x2lp
CCS users can control the amount of information that is displayed in the Console portion of the screen during project compilation and linking, ranging from Verbose to Super quiet. To change this setting, navigate to Window → Preferences → Code Composer Studio → Build and select an entry from the Console verbosity level drop-down, as shown in Figure 66.

Figure 66. Console Verbosity Level Preferences
Accessing Preprocessor Symbols
Throughout this document and in the source code, various C preprocessor symbols may need to be defined or modified at the project level. Preprocessor symbols (also known as Predefined Symbols) are used to enable and disable features and set operational values to be considered when the program is compiled. The preprocessor symbols are split between project specific preprocessor symbols and configuration header preprocessor symbols.
Project Specific Preprocessor Symbols
Configurations for a given example project are stored in CCS’s predefined symbols setting for that project.
In CCS, preprocessor symbols are accessed by opening the appropriate Project Properties by right clicking on the project in the Project Explorer and selecting Properties then navigating to CCS Build → ARM Compiler → Predefined Symbols. To add, delete, or edit a preprocessor symbol, use one of the icons shown in the red box in Figure 67..

Figure 67. Predefined Symbols Pane
The following table contains the preprocessor symbols which can be added or removed by the user depending on their end application needs
| Symbol | Description |
|---|---|
| BOARD_DISPLAY_USE_UART | Use UART communication for application information |
| NPI_UART | Use UART communication for ZNP processing |
| NV_INIT | Store network settings in non-volatile memory |
| NV_RESTORE | Restore previous network settings on start-up |
| POWER_MEAS | Optimal power settings for a Zigbee device |
| POWER_SAVING | Allows an end device to enter standby for lowest power operation |
| ZCL_[CLUSTER NAME] | Zigbee clusters allowed by the application |
| ZCL_[READ/WRITE] | Ability to process ZCL foundation incoming command and response messages |
| ZNP_NPI | If the device is a Zigbee Network Processor |
Note
While the preprocessor symbols should only pertain to the Zigbee device hardware and cluster library, some network settings may also be configured here.
Other compile options taken from preinclude header files such as f8wconfig.h.
The preincluded files can be accessed by opening the appropriate Project
Properties by right clicking on the project in the Project Explorer and
selecting Properties then navigating to CCS Build → ARM
Compiler → Include Options. To add, delete, or edit a
preincluded files, use one of the icons shown in the red box in
Figure 68..

Figure 68. Include Options Pane
Setting Up IAR Integrated Development Environment
To browse through the SDK projects and view the code as it is referenced in the following sections, it is necessary to install and set up the IAR integrated development environment (IDE). This section provides information on where to find this software and how to properly configure the workspace for the IDE.
Installing IAR Embedded Workbench
IAR (IAR) provides a suite of tools that are used to develop applications that run on TI’s MCUs and embedded processors. IAR contains many features that go beyond the scope of this documention, more information can be found on the IAR website. Check the CC26X2R1 SimpleLink SDK release notes to see which IAR version to use.
The following describes installing and configuring the correct version of IAR and the necessary tools.
- Download IAR 8.20.2 from their official webpage IAR website.
- Launch the IAR installer and follow the instructions from the installer until read USB Driver installation menu.
- In USB Driver installation menu, expand Debug Probe drivers and make sure TI XDS is selected as shown in Figure 69.

Debug Probe Selection
Click the Next button, and let the installation of the debug drivers be done with default values. TI emulators should be installed in the following path:
C:\ti
Importing SDK Projects
Launch the IAR IDE and prepare to import the Z-Stack projects from the installed SDK:
Select File → Open Workspace
Navigate to
C:\ti\simplelink_zigbee_sdk_plugin_2_20_00_xx\examples\rtos\CC26X2R1_LAUNCHXL\zstack\zc_light\tirtos\iar
select the workspace zc_light.eww and click the OK button (see Figure 70.).

Figure 70. Import SDK Projects Menu Selection
Workspace Overview
The workspace now contains all the files needed by the project selected in the
section above to build downloadable images. The following examples build a Light
image, to produce a functional Light device.
To see the list of files included in the workspace, go to the workspace pane and click the + sign to the left of the
project. You can also click the + sign to the folders contained to expand and see its content as shown in
Figure 71..

Figure 71. CCS Project Explorer Pane
In Figure 71., all folders (under the
zc_light - Release project) except for Output can be
considered input folders, which contain source code files, header files, and
configuration files used to compile and link the application. The
Output folder contains output files, which include programmable
images and the linker map.
Compiling and Linking
All example projects in the SDK are ready to build out-of-the-box meaning they are preconfigured for use with a specific target board, in this case the CC26x2R1 LaunchPad™. To build a Light Application image that is ready to program onto a LaunchPad board, select Project → Rebuild All. The Build pane of the IDE displays the individual results of source file compilations, followed by the linker results, as shown in Figure 72..

Figure 72. IAR Build Pane
After performing a successful build the output folder
Output is populated with results from the build of the
Light Application. One programmable output files have been produced, zc_light.out, along with a detailed
linker map file, zc_light.map.
Debugging
When debugging is necessary, .out files produced by the linker are downloaded and run from the IAR IDE. As all the projects are delivered without project settings, configure the debugger driver is necessary, this is done by going to Project → Options, which will open the options for zc_light project. In the project options window go to the Debugger section as shown in Figure 73. and select TI XDS as the driver.
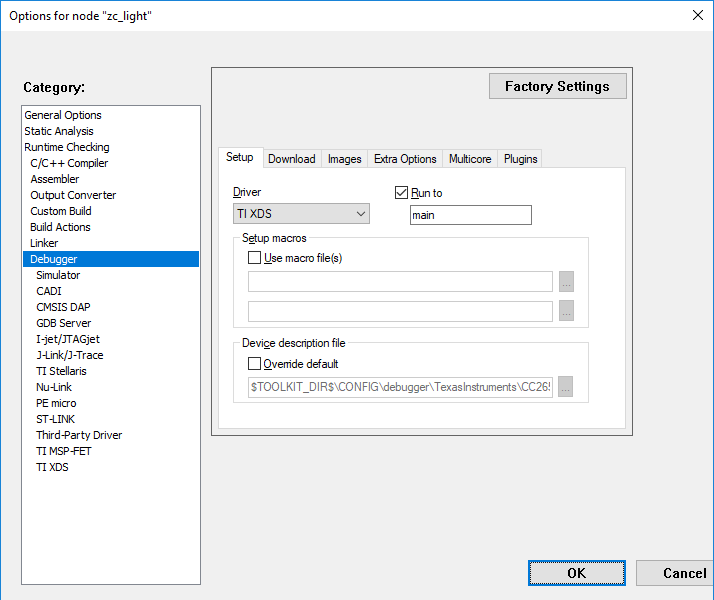
Figure 73. Project options window in Debugger section.
In the Debugger section, go to the Plugins tab and select TI-RTOS as shown in Figure 74.

Figure 74. Enabling TI-RTOS plugin for debugging.
Now go to the TI XDS section and select TI XDS110 Emulator as shown in Figure 75., after which, save the changes by pressing OK.

Figure 75. Setting the XDS110 Emulator.
Once the Debugger is set, select Project → Download and Debug to flash the device and debug
the project. The debug session starts the code at main().
From this starting point, the developer can single-step through source
code, set and run to breakpoints, and run the program using icons at the top of
the display.
Accessing Preprocessor Symbols
Throughout this document and in the source code, various C preprocessor symbols may need to be defined or modified at the project level. Preprocessor symbols (also known as Predefined Symbols) are used to enable and disable features and set operational values to be considered when the program is compiled. The preprocessor symbols are split between project specific preprocessor symbols and configuration header preprocessor symbols.
Project Specific Preprocessor Symbols
Configurations for a given example project are stored in IAR’s Extra Options in the Project options menu for that project. These are accessed by opening the project options by going Project → Options, in the options pane, go to C/C++ Compiler in the Extra Options tab as shown in Figure 76..

Figure 76. Extra options to define Preprocessor symbols
The preprocessor symbols are added in a new line and are preceded by -D. For example: to add the compile flag ZCL_READ, -DZCL_READ must be added as an Extra Option.
The following table contains the preprocessor symbols which can be added or removed by the user depending on their end application needs
| Symbol | Description |
|---|---|
| BOARD_DISPLAY_USE_UART | Use UART communication for application information |
| NPI_UART | Use UART communication for ZNP processing |
| NV_INIT | Store network settings in non-volatile memory |
| NV_RESTORE | Restore previous network settings on start-up |
| POWER_MEAS | Optimal power settings for a Zigbee device |
| POWER_SAVING | Allows an end device to enter standby for lowest power operation |
| ZCL_[CLUSTER NAME] | Zigbee clusters allowed by the application |
| ZCL_[READ/WRITE] | Ability to process ZCL foundation incoming command and response messages |
| ZNP_NPI | If the device is a Zigbee Network Processor |
Note
While the preprocessor symbols should only pertain to the Zigbee device hardware and cluster library, some network settings may also be configured here.
The precompile files in IAR are different from CCS, being f8wconfig.opts
and the defines being preceed by -D prefix to be included correctly.
These files can be accessed by the same way as the preprocessor symbols in Figure 76.
Packet Sniffer
Ubiqua Protocol Analyzer
Install the Required Software
- Download the Ubilogix Ubiqua packet sniffer software from: https://www.ubilogix.com/ubiqua/
- To get the drivers for the CC2531EMK dongle install the TI Packet sniffer from: https://www.ti.com/tool/packet-sniffer
- To program the CC2531EMK install TI Flash Programmer from: https://www.ti.com/tool/flash-programmer
- To get the drivers for the CC2650/CC2652LP install the TI Packet sniffer 2 from: https://www.ti.com/tool/packet-sniffer
- To program the CC2650/CC2652LP install UniFlash from: https://www.ti.com/tool/UNIFLASH
Required Hardware
One of the following boards should be used:
- TI CC2531EMK USB Dongle: https://www.ti.com/tool/CC2531USB-RD
- (optional for programming CC2531EMK) CC-debugger https://www.ti.com/tool/cc-debugger
- TI CC2652 Launchpad: https://www.ti.com/tool/LAUNCHXL-CC26X2R1
- TI CC2650 Launchpad: https://www.ti.com/tool/LAUNCHXL-CC2650
Hardware Setup
- Connect the CC2531EMK/CC2650LP/CC2652LP to the computer with Ubiqua installed.
- If necessary, program your relevant sniffer hardware.
- For CC2531EMK, use the hex
image
sniffer_fw_cc2531.hexatC:\Program Files (x86)\Texas Instruments \SmartRF Tools\Packet Sniffer\bin\general\firmwareand Flash Programmer. - For CC2650/CC2652LP, use
sniffer_fw_15_4.hexatC:\Program Files (x86)\Texas Instruments \SmartRF Tools\SmartRF Packet Sniffer 2\sniffer_fw\bin\{your_device}\15.4and UniFlash.
- For CC2531EMK, use the hex
image
Running the Packet Sniffer
Connect your sniffing hardware to your PC.
Start Ubiqua.
Select Menu -> Device -> Add Device, and the Add Device window will appear.

Figure 77. ubiqua add device
In the Available Devices column click the Local Devices expander, and select your hardware, either the CC2531EMK or the Application COM Port of the CC2650/CC2652 LaunchPad.
For the CC2531EMK, follow the prompts to add the device. For the CC2650/CC2652LP, refer to the settings below:

Figure 78. Ubiqua select device
Right click on your device in the Device Manager window, and select the Protocol Stack option.
Click on the ZigBee checkbox.

Figure 79. Ubiqua select Zigbee protocol option
Choose the Channel
- In Z-Stack, the channel is set by DEFAULT_CHANLIST in f8wConfig.h
From Ubiqua, select Menu -> Device Channel, and choose the matching channel:

Figure 80. Ubiqua channel selection
Enter the Default TC Link Key
- In order to decrypt Zigbee traffic, you will need to enter the default Trust Center Link Key into the Ubiqua keychain.
From Ubiqua, select Tools -> Options -> Security -> ‘Add’ -> Application or Trust Center Link Key
Enter the following key:
5a6967426565416c6c69616e63653039
Start Capture
From Ubiqua, Select Menu -> Device -> Start Device

Figure 81. Starting capture
If required, Select: Menu -> View -> Traffic View (or other selections) to view activity.
Wireshark
Install the Required Software
- TI Packet Sniffer 2: https://www.ti.com/tool/packet-sniffer
- Wireshark: https://www.wireshark.org/#download
- To program the CC2650/CC2652LP install UniFlash from: https://www.ti.com/tool/UNIFLASH
Required Hardware
One of the following boards should be used:
- TI CC2652 Launchpad: https://www.ti.com/tool/LAUNCHXL-CC26X2R1
- TI CC2650 Launchpad: https://www.ti.com/tool/LAUNCHXL-CC2650
Hardware Setup
- Connect the CC2650/CC2652LP to the computer with Ubiqua installed and determine the correct COM Port for your LaunchPad. It will be the “XDS110 Class Application/User UART” port for your device, you can determine this in Windows by going to Device Manager > Ports
- If necessary, program your relevant sniffer hardware.
- For CC2650/CC2652LP, use
sniffer_fw_15_4.hexatC:\Program Files (x86)\Texas Instruments \SmartRF Tools\SmartRF Packet Sniffer 2\sniffer_fw\bin\{your_device}}\15.4and UniFlash.
- For CC2650/CC2652LP, use
Running the Packet Sniffer
Connect your sniffing hardware to your PC.
Start SmartRF Packet Sniffer 2 Sniffer Agent and select Device Configuration

Select your IEEE channel to sniff

If your Sniffer Agent looks like this, you are ready to set up Wireshark:

Add the TI 15.4 Wireshark Dissector to Wireshark (assuming x64 installation)
Navigate to
C:\Program Files (x86)\Texas Instruments\SmartRF Tools\
SmartRF Packet Sniffer 2\wireshark\plugins\2.4.x\
and copyti802154ge-x64-2x.dllandtirpi-x64-2x.dlltoC:\Program Files\Wireshark\plugins\2.4.3\Open Wireshark go to Edit > Preferences > Protocols > Zigbee add the Zigbee TC Link Key
5a6967426565416c6c69616e63653039
Close Wireshark and create a new Desktop shortcut for Wireshark and add the following to the path:
-i\\.\pipe\tiwspc_data -kThis will set up the Pipe that sends data from Sniffer Agent into Wireshark

Open Wireshark with the new shortcut and you will see Wireshark sniffing Zigbee data.
Downloading binaries Files
As shown in the sections above CCS produces .hex and IAR produces .out files that are ready for direct download to the target hardware. Both binaries can be downloaded to a target device by a stand-alone tool, such as the UniFlash, shown in Figure 82..

Figure 82. Programming binaries Files
Make sure you have your CC26x2R1 LaunchPad™ board connected, Uniflash should detect it in Detected Devices as shown in Figure 82.. Then press the Start button.
As shown in Figure 83., Uniflash can be used to program the prebuilt hex file using the Flash image(s) → Single feature. Use the Browse… button to navigate to the workspace path and select the hex file:
For CCS:
{Workspace Path}\zc_light_cc26x2lp\zc_light_cc26x2lp
For IAR:
{SDK Path}}\examples\rtos\CC26X2R1_LAUNCHXL\zstack\zc_light\tirtos\iar\Debug\Exe

Figure 83. Programming Hex Files
The binary file can be programmed retaining the Nv or erasing the whole flash from the device by selecting the proper option from Erase Settings in Settings & Utilities menu shown in Figure 84.

Figure 84. UniFlash Settings