5.1. DSP Optimized Libraries
5.1.1. Available Libraries
The table below lists currently available libraries and the corresponding information - whether they are included in Proc-SDK Linux or RTOS, supported devices, and documentation links.
| Library | Proc-SDK Linux | Proc-SDK RTOS | Supported Devices | Documentation |
|---|---|---|---|---|
| MATHLIB | No | Yes | K1/K2/AM57x | MATHLIB Documentation |
| DSPLIB | No | Yes | K1/K2/AM57x | DSPLIB Documentation |
| IMGLIB | No | Yes | K1/K2/AM57x | IMGLIB Documentation |
| LibArch | Yes | Yes | C6678(RTOS) /K2H(Linux) /AM572x (Linux) | LibArch User’s Guide |
| FFTLIB | Yes | Yes | C6678(RTOS) /K2H(Linux) /AM572x (Linux) |
FFT User’s Guide (RTOS): Refer to FFT LIB folder |
| LINALG | Yes | Yes | C6678(RTOS) /K2H(Linux) /AM572x (Linux) | LINALG User’s Guide |
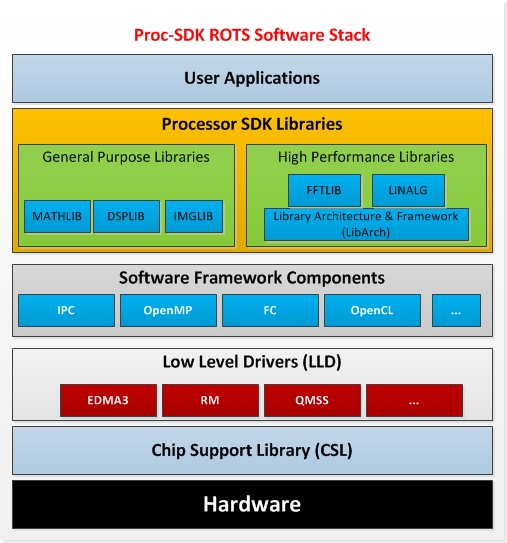
Processor SDK libraries can be categorized into two groups, general purpose libraries and high performance or application specific libraries.
5.1.1.1. General Purpose Libraries
- MATHLIB:Standalone download page
- DSPLIB: Standalone download page
- IMGLIB: Standalone download page
These libraries are delivered with TI C66x object code and included in Processor-SDK ROTS. For development in Processor-SDK Linux, they can be downloaded from the links listed above and used in any C66x DSP code.
5.1.1.2. High Performance or Application Specific Libraries
- LibArch: Library Architecture and Framework, an abstraction layer for multi-core DSP library development.
- FFTLIB: optimized library for performing fast Fourier transform.
- LINALG: optimized library for performing dense linear algebra computations.
These libraries are available in both Processor-SDK RTOS and Processor-SDK Linux.
5.1.2. Library Usage
Libraries can be used in either Processor-SDK RTOS or Processor-SDK Linux.
5.1.2.1. Using Libraries in Processor-SDK RTOS
The following diagram illustrates the software stack of various components including libraries provided with the Processor-SDK RTOS.
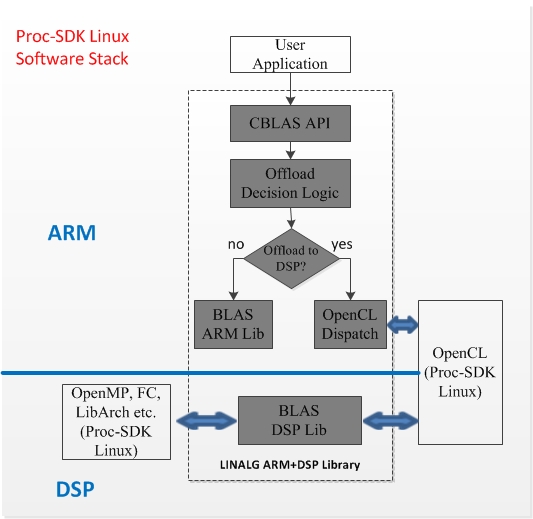
5.1.2.2. Using Libraries in Processor-SDK Linux
The following diagram illustrates the software stack in Processor-SDK Linux environment, taking LINALG as an example. Applications access the libraries on the host (ARM) side, and the actual computation may be executed on ARM or DSP according to configuration and problem size. This is explained in detail in each library’s documentation page.
5.1.3. Delivery Format
All libraries are delivered with both source code and object code. The source code can be recompiled according to the instructions given in each individual library’s documentation.
5.1.4. Core benchmark comparison
Please refer to Core Benchmarks for DSP vs A15 core benchmark comparison for computation intensive tasks.
5.2. DSP Debug and Trace
5.2.1. CToolsLib
5.2.1.1. Introduction
See CToolsLib Article for a comprehensive article on cToolsLibs and the hardware modules supported.
5.2.1.2. Overview
- CToolsLib is collection of embedded target APIs/library focused to enable easy programmatic access to CTools debug capabilities
- CToolsLib purpose is provided in source code for easy integration into applications
- CToolsLib consists of several libraries
5.2.1.2.1. AETLib
- The AETLIB library provides programmatic access to the Advanced Event Triggering capability on 64x and 64x+ processor cores.
5.2.1.2.2. ETBLib
- This library provides the ability to program and read trace data from an Embedded Trace Buffer (ETB). The ETB can be used with other libraries to setup and capture DSP core trace data, ARM core trace data, or STM data sources.
- In some devices each core has a dedicated ETB, while others have a single ETB shared between trace sources.
- After the ETB data is read into local memory, the user must transport the binary trace data back to a host where the binary trace data can be converted to text, csv or a .tdf file that can be imported into CCS for display. The GettingStarted.htm file (available at [1] )provides instructions for generating these files from utilities provided with CCS.
- The Examples projects are also a good source of information on using ETBLib for different cases.
- Instructions for STM EDMA Example to extend ETB using target memory
- Instructions for DSPTrace EDMA Example to extend ETB using target memory
5.2.1.2.3. DSPTraceLib
- This library provides the ability to programmaticly setup 64x+ DSP trace export.
5.2.1.2.4. ETMLib
- The ETM Library provides the interface to configure and control instruction and data tracing during program execution. A trace session is defined as the time frame from the trace system getting armed(enabled and waiting for a start trace condition), to the time when the trace completes, either from an end trace condition that has been configured or a manual call to stop tracing.
- Developed and tested for the CortexA8 on TCI6614 and C6A816x devices.
- The ETMLib Examples page provides instructions on how to run the examples and display the results.
5.2.1.2.5. STMLib
- This library provides “C” printf and binary APIs for hardware assisted (System Trace software messages) instrumentation in your code. STM messages are captured via an ETB or with an external XDS560v2 System Trace receiver.
- For instructions on setting up CCS to capture STM data see Using System Trace(STM).
5.2.1.2.6. ITMLib
- The ITMLib provides “C” string amd binary value logging APIs for TI M3/M4 devices that includes an ITM module and supports SWD (Serial Wire Debug) with SWO (Serial Wire Output) Trace. ITM requires at a minimum CCSv5.5 and emupack 5.1.340.0 with an XDS2xx or XDS110 (Note: your XDS may need a firmware update to work with “SWD with SWO Trace”. See your XDS vendor for firmware update instructions).
5.2.1.2.7. CPTLib
- The Common Platform Tracer modules provides profile information via STM messages for critical buses within the device. CPTLib provides low level CP Tracer module setup. The provided use case based helper file combined with CPTLib makes for an easy to use environment. For examples see Common platform Tracer Examples. For debug help see Debugging with Common Platform Tracer.
5.2.1.2.8. cTools_UCLib
- The cTools_UCLib is a library for Keystone family devices (C66xx, TCI66xx, 66AK2Hxx, 66AK2Exx and TCI6630K2L) that consolidates the most common CP Tracer and AET/DSP Trace uses cases into a single library. The Library also consolidates ETB setup and operation into a few easy to use functions.
- Use cases supported include:
- Exception tracking with DSP Trace
- Application Program Counter Trace
- Illegal Memory Access Watching with DSP Trace
- CP Tracer Strategic Bus Throughput and Latency profiling
- Function Statistical Profiling with DSP Trace
- Keystone Ctools_UCLib examples (platform specific CCS projects) are available as a separate zip package in the file repository listed below.
- Keystone Ctools_UCLib examples are also available as a part of Keystone MCSDK instrumentation. For more details please refer to Keystone MCSDK instrumentation examples
- For more information about Ctools use-cases, please refer to Ctools_UCLib doxygen at Ctools_UCLib/doc/Ctools_UCLib.html/index.html
5.2.1.2.9. PMICMILib
- The PMI and CMI units provide power and clock state profiling via STM messages. The PMICMILib provides a common programming and control API for both units. For more details see OMAP4 Power and Clock management Profiling.
5.2.1.2.10. Linux Kernel Driver for STM printf
- Linux kernel module device driver enables applications to use MIPI STM as a standard character device driver. Users can redirect output (from printf) to a STM device, or directly write() to the STM device from their application. For details and examples see STM Linux Device Driver.
5.2.1.2.11. SCILib
- The OMAP44xx and OMAP54xx Statistic Collectors provides profile data for SDRAM load monitoring and Master load and Latency monitoring. Data is exported as STM messages. SCILib provides a use case based API for configuring and controlling bus profile data for all the statistic collectors on a device.
- Use cases supported include:
- Average Throughput (for SDRAM and Master SC Modules)
- Link Occupancy (for SDRAM and Master SC Modules)
- Average Burst Length (for SDRAM and Master SC Modules)
- Average Latentcy (For Master SC Module only)
5.2.1.3. Examples
- The CToolsLib examples package contains device or platform specific CCSv5 examples, which portrays typical use case scenarios involving individual or multiple CTools libraries. These examples also show how to integrate various CTools libraries into one’s application SW.
- The following are the various supported devices or platforms:
- Keystone1 family of devices (C667x, C665x and TCI661x)
- Keystone2 family of devices (66AK2Hxx, 66AK2Exx and TCI6630K2L)
- TCI648x family of devices
- OMAP family of devices (OMAP44xx and OMAP54xx)
- C6A816x family of devices
- DRA7xx family of devices
5.2.1.4. Documentation
- There is a generated Doxygen API description included with each CToolsLib.
5.2.1.5. Download
All cToolsLib libraries and example source are available in the links below. After downloading the zips you need, simply expand each zip under the same top level directory. All library and example projects are compatible with CCSv6.
| Library | Purpose | File Repository |
|---|---|---|
| GettingStarted | Provides processor specific notes for libraries and examples | GettingStarted |
| STMLib | Software Message Library | STMLib_5.2 |
| AETLib | Software library for programmatically using the 64x+ AET hardware breakpoint and watchpoint units. Also useful for triggering/halting trace. | aet_4.18 |
| ETBLib | Software Library for configuring and retrieving the ETB contents. | ETBLib_1.22 |
| ETMLib | Software Library for configuring ARM CortexA8 Core Trace triggering. | ETMLib_0.6 |
| DSPTraceLib | Software Library to configure DSP Trace export | DSPTraceLib_1.14 |
| cTools_UCLib | Library that configures key Keystone CP Tracer and DSP Trace Use Case | Ctools_UCLib_1.5 |
| PMICMILib | Power and Clock management Instrumentation Library | PMICMILib_1.3 _ |
| SCILib | Statistic Collector Instrumentation Library | SCILib_1.5 |
| CPTLib | CP Tracer Instrumentation Library | CPTLib_0.15 |
| ITMLib | Instrumentation Trace Macrocell Library | ITMLib_1.1 |
| Examples | CToolsLib Examples | Examples_5.9 |
| Ctools_UCLib_Examples | CTools Use-Case Library Examples | Ctools_UCLib_ Examples_1.3 |
The latest release of all libraries now come with CCS projects. Please refer GettingStarted.htm for more details.
5.2.1.6. Trace Decoding
To decoder trace from a binary dump of the ETB memory, two tools are avaialble:
Bin2TDF utility
Refer here for the detail on using BIN2TDF.
TD utility
Refer here for the detail on using TD .
5.2.1.7. Support
Frequent Asked Questions (FAQ)
Q: Can I get the source code?
- A: The source code is included with each library.
Q: How do I know if my device supports CTools?
- A: The datasheet or Technical Reference Manual (TRM) will usually contain details on the features support and avaialble on your device. If you are unsure, you may wish to ask in the support forum.
Q: Do I have to use CToolsLib with Code Composer Studio?
- A: No, other tools such as Lauterbach Trace32 can be used with the CToolsLib. Please contact your tools vendor regarding support.
Q: Do you have approximate cycle counts for each library?
- A: For AETlib there is a file called “aetlib_profiling_stats.txt” that gives this information
- A: For ETBLib, on the TI c6x compiler on a 64x+ device, it takes approximately 1000 cycles per call at the “-o2” optimization level.
Q: Do you have the code size for each library?
- A: For AETlib there is a file called “aetlib_size_stats.txt” that gives this information
- A: For ETBLib, on the TI c6x compiler on a 64x+ device, it is approximately 4KB at the “-o2” optimization level.
Q: What license is this code provided under? / Is the code GPL compatible?
- A: The header files in CToolsLib will have the relevant licenses. Generally, CToolsLib is licnesed under modified BSD license which is GPL compatible. Please see this wikipedia article.
- TI.com XDS560 Product Page
- XDS560v2 System Trace
- CTools
- How OMAP software developers use System Trace to boost performance
- Using System Trace (STM)
- Etblib Example Here
5.2.2. UIA
5.2.2.1. Overview
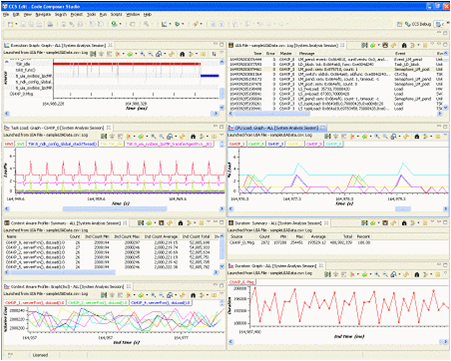
System Analyzer is a real-time tool for analyzing, visualizing and profiling application running on single or multi core systems. Data is collected using UIA (Unified Instrumentation Architecture) software instrumentation on the target and transported via Ethernet, run-mode JTAG, stop-mode JTAG, USB or UART to the host PC for analysis and visualization in Code Composer Studio.
In a multi core system, data from all cores are correlated to a single timeline.
5.2.2.2. Unified Instrumentation Architecture (UIA)
UIA is the target-side package which defines the APIs, transports, interfaces and guidelines that enable developers to instrument embedded software in a way that is portable and flexible. It enables the creation of advanced tooling that can be used both in the lab and in the field. The framework includes:
- a messaging infrastructure that allows instrumentation clients to interact with instrumentation endpoints on a target device while the target is running
- an extensible set of commands and messages that can be sent over the messaging infrastructure
- protocols to be used by the target-side instrumentation framework and the host-side instrumentation client
- built-in instrumentation for DSP/BIOS for ‘out of the box’ real-time visibility into the operation of the O/S
- guidelines on how to instrument other RTOSes
5.2.2.2.1. Portable and Flexible
System Analyzer and UIA are designed to be portable and flexible:
- ISA independent: UIA can be re-used across a wide range of TI platforms, single-core devices and multi-core devices
- O/S independent: UIA not tied to any specific operating system
- Transport independent: can use a wide variety of different transports to upload software events from the target to the host, without having to change the source code
- Platform independent: Host-side tooling works on both Windows and Linux platforms
- IDE independent: Host-side tooling will support both tight integration with Code Composer Studio and stand-alone operation for use with other IDEs.
System Analyzer together with it’s UIA packages define an instrumentation framework that enables the development of instrumentation client tools, instrumented target content, infrastructure components, and instrumentation middleware components that interoperate and can be re-used across TI platforms and devices.
5.2.2.2.2. Available Analysis
- RTOS Execution Graph
- CPU Load
- Task Load
- Duration Analysis
- Context-aware Function Profiler
- Concurrency Analysis
- Task Profiler
- Count/Statistical Analysis
Execution Graph
Graphical representation of RTOS context switches, events, semaphores, HWIs and SWIs. Start/Stop events logged for Duration Analysis and Enter/Exit events logged for Function Profiler are also shown in graph. In a multi core system all cores are shown in the same graph on the same timeline.
CPU Load
Graphical representation and min, max, average statistics of CPU loading data collected from RTOS. In a multi core system loading and statistics for all cores are shown.
Task Load
Graphical representation and min, max, average statistics of task loading data collected from RTOS. In a multi core system different instance of analysis can be opened for each core.
Duration Analysis
Analyze time to perform operations. Start/Stop events logged for each operation is used to calculate and graph the time for each instance of each operation. Summary statistics (including count, min, max and average) is also shown for each operation.
Context Aware Function Profiler
Min, max and average inclusive time (includes time spend in called functions) and exclusive time (excludes time spent in called functions) for functions. Functions to be profiled must have their entry and exit instrumented. See FAQ below on how to leverage compiler entry/exit hook functions. For context awareness, RTOS context switch logging must also be enabled.
Concurrency Analysis
This is a multi-core tool to analyze parallel execution of application across multiple cores. RTOS Idle task is use to determine when the core is not in use. Task switch logging must be enabled for this analysis.
Task Profiler
The task profiler analyzes what percent of time tasks are spending in their different states. RTOS context switch events are required for this analysis.
Count/Statistical Analysis
Graphical representation of any counter/variable that is being logger. Also calculates number of occurrences and min, max, average value for each counter/variable.
Note
TIRTOS/SYSBIOS instrumentation is not enabled by default. See User Guide or Tutorials on how to enable this.
Note
More information on the analysis features is available in the System Analyzer User’s Guide.
5.2.2.3. Documents and Tutorials
System Analyzer Getting Started Guide - Get familar with System Analyzer features using a data file shipped with CCStudio.
System Analyzer User’s Guide - Detail guide on configuring and using System Analyzer and UIA.
System Analyzer Tutorials (CCSv5) - Includes a series of projects that can be built and use, along with step-by-step walkthroughs of how to configure code, set up System Analyzer, work with Analysis Features, etc.
5.2.2.4. System Analyzer and the MCSDK Demo
System Analyzer provides visibility into the real-time behavior and performance of the BIOS MCSDK 2.0 Image Processing Demo. The System Analyzer and the MCSDK Demo page provides more information about how to use System Analyzer with the MCSDK.
5.2.2.5. Known Issues/Errata
CCS Crash when opening Graph in System Analyzer
- It appears that some graphics card drivers are not compatible with Eclipse support for text rotation. This may result in a CCS crash (inside the graphics driver) when opening graphs in System Analyzer (graphs use text rotation for y-axis label). If you encounter this problem, try updating the graphics card driver. This has resolved the occurrences of this problem we’ve seen so far.
Multicore correlation not working
- Multicore event correlation is not automatically supported for JTAG transports (it is supported for Ethernet). User can explicitly add synchronization logs to enable correlation. (See Tutorial 4B for details)
- if the target is halted (either by explict halt or implicit halts such as Console I/O / CIO) while data is being collected via Ethernet then correlation will not work.
- if some target is generating data very infrequently then correlation may timeout resulting in uncorrelated data. In this case the data can be saved to a binary file and post process for correlation to work.
uia_1_00_04_35 : Tutorial 1 and Tutorial 2 do not build properly.
- The build fails with the error “dc.services.global.XDCException: xdc.PACKAGE_NOT_FOUND: can’t locate the package ‘ti.sysbios.knl’”
- To overcome this, please unzip UIAMetaData.zip <uia_1_00_04_35 install folder>/packages/ti/uia/runtime/ to update the UIAMetaData.xs file. Then delete the <Debug> folder from your project and rebuild.
uia_1_03_00_02 : JTAG Transport does not work properly on some devices.
- Project builds cleanly, System Analyzer starts normally, but no events are captured.
- To overcome this, please use uia_1_03_01_08 or later.
5.2.2.6. FAQs
Q: When can I use System Analyzer auto configuration
When launching a Live or Binary File session users can choose to let System Analyzer auto configure itself. For this to work you must:
- have a debug session running with the symbol/program file loaded
- generated rta and uia xml file (program.rta.xml and program.uia.xml) files should be located where the project generated them or in the same folder as the .out file
- if using Ethernet transport it is expected that IP address is output in the console
Q: Configuring System Analyzer when auto configuration is not possible
See Configuring System Analyzer Transport and Endpoints in Chapter 4 of the System Analyzer User’s Guide.
Q: Can I launch System Analyzer before the target if running
If using Ethernet transport, System Analyzer expects that the target is up and running and the Ethernet connection is established before it is started. For JTAG transport the target does not have to be running.
Q: What happens if the target is halted while collecting data using Ethernet transport
Halting the target may result in the ethenet connection getting disconnected. The connection can be re-established using the connect button.
Q: How to Profile functions using enter and exit hook functions
In order to do inclusive and exclusive profiling of functions(using Context Aware Profiler of System Analyzer), a UIA log is needed at the entry and exit point of functions. One can add entry and exit hook functions to every function in the source by doing the following
Use the following compiler options when compiling the source
--entry_hook=functionEntryHook
--entry_parm=address
--exit_hook=functionExitHook
--exit_parm=address
To use the required UIA events, need this include
#include <ti/uia/events/UIABenchmark.h>
Add entry and exit hook functions to the source (The below one is for Context aware function profiling)
void functionEntryHook( void (*addr)() ){
    Log_write3(UIABenchmark_startInstanceWithAdrs, (IArg)"context=0x%x, fnAdrs=0x%x:",(IArg)0, (IArg)addr);
}

void functionExitHook( void (*addr)() ){
    Log_write3(UIABenchmark_stopInstanceWithAdrs,  (IArg)"context=0x%x, fnAdrs=0x%x:",(IArg)0, (IArg)addr);
}
For CCS 5.5 and later
void functionEntryHook( void (*addr)() ){
    Log_write2(UIAProfile_enterFunctionAdrs, (IArg)0, (IArg)addr);
}

void functionExitHook( void (*addr)() ){
    Log_write2(UIAProfile_exitFunctionAdrs,  (IArg)0, (IArg)addr);
}
The 1st parameter after the message string( 3rd parameter to Log_write3) is a context parameter (For CCS 5.5 and later is the 2nd parameter to Log_write2) and can be used to specify an additional level of qualification (e.g. Task Context). For our purpose out here we can ignore this and just set it to 0.
If task aware profiling is needed, the Task context has to be logged. SYS/BIOS automatically logs events for task switches and SWI and HWI Start and Stop events. See Enabling and Disabling logging Sec 5.2.2 in the System Analyzer User’s Guide. Context change can also be explicitly logged by the application. For more on Profiling using system analyzer refer to Section 3.5,4.12 of the user’s guide.
Profiling Results when using Libraries: Hook functions will not be added and hence called from functions in libraries that have been linked in. This will cause the Exclusive counts of the functions making calls to the Library, to include the Library functions duration.
5.2.2.7. Trouble Shooting
System Analyzer Events or Packets are being dropped
See Troubleshooting System Analyzer Connections section in the System Analyzer User’s Guide.
No Events showing up in System Analyzer Views
See Troubleshooting System Analyzer Connections section in the System Analyzer User’s Guide.
System Analyzer cannot connect to the target to retrieve logs
See Troubleshooting System Analyzer Connections section in the System Analyzer User’s Guide.
System Analyzer Events do not make sense
See Troubleshooting System Analyzer Connections section in the System Analyzer User’s Guide.
Time values in the logs are too large
See Troubleshooting System Analyzer Connections section in the System Analyzer User’s Guide.
5.2.2.8. Technical Support and Product Updates
For technical discussions and issues, please visit
- E2E Processor Support: https://e2e.ti.com/support/processors/
- BIOS Embedded Software forum: http://e2e.ti.com/support/embedded/f/355.aspx
- Embedded Processors Documentation:
Note
When asking for help in the forum you should tag your posts in the Subject with “System Analyzer”, the part number (e.g. “C6678”), and component (e.g. “UIA”).
For product updates, - Use the CCS/Eclipse Update Manager (see the Getting Started Guide above)
5.2.3. Trace
5.2.3.1. Overview
In a multicore environment there would be data generated by a producer in one core and would need to be consumed by multiple consumers in other cores/same core. For example, a target log information to be consumed by ARM and CCS System Analyzer.
The trace framework (TF) provides a mechanism to send the information to multiple consumers for a given producer. In trace framework, Producer populates the associated Ring buffer. Consumers consume the ring buffer and send the data to external actual consumers (like System Analyzer in CCS). The hand shake between producers and consumers happen using shared memory area known as contract memory between producers and consumers.
It is upto the consumer application to either send the data to final consumers (using ethernet for System Analyzer) or local consuption for any OAM (Operations and maintenance) features on ARM.
5.2.3.2. Driver Configuration
Traceframework requires Producer, Consumer and Contract shared memory to be configured using tf_contractInit(), tf_contractCreate(), tf_prodCreate() and tf_consCreate() functions. For details about individual fields of this structure, see the Doxygen help by opening PDK_INSTALL_DIR\Traceframeworkckages\ti\drv\Traceframework\docs\doxygen\html\index.html.
5.2.3.3. APIs
API reference for application:
#include <ti/instrumentation/traceframework/traceframework.h>
5.2.3.4. Example
| Name | Description | Expected Results |
|---|---|---|
| Traceframework_UnitTe stApplication | Unit Test
application to test
all APIs
|
User observes the
output printed over
the CCS console
|
5.2.3.5. Application Integration Details
Sys BIOS DSP (C66) Use case
Reference library path to be included in application build environment:
<ti/instrumentation/traceframework/lib/c66>
SysBIOS based application
Any RTSC application that needs to use trace framework library, should have a RTSC configuration file. Please refer to <ti/instrumentation/traceframework/test/TFUnitTest/<soc>/c66/bios/tfw_Uia_utest.cfg> sample RTSC cfg file for reference.
5.2.3.6. Additional References
| Traceframework Library Summary | |
|---|---|
| Component Type | Library |
| Install Package | PDK |
| Install Directory | pdk_keystone_<version>\packages\ti\ instrumentation\traceframework |
| Project Type | Eclipse RTSC |
| Endian Support | Little |
| Linker Path | $(TI_PDK_INSTALL_DIR)/packages/ti/ instrumentation/traceframework |
| Linker Sections | .vecs , .switch, .args, .cio |
| Include Paths | $(TI_PDK_INSTALL_DIR)/packages/ti/ instrumentation/traceframework |
| Reference Guides | $(TI_PDK_INSTALL_DIR)/packages/ti/ instrumentation/traceframework/docs/ doxygen/html/index.html |
| Release Notes Resources | $(TI_PDK_INSTALL_DIR)/packages/ti/ instrumentation/traceframework/docs/ ReleaseNotes_traceframework.pdf |
5.2.4. Fault Management
5.2.4.1. Introduction
This section describes the Fault Management APIs and provides information on how to instrument a DSP image for exception. This library is currently supported for K2x devices only.
5.2.4.2. FM DSP Exception APIs & Usage
A DSP application can create and install an exception hook configured with the following features using the APIs provided by FM:
- Retrieve DSP register status for a core dump
- Halt system IO, such as DMAs
- Inform remote DSPs an exception has occurred
- Inform ARM/Host a DSP exception has occurred
Retrieving Last Register Status
An exception hook function that intends to create a core dump must call the following API:
void Fault_Mgmt_getLastRegStatus(void);
The API stores relevant DSP core register values into the memory region mapped to the fault_mgmt_data data array for the core dump that is provided to the ARM/Host.
Halting System IO
When a DSP exception is detected, invoking the FM instrumented exception hook function, system IO that offload data transfers can be stopped using the following API:
Fault_Mgmt_haltIoProcessing(Fm_GlobalConfigParams *fmGblCfgParams, Fm_HaltCfg *haltCfg)
The API provides the ability to disable all or subsets of the following system IO:
- AIF2 PE (Tx) and PD (Rx) channels
- EDMA3 DMA, QDMA, and INT channels
- CPDMA Tx/Rx channels
- SGMII switch
The exception hook can invoke this function in order to stop DSP enabled IO from continuing data transfers that may wipe out data important to deciphering the source of the DSP exception. However, care must be taken to not disable resources in use by the ARM/Host. If this occurs the ARM/Host may experience unstable behavior preventing it from properly receiving and handling the DSP core dump.
IO Halt Configuration Parameters
The Fm_HaltCfg structure is used to define which system IO will be disabled upon invocation of the IO halt API. A user can specify that an entire IO be disabled or a subset of an IO be disabled. The Fm_HaltCfg structure has the following parameters:
int32_t haltAifIf set to a non-zero value, will halt all AIF2 PE and PD channels except those specified within the Fm_ExcludedResource’s list. All AIF2 PE and PD channels will be disabled if the Fm_ExcludedResource’s list is NULL.int32_t haltSGMIIIf set to a non-zero value, will halt the SGMII ethernet switch. Note: This will prevent ARM Linux ethernet from working properly.int32_t haltEdma3If set to a non-zero value, will halt all EMDA3 DMA, QDMA, and INT channels except those specified within the Fm_ExcludedResource’s list. All EDMA3 DMA, QDMA, and INT channels will be disabled if the Fm_ExcludedResource’s list is NULL. Note: Some EDMA3 channels are used by ARM Linux to access NAND in UBIFS. UBIFS will not work correctly if these channels are halted.int32_t haltCpdmaIf set to a non-zero value, will halt all CPDMA channels except those specified within the Fm_ExcludedResource’s list. All CPDMA channels will be disabled if the Fm_ExcludedResource’s list is NULL. Note: Some CPDMA channels are used by ARM Linux which will exhibit unknown behavior if the relevant CPDMA channels are halted.Fm_ExcludedResource *excludedResources;List of specific system IO values that should not be disabled.
A customized version of the Fm_ExcludedResource’s list can be created. However, a version has been created and supplied in pdk_#_##_##_##\packages\ti\instrumentation\fault_mgmt\device\k2x\src\fm_device.c which already accounts for all resources used the ARM Linux kernel delivered with the latest PROCSDK release.
Note
Following the IO halt configuration defined in the FM test source code will diable all IO except that used by ARM Linux UBIFS and NFS.
Informing Remote DSP Core’s of Exception
Remote DSP cores can be informed of a DSP exception and told to halt functioning using the following API:
void Fault_Mgmt_notify_remote_core(uint32_t core_id);
The DSP local to the exception will interrupt remote cores via their NMI causing them to enter their own exception handling routine. This allows all DSPs to be brought down when a single DSP exception occurs. In multi-core application this may help preserve information relevant to deciphering the root cause of the original DSP exception.
Informing ARM/Host of DSP Exception
A DSP core can inform the ARM/Host an exception has occurred via the following API:
void Fault_Mgmt_notify(void);
This function will notify the ARM/Host an exception has occurred via Remoteproc and should be the last FM API called within the instrumented exception hook function.
5.2.4.3. Instrumenting a DSP Application with FM Exception APIs
Create and install an exception hook in the DSP application that utilizes the DSP FM APIs.
- In the .cfg (Configuro Script) file of the application add following commands to create a section
var devType = "k2?";  /* Replace k2? with the k2 device in use k2e, k2h, k2k, or k2l */
/* Load and use the Fault Management package */
var Fault_mgmt = xdc.useModule('ti.instrumentation.fault_mgmt.Settings')
Fault_mgmt.deviceType = devType;

/*
 * The SysMin used here vs StdMin, as trace buffer address is required for
 * Linux trace debug driver, plus provides better performance.
 */
Program.global.sysMinBufSize = 0x8000;
var System = xdc.useModule('xdc.runtime.System');
var SysMin = xdc.useModule('xdc.runtime.SysMin');
System.SupportProxy = SysMin;
SysMin.bufSize = Program.global.sysMinBufSize;

/* Configure resource table for trace only.
   Note that traceOnly parameter should not
   be set if application is using MessageQ based IPC
   to communicate between cores.
 */
var Resource = xdc.useModule('ti.ipc.remoteproc.Resource');
Resource.loadSegment = Program.platform.dataMemory;
Resource.traceOnly = true;

/* Load the Exception and register a exception hook */
var Exception = xdc.useModule('ti.sysbios.family.c64p.Exception');
Exception.exceptionHook = '&myExceptionHook';
Exception.enablePrint = true;

/* Add note section for coredump */
Program.sectMap[".note"] = new Program.SectionSpec();
Program.sectMap[".note"] = Program.platform.dataMemory;
Program.sectMap[".note"].loadAlign = 128;
- In a source/header file, create a exception hook function as follows
/* Fault Management Include File */
#include <ti/instrumentation/fault_mgmt/fault_mgmt.h>

Void myExceptionHook(Void)
{
    uint32_t   i;
    Fm_HaltCfg haltCfg;
    uint32_t   efr_val;

    /* Copy register status into fault management data region for ARM/Host */
    Fault_Mgmt_getLastRegStatus();

    memset(&haltCfg, 0, sizeof(haltCfg));
    efr_val = CSL_chipReadEFR();

    /* If triggered exception originates from another core through
     * NMI exception don't need to halt processing and notify other cores
     * since the parent core where the exception originally triggered via
     * event would notify them.  This eliminates recursive exceptions */
    if (!(efr_val & 0x80000000)) {
        /* Halt all processing - Only need to be done on one core */
        haltCfg.haltAif = 1;
        haltCfg.haltCpdma = 1;
#if EXCLUDE_LINUX_RESOURCES_FROM_HALT
        haltCfg.haltSGMII = 0;
        /* EDMA used by kernel to copy data to/from NAND in UBIFS */
        haltCfg.haltEdma3 = 0;
        haltCfg.excludedResources = &linuxResources[0];
#else
        haltCfg.haltSGMII = 1;
        haltCfg.haltEdma3 = 1;
        haltCfg.excludedResources = NULL;
#endif

        Fault_Mgmt_haltIoProcessing(&fmGblCfgParams, &haltCfg);

        for (i = 0; i < fmGblCfgParams.maxNumCores; i++) {
            /* Notify remote DSP cores of exception - WARNING: This will generate NMI
             * pulse to the remote DSP cores */
            if (i != CSL_chipReadDNUM()) {
                Fault_Mgmt_notify_remote_core(i);
            }
        }
    }

    /* Notify ARM/Host of crash */
    Fault_Mgmt_notify();
}
A sample test application is provided in pdk_#_##_##_##\packages\ti\instrumentation\fault_mgmt\test\k2x\c66\bios\fmCoreDumpK2XC66TestProject. The test application uses the default resource exclusion list provided with FM in pdk_#_##_##_##\packages\ti\instrumentation\fault_mgmt\device\k2x\src. The default list has been configured to exclude all Linux owned IO from the halting on exception. This allows the Linux kernel to remain operational after DSP exception so that the core dump can be processed.
Note
It is recommended that the IO halt configuration defined within #if EXCLUDE_LINUX_RESOURCES_FROM_HALT be used in addition to halting AIF and CPDMA if Linux must remain active after a DSP exception occurs. This IO halt configuration has been tested with both UBIFS and NFS. The documented configuration shuts down all IO except those needed by Linux to operate, such as EDMA3 (for access to NAND), the SGMII (for Ethernet), and Linux owned CPPI DMAs.
5.2.4.4. FM Global Configuration Parameters
The Fm_GlobalConfigParams structure informs the IO halt and cleanup features of the system peripheral resource ranges that could not be pulled from CSL. The user should not create their own version of this structure. Instead, the version of the structure provided within pdk_#_##_##_##\packages\ti\instrumentation\fault_mgmt\device\k2x\src\fm_device.c should be used. This structure has been statically created based on device peripheral parameters.
5.2.4.5. FM Tests
The Fault Management module comes with a single test application, fmCoreDumpK2HC66TestProject. The fmCoreDumpK2HC66TestProject forces a DSP exception which causes the FM core dump logic to execute. The example can be run from CCS or downloaded from Linux via MPM. After executing the application, from the Linux shell, check /var/log/syslog for a message saying a crash event was detected on the DSP to which the core dump test was loaded and run.
5.2.4.6. Additional References
| Document | Location |
| Fault Management API Reference Manual | $(TI_PDK_INSTALL_DIR)\packages\ ti\instrumentation\fault_mgmt\ docs\doxygenhtmlindex.html |
| Fault Management Release Notes | $(TI_PDK_INSTALL_DIR)\packages\ ti\instrumentation\fault_mgmt\ docs\ReleaseNotes_fault_mgmt.pdf |
5.2.5. WDT
5.2.5.1. Introduction
The Watchdog Timer Module provides configuration and use of the watchdog timer mode for the DSP local timers. The watchdog mode is a 64-bit timer mode for the local timers.
5.2.5.2. Modes of Operation
Following modes of operations are supported
- DEFAULT_NO_OUTPUT_EVENT: Default on system reset, WD timeout causes no output event
- LOCAL_RESET_INPUT: WD timeout causes local reset input to CorePac
- NMI_INPUT: WD timeout causes NMI input to CorePac
- NMI_INPUT_PLUS_LOCAL_RESET_INPUT: WD timeout causes an NMI input followed by a local reset input. The delay between the NMI and the local reset is configurable.
- DEVICE_RESET: WD timeout event causes a device reset.
Resets can be configured as a hard or soft reset.
5.2.5.3. Driver Configuration
5.2.5.3.1. Watchdog Timer Configuration Structure
The watchdog timer configuration is passed at the time of the
WatchdogTimer_Init() function call and cannot be changed afterwards. For
details about individual fields of the configuration structure,
WatchdogTimer_InitCfg, see the Watchdog Timer XDC by opening
[PDK_INSTALL_DIR]\packages\ti\instrumentation\wdtimer\WatchdogTimer.xdc.
5.2.5.3.2. APIs
API reference for application:
#include <ti/instrumentation/wdtimer/WatchdogTimer.h>
5.2.5.3.3. Initialize a Watchdog Timer
At this point the watchdog timer is enabled and running.
5.2.5.3.4. Service Watchdog Timer
The watchdog timer must be serviced prior to the configured period in order to avoid a timeout. The following API is used to service the watchdog timer, resetting the count back to zero.
WatchdogTimer_ResetTimer()
5.2.5.3.5. Tests
| Name | Description | Expected Results |
|---|---|---|
| Watchdog Timer Test Application | Tests configuration
and expiration of
DSP watchdog
timers. Reference
test for
developers.
|
Watchdog timer
expires on all DSP
cores.
See
ti/instrumentation/
wdtimer/test/
README.t xt
for more details.
|
5.2.5.4. Additional References
| Document | Location |
| API Reference Manual | $(TI_PDK_INSTALL_DIR)\packages\ ti\instrumentation\wdtimer\ docs\doxygen\html\index.html |
| Release Notes | $(TI_PDK_INSTALL_DIR)\packages\ ti\instrumentation\wdtimer\do cs\ReleaseNotes_WatchdogTimer.pdf |